#SEI/USDT - Final Support Before a Major Reversal or Breakdown#SEI
The price is moving in a descending channel on the 1-hour timeframe. It has reached the lower boundary and is heading towards breaking above it, with a retest of the upper boundary expected.
We have a downtrend on the RSI indicator, which has reached near the lower boundary, and an upward rebound is expected.
There is a key support zone in green at 0.1116. The price has bounced from this zone multiple times and is expected to bounce again.
We have a trend towards consolidation above the 100-period moving average, as we are moving close to it, which supports the upward movement.
Entry price: 0.1130
First target: 0.1139
Second target: 0.1158
Third target: 0.1179
Stop loss: Below the support zone in green.
Don't forget a simple thing: capital management.
For inquiries, please leave a comment.
Thank you.
Seicoin

#SEI/USDT - Final Support Before a Major Reversal or Breakdown#SEI
The price is moving in a descending channel on the 1-hour timeframe. It has reached the lower boundary and is heading towards breaking above it, with a retest of the upper boundary expected.
We have a downtrend on the RSI indicator, which has reached near the lower boundary, and an upward rebound is expected.
There is a key support zone in green at 0.1071. The price has bounced from this zone multiple times and is expected to bounce again.
We have a trend towards consolidation above the 100-period moving average, as we are moving close to it, which supports the upward movement.
Entry price: 0.1082
First target: 0.1094
Second target: 0.1112
Third target: 0.1135
Don't forget a simple principle: money management.
Place your stop-loss below the support zone in green.
For any questions, please leave a comment.
Thank you.

#SEI/USDT - Final Support Before a Major Reversal or Breakdown#SEI
The price is moving in a descending channel on the 1-hour timeframe. It has reached the lower boundary and is heading towards a breakout, with a retest of the upper boundary expected.
We are seeing a bearish bias in the Relative Strength Index (RSI), which has reached near the lower boundary, and an upward bounce is expected.
There is a key support zone in green at 0.1146, and the price has bounced from this level several times. Another bounce is expected.
We are seeing a trend towards stabilizing above the 100-period moving average, which we are approaching, supporting the upward trend.
Entry Price: 0.1205
First Target: 0.1219
Second Target: 0.1248
Third Target: 0.1280
Remember a simple principle: Money Management.
Place your stop-loss order below the green support zone.
For any questions, please leave a comment.
Thank you.

#SEI/USDT - Final Support Before a Major Reversal or Breakdown#SEI
The price is moving in a descending channel on the 1-hour timeframe. It has reached the lower boundary and is heading towards breaking above it, with a retest of the upper boundary expected.
We have a downtrend on the RSI indicator, which has reached near the lower boundary, and an upward rebound is expected.
There is a key support zone in green at 0.1330. The price has bounced from this level multiple times and is expected to bounce again.
We have a trend towards consolidation above the 100-period moving average, as we are moving close to it, which supports the upward movement.
Entry price: 0.1342
First target: 0.1388
Second target: 0.1440
Third target: 0.1508
Don't forget a simple principle: money management.
Place your stop-loss below the support zone in green.
For any questions, please leave a comment.
Thank you.

SEI/USDT — 0.11–0.092 Will Decide the Next Major Move?SEI is now approaching one of the most critical demand zones on the entire 5D chart: the 0.11–0.092 range.
This isn’t just another support area — it’s the structural base that previously triggered a major rally.
Now, price is retesting the same zone, but this time under a much weaker and clearly bearish trend.
At this moment, the market is sitting at a level where one decisive candle could determine SEI’s direction for the next several months.
---
📌 Key Structure & Pattern Highlights
Long-term downtrend: Consistent lower highs and lower lows since the 2024–2025 peak.
Descending trendline: Price is nearing a confluence between the trendline and the demand zone — a potential reversal zone.
0.11–0.092 demand zone: A historically strong base and arguably the most important support on the current multi-day chart.
Extreme liquidity wick to 0.064: Indicates heavy liquidity below — a potential magnet if a breakdown occurs.
In simple terms: SEI is standing at its final support before the cliff.
---
🎯 Bullish Scenario — Demand Zone Ambush
For the bullish case to be valid, SEI must show strong reaction signs within the 0.11–0.092 zone.
Bullish confirmation criteria:
Bullish engulfing or strong-body candle on 5D
Long lower wick rejection inside the zone
Rising buy volume on reaction
Upside targets if a reversal occurs:
1. Target 1: 0.18 — first resistance zone
2. Target 2: 0.22–0.30 — mid-range liquidity area
3. Target 3: 0.40+ — only if structure fully shifts bullish
Bullish summary:
The 0.11–0.092 demand zone could act as a launchpad if buyers step in aggressively.
No confirmation = no sustainable reversal.
---
⚠️ Bearish Scenario — Breakdown Opens Deeper Downside
If SEI fails to hold above 0.092, the long-term structure breaks completely.
Breakdown confirmation:
5D candle closes below 0.092
Failed retest (support flips to resistance)
Strong volume on breakdown
Downside targets if breakdown occurs:
Main target: 0.064 — previous extreme liquidity wick
Further downside possible if 0.064 fails, forming a new long-term low
Bearish summary:
Losing this zone triggers a capitulation leg, opening room for deeper decline.
---
The 0.11–0.092 zone is SEI’s last major defense.
A strong reaction here = potential multi-month bullish reversal.
A breakdown = continuation of the macro downtrend toward deeper lows.
This is the point where trend direction is decided.
---
#SEI #SEIUSDT #CryptoAnalysis #DemandZone #SupportLevel #BreakdownAlert #TechnicalAnalysis #PriceAction #SwingTrading

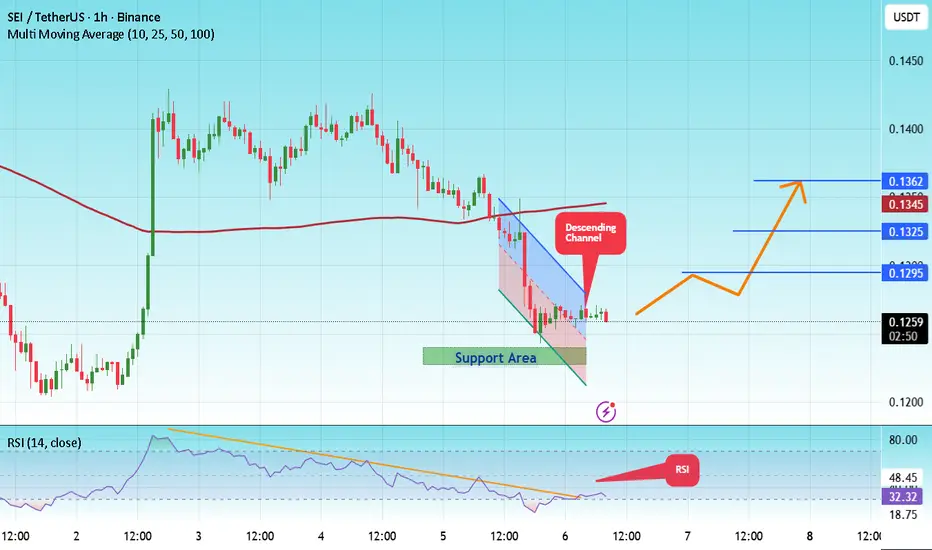
#SEI/USDT - Final Support Before a Major Reversal or Breakdown#SEI
The price is moving in a descending channel on the 1-hour timeframe. It has reached the lower boundary and is heading towards a breakout, with a retest of the upper boundary expected.
We are seeing a bearish trend in the Relative Strength Index (RSI), which has reached near the lower boundary, and an upward bounce is expected.
There is a key support zone in green at 0.1235, and the price has bounced from this level several times. Another bounce is expected.
We are seeing a trend towards stabilizing above the 100-period moving average, which we are approaching, supporting the upward trend.
Entry Price: 0.1262
First Target: 0.1295
Second Target: 0.1325
Third Target: 0.1362
Remember a simple principle: Money Management.
Place your stop-loss order below the green support zone.
For any questions, please leave a comment.
Thank you.
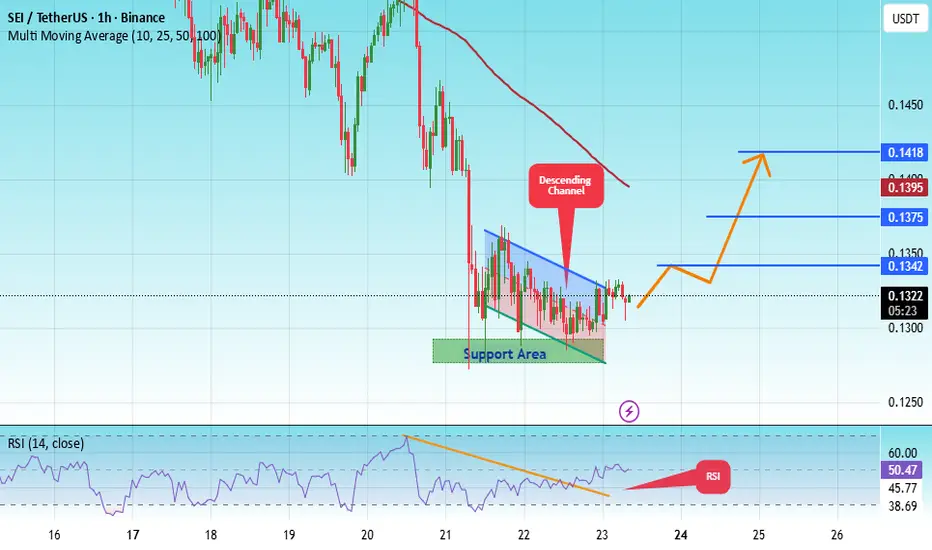
#SEI/USDT - Final Support Before a Major Reversal or Breakdown#SEI
The price is moving in a descending channel on the 1-hour timeframe. It has reached the lower boundary and is heading towards breaking above it, with a retest of the upper boundary expected.
We have a downtrend on the RSI indicator, which has reached near the lower boundary, and an upward rebound is expected.
There is a key support zone in green at 0.1205. The price has bounced from this zone multiple times and is expected to bounce again.
We have a trend towards consolidation above the 100-period moving average, as we are moving close to it, which supports the upward movement.
Entry price: 0.1222
First target: 0.1233
Second target: 0.1257
Third target: 0.1285
Don't forget a simple principle: money management.
Place your stop-loss order below the green support zone.
For any questions, please leave a comment.
Thank you.

#SEI/USDT - Final Support Before a Major Reversal or Breakdown#SEI
The price is moving within an ascending channel on the 1-hour timeframe and is adhering to it well. It is poised to break out strongly and retest the channel.
We have a downtrend line on the RSI indicator that is about to break and retest, which supports the upward move.
There is a key support zone in green at 0.1280, representing a strong support point.
We have a trend of consolidation above the 100-period moving average.
Entry price: 0.1321
First target: 0.1342
Second target: 0.1375
Third target: 0.1418
Don't forget a simple money management rule:
Place your stop-loss order below the green support zone.
Once you reach the first target, save some money and then change your stop-loss order to an entry order.
For any questions, please leave a comment.
Thank you.
#SEI/USDT - Final Support Before a Major Reversal or Breakdown#SEI
The price is moving within an ascending channel on the 1-hour timeframe and is adhering to it well. It is poised to break out strongly and retest the channel.
We have a downtrend line on the RSI indicator that is about to break and retest, which supports the upward move.
There is a key support zone in green at 0.1460, representing a strong support point.
We have a trend of consolidation above the 100-period moving average.
Entry price: 0.1488
First target: 0.1508
Second target: 0.1533
Third target: 0.1564
Don't forget a simple money management rule:
Place your stop-loss order below the green support zone.
Once you reach the first target, save some money and then change your stop-loss order to an entry order.
For any questions, please leave a comment.
Thank you.

#SEI/USDT - Final Support Before a Major Reversal or Breakdown#SEI
The price is moving within an ascending channel on the 1-hour timeframe and is adhering to it well. It is poised to break out strongly and retest the channel.
We have a downtrend line on the RSI indicator that is about to break and retest, which supports the upward move.
There is a key support zone in green at 0.1600, representing a strong support point.
We have a trend of consolidation above the 100-period moving average.
Entry price: 0.1646
First target: 0.1685
Second target: 0.1733
Third target: 0.1787
Don't forget a simple money management rule:
Place your stop-loss order below the green support zone.
Once you reach the first target, save some money and then change your stop-loss order to an entry order.
For any questions, please leave a comment.
Thank you.

#SEI/USDT - Final Support Before a Major Reversal or Breakdown#SEI
The price is moving within an ascending channel on the 1-hour timeframe and is adhering to it well. It is poised to break out strongly and retest the channel.
We have a downtrend line on the RSI indicator that is about to break and retest, which supports the upward move.
There is a key support zone in green at the 0.1600 price level, representing a strong support point.
We have a trend of consolidation above the 100-period moving average.
Entry price: 0.1628
First target: 0.1628
Second target: 0.1680
Third target: 0.1719
Don't forget a simple money management rule:
Place your stop-loss order below the green support zone.
Once you reach the first target, save some money and then change your stop-loss order to an entry order.
For any questions, please leave a comment.
Thank you.

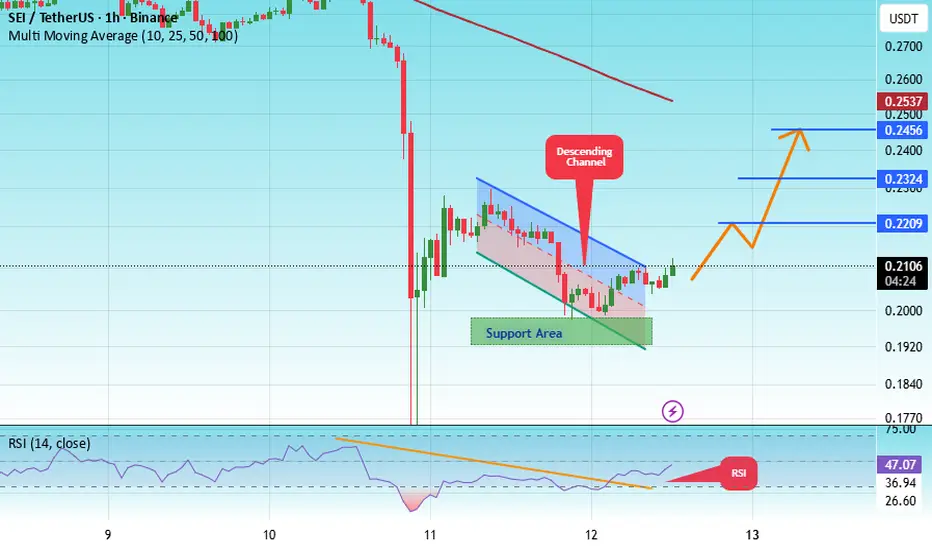
#SEI/USDT — Triangle Pattern Breakout Ahead?#SEI
The price is moving within a descending channel on the 1-hour frame, adhering well to it, and is heading for a strong breakout and retest.
We have a bearish trend on the RSI indicator that is about to be broken and retested, which supports the upward breakout.
There is a major support area in green at 0.1950, which represents a strong support point.
We are heading for stability above the 100 moving average.
Entry price: 0.2110
First target: 0.2210
Second target: 0.2324
Third target: 0.2456
Don't forget a simple matter: capital management.
When you reach the first target, save some money and then change your stop-loss order to an entry order.
For inquiries, please leave a comment.
Thank you.
SEI/USDT;BUY LIMITHello friends
Given that the price has reached the specified support and the price is supported by buyers within the specified range and the specified resistance has been broken, we can buy in steps with risk and capital management and move to the specified targets.
*Trade safely with us*

SEI/USDT — Bullish Flag at Demand Zone, Ready for Another Rally?📌 Overview
SEI/USDT recently completed a strong rally in mid-2025, forming a powerful flagpole. Since then, the price has been consolidating within a bullish flag pattern — a technical setup that often signals trend continuation after a healthy pause.
Currently, the price is trading around 0.2944 USDT, holding above key demand zones and Fibonacci levels. This suggests the market is in an accumulation phase, storing energy for its next major move.
---
📊 Pattern & Key Levels
Main structure: Bullish Flag (downward-sloping channel following a sharp rally).
Critical support:
0.2680 (Fib 0.5)
0.2437 (Fib 0.618)
These levels act as the structural foundation of the flag. As long as they hold, the bullish outlook remains intact.
Immediate resistance:
0.3462 – 0.3705 (intra-flag resistance, early breakout confirmation zone).
0.4727 – 0.5104 (major supply area, mid-term target).
Theoretical target:
A confirmed breakout projects the flagpole extension, pointing toward 0.60 – 0.73 in the medium term.
---
🚀 Bullish Scenario (Base Case)
1. Breakout confirmation: A 2D candle close above the upper flag trendline with strong volume.
2. Upside targets:
0.3462 – 0.3705 → breakout validation.
0.4727 – 0.5104 → significant supply zone.
0.60 – 0.73 → projected continuation target from the flagpole.
3. Healthy retest: A breakout followed by a pullback to retest the flag’s upper boundary and hold would strengthen the bullish case.
---
⚠️ Bearish Scenario (Risk Case)
If the price closes below 0.2437, the bullish flag structure will be invalidated.
Downside levels to watch:
0.21 (lower channel support).
0.13 (historical low and extreme demand zone).
This scenario remains less likely while the demand zone holds, but risk management is crucial.
---
✨ Conclusion & Insight
SEI is currently in a healthy consolidation phase after a strong rally, forming a textbook bullish flag.
The zone around 0.2680 – 0.2437 is the last line of defense for bulls.
If the breakout is confirmed, SEI could re-enter a strong uptrend with ambitious targets up to 0.73 USDT.
In other words: SEI is at a critical decision point. Traders and investors should closely monitor these levels, as the next move may define SEI’s trend into Q4 2025.
---
#SEI #SEIUSDT #CryptoAnalysis #BullishFlag #TechnicalAnalysis #Altcoin #PriceAction #ChartPattern

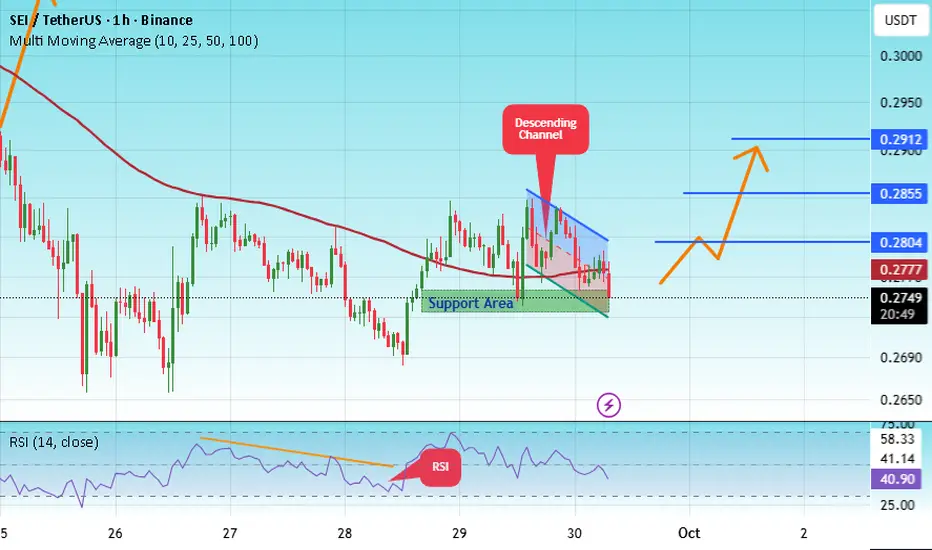
#SEI/USDT — Triangle Pattern Breakout Ahead?#SEI
The price is moving within a descending channel on the 1-hour frame, adhering well to it, and is heading for a strong breakout and retest.
We have a bearish trend on the RSI indicator that is about to be broken and retested, which supports the upward breakout.
There is a major support area in green at 0.2736, representing a strong support point.
We are heading for consolidation above the 100 moving average.
Entry price: 0.2756
First target: 0.2804
Second target: 0.2855
Third target: 0.2912
Don't forget a simple matter: capital management.
When you reach the first target, save some money and then change your stop-loss order to an entry order.
For inquiries, please leave a comment.
Thank you.
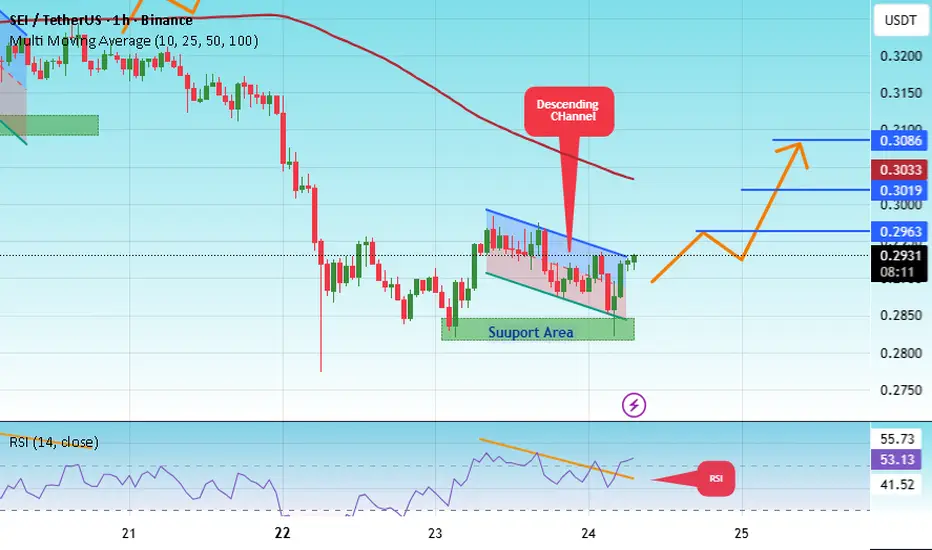
#SEI/USDT — Triangle Pattern Breakout Ahead?#SEI
The price is moving within a descending channel on the 1-hour frame, adhering well to it, and is heading for a strong breakout and retest.
We have a bearish trend on the RSI indicator that is about to be broken and retested, which supports the upward breakout.
There is a major support area in green at 0.2700, which represents a strong support point.
We are heading for consolidation above the 100 moving average.
Entry price: 0.2721
First target: 0.2768
Second target: 0.2805
Third target: 0.2858
Don't forget a simple matter: capital management.
When you reach the first target, save some money and then change your stop-loss order to an entry order.
For inquiries, please leave a comment.
Thank you.
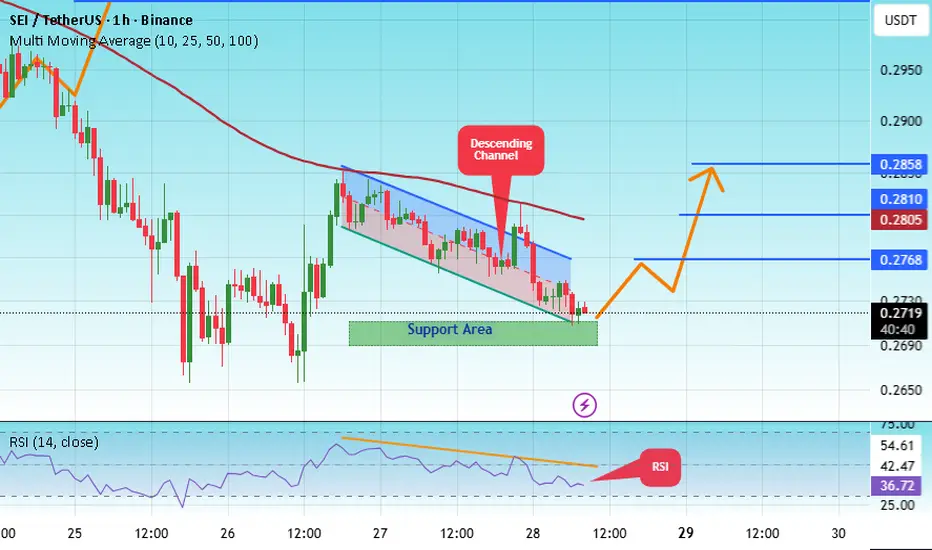
#SEI/USDT — Triangle Pattern Breakout Ahead?#SEI
The price is moving within a descending channel on the 1-hour frame, adhering well to it, and is heading for a strong breakout and retest.
We have a bearish trend on the RSI indicator that is about to be broken and retested, which supports the upward breakout.
There is a major support area in green at 0.2830, representing a strong support point.
We are heading for consolidation above the 100 moving average.
Entry price: 0.02913
First target: 0.2963
Second target: 0.3020
Third target: 0.3086
Don't forget a simple matter: capital management.
When you reach the first target, save some money and then change your stop-loss order to an entry order.
For inquiries, please leave a comment.
Thank you.
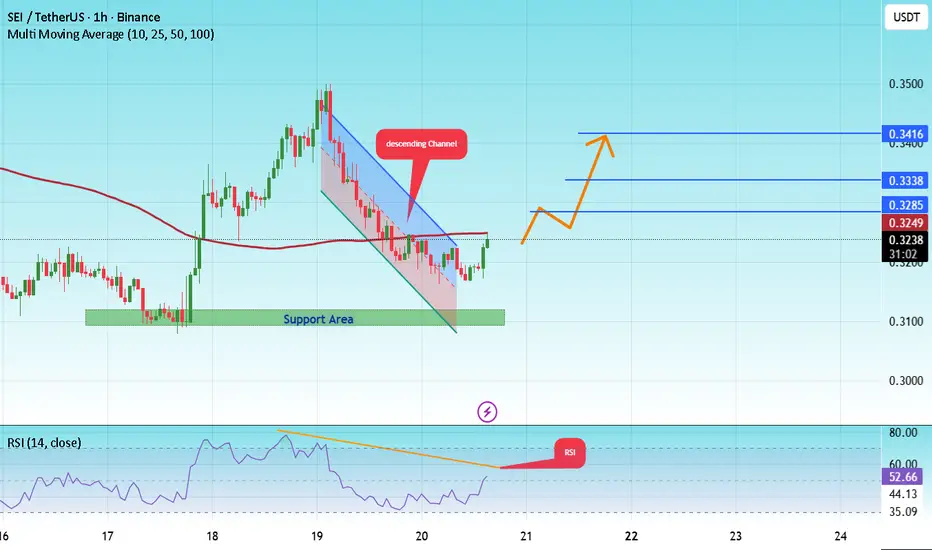
#SEI/USDT — Triangle Pattern Breakout Ahead?#SEI
The price is moving in a descending channel on the 1-hour frame and is expected to break and continue upward.
We have a trend to stabilize above the 100 moving average once again.
We have a downtrend on the RSI indicator that supports the upward move with a breakout.
We have a major support area in green that pushed the price higher at 0.3100.
Entry price: 0.3243
First target: 0.3285
Second target: 0.3338
Third target: 0.3416
To manage risk, don't forget stop loss and capital management.
When you reach the first target, save some profits and then change the stop order to an entry order.
For inquiries, please comment.
Thank you.
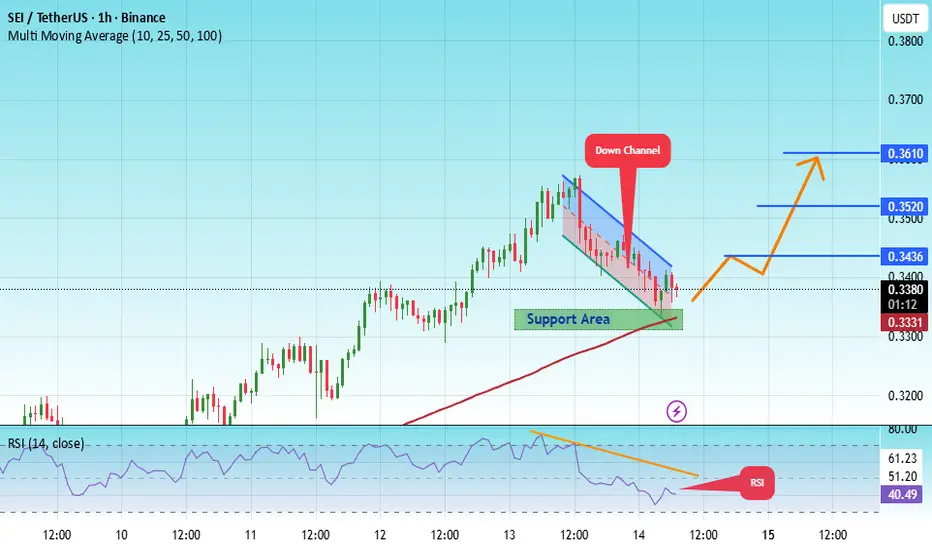
#SEI/USDT Testing Key Support – Breakout or Breakdown ?#SEI
The price is moving within a descending channel on the 1-hour frame, adhering well to it, and is heading for a strong breakout and retest.
We have a bearish trend on the RSI indicator that is about to be broken and retested, which supports the upward breakout.
There is a major support area in green at 0.3325, which represents a strong support point.
For inquiries, please leave a comment.
We are in a consolidation trend above the 100 Moving Average.
Entry price: 0.3380
First target: 0.3436
Second target: 0.3520
Third target: 0.3610
Don't forget a simple matter: capital management.
When you reach the first target, save some money and then change your stop-loss order to an entry order.
For inquiries, please leave a comment.
Thank you.
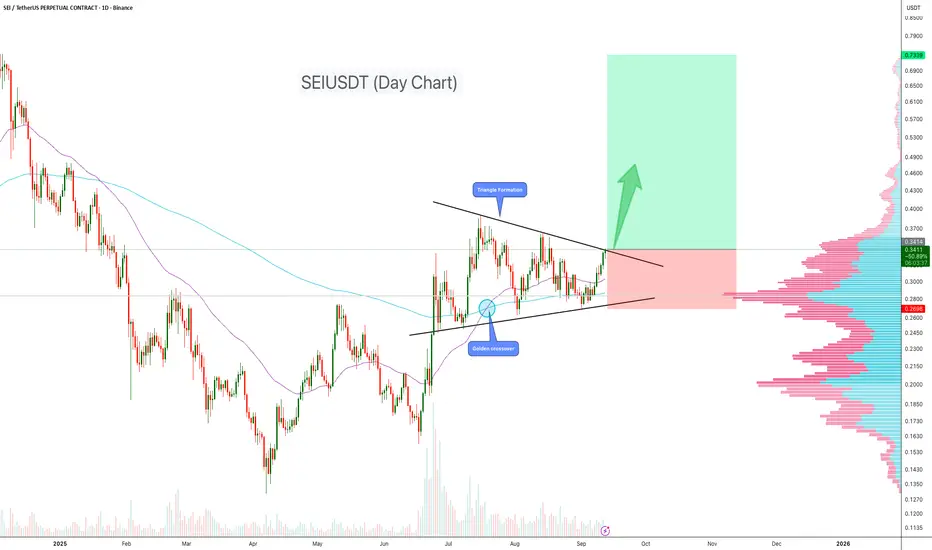
SEIUSDT Approaching Triangle BreakoutSEI has been consolidating within a symmetrical triangle on the daily chart. After weeks of compression, price is now testing the upper resistance trendline. A breakout could trigger strong upside momentum.
Key Points
- Triangle Pattern: Price has formed higher lows against flat resistance, signaling pressure building for a breakout.
- Golden Crossover: The 50 EMA recently crossed above the 200 EMA, strengthening the bullish outlook.
-Volume Profile: Key accumulation zone around $0.28 acting as strong support.
- Upside Potential: A confirmed breakout above $0.345 could send SEI toward $0.50–$0.65.
Trading Plan
Entry Zone: On breakout confirmation above $3.45
Target (TP): $0.50 – $0.650 initially, higher if momentum continues.
Stop-Loss (SL): Below $0.27 support.
Cheers
Hexa

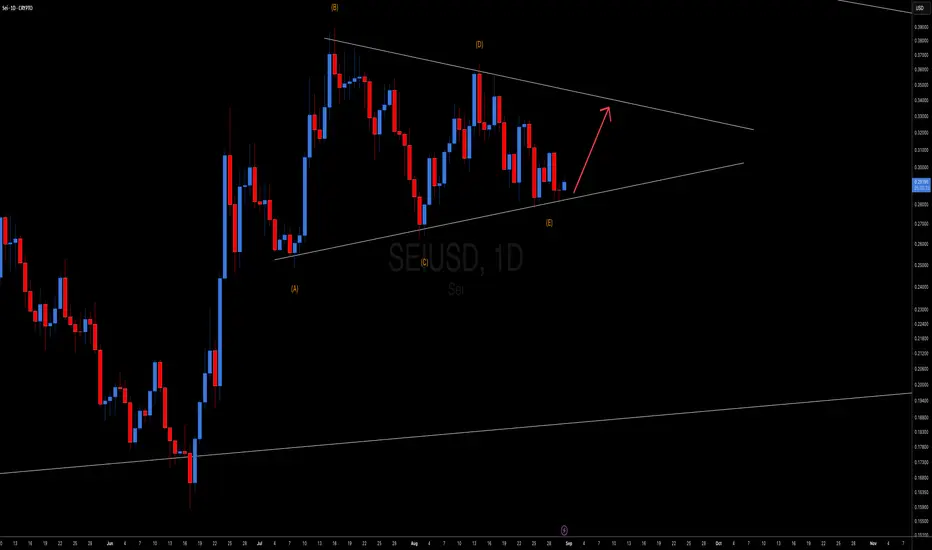
Bullish Move Up to complete Elliot Wave Triangle CorrectionBullish Move Up to complete Elliot Wave Triangle Correction
#SEI/USDT continues to grow !#SEI
The price is moving within an ascending channel on the 1-hour frame, adhering well to it, and is on its way to breaking strongly upwards and retesting it.
We have support from the lower boundary of the ascending channel, at 0.3080.
We have a downtrend on the RSI indicator that is about to break and retest, supporting the upside.
There is a major support area in green at 0.3100, which represents a strong basis for the upside.
Don't forget a simple thing: ease and capital.
When you reach the first target, save some money and then change your stop-loss order to an entry order.
For inquiries, please leave a comment.
We have a trend to hold above the 100 Moving Average.
Entry price: 0.3137.
First target: 0.3205.
Second target: 0.3294.
Third target: 0.3484.
Don't forget a simple thing: ease and capital.
When you reach the first target, save some money and then change your stop-loss order to an entry order.
For inquiries, please leave a comment.
Thank you.
