Gold Testing a Key EMA, the Pullback Remains TechnicalOn the OANDA:XAUUSD H1 chart, gold is entering a short-term corrective phase following the previous strong rally. The key point to emphasize is that the bullish structure remains intact, and current price action is mainly about how the market reacts around the major EMA levels.
From a technical perspective, price is hovering around the EMA 89, corresponding to the 4,435–4,440 zone. Meanwhile, the EMA 34 sits higher near 4,455 and has temporarily turned into a short-term dynamic resistance. Price failing to hold the faster EMA and pulling back toward the slower one is a familiar scenario within a healthy uptrend, where larger players closely observe price reactions to assess whether the trend continues to be defended.
The constructive sign so far is that gold has not printed a clear H1 close below the EMA 89 . The corrective candles remain relatively small and show lower wicks, suggesting that selling pressure is still limited. Although volume has ticked up slightly during some of the pullback legs, there is no evidence of aggressive distribution or heavy unloading.
Overall, this decline is better interpreted as a pullback toward a balance zone after price had extended significantly away from the EMAs during the prior advance. Given gold’s volatility characteristics, such corrections often serve to relieve pressure and rebuild a base before the market decides on its next directional move.
SELL

XAU/USD – Corrective pressure returns as the market awaits NFPAfter a strong rally earlier this week, gold is showing clear signs of cooling during the Asian session. A rebound in the U.S. dollar has created noticeable headwinds, while market sentiment has turned cautious ahead of the U.S. Non-Farm Payrolls (NFP) report —a key catalyst that could shape short-term expectations for Fed interest rate policy .
From a technical perspective , on the H4 timeframe, price failed to sustain bullish momentum as it approached the 4,500 resistance zone. Subsequent rebounds have been largely technical in nature and quickly faded, highlighting a lack of conviction from buyers. A move below the short-term balance area opens the door for a corrective pullback toward 4,400 (TP1), with a deeper extension toward 4,330 (TP2)—a confluence of support and the medium-term ascending trendline. Only a decisive breakout above 4,500 would meaningfully ease the current downside pressure.
In summary , with USD strength persisting and markets staying on the sidelines ahead of NFP, the short-term corrective scenario remains favored. The ongoing pullback can be seen as a necessary reset, allowing the market to rebalance before gold establishes a clearer directional bias in the sessions ahead.

Market Slows Down: GBPUSD Enters a Balance ZoneThe GBPUSD market is entering a phase of slowing momentum after its previous bullish move. As key economic news from both the US and the UK unfolds this week, capital flows have turned more cautious, causing price to lose its clear bullish drive .
From a fundamental perspective, the US dollar remains supported by expectations around upcoming US economic data, especially labor-market indicators. Meanwhile, the GBP lacks strong supportive catalysts, leaving the pair stuck in a tug-of-war, with downside pressure becoming increasingly visible.
On the chart, GBPUSD is moving sideways within a tight rang e and has been repeatedly rejected near the 1.3470 resistance zone. Price structure suggests that buying momentum is gradually weakening , with recent rebounds appearing more technical than impulsive. The 1.3380 area below is acting as short-term support and remains a likely downside target if price fails to break above resistance.
At this stage, GBPUSD aligns best with a sideways market biased to the downside . The focus should be on monitoring price reactions near resistance for potential short-term sell opportunities, rather than anticipating a fresh bullish trend.
In a market that is waiting for news and lacking strong momentum, patience and discipline remain a trader’s greatest edge.
Wishing you successful and disciplined trading.

GOLD TODAY Slowing Down to Move FurtherHello, I’m Camila.
Looking closely at the current H8 chart, I see gold entering a very typical phase after a strong rally. The previous sequence of bullish candles pushed price close to the upper resistance zone, but at this point the market has started to slow down and move sideways. This does not surprise me. When price advances too quickly relative to the underlying support, the market usually needs a pause to reassess the strength of buyers.
From a structural standpoint, the uptrend remains intact. Price is still trading above the key moving averages, and the series of higher lows has not been broken. This indicates that buying pressure has not left the market, but is simply decelerating. In gold, this phase often represents a period of compression before the next expansion.
From a fundamental perspective, the recent rally has not been random. Based on Forex Factory and major mainstream news sources, the market continues to react to ongoing geopolitical and global economic risks. Geopolitical tensions have not eased, while the Federal Reserve maintains a data dependent stance without signaling any new tightening. These factors continue to provide a supportive backdrop for gold, while also making it difficult for price to move higher in a straight line without short term corrections.
The price zone I am watching most closely at the moment lies between 4,360 and 4,330. In strong momentum driven uptrends like this, the market often repeats a familiar pattern: a sharp push higher that creates a breakout narrative, followed by a pullback to test the base and support, and only then does the market decide whether it has enough strength to continue higher. If gold corrects into this zone and shows a clear buying reaction, the bullish structure will remain clean and healthy.
On the upside, once the consolidation process is complete, I expect price to rotate back toward the upper resistance area around 4,500 to 4,550. A decisive breakout above this zone would open the door for a higher price range to be established in the next phase.
For me, gold today is not weakening. It is simply slowing down to prepare for its next move. I wish you successful trading and the patience to stay focused while the market is “catching its breath.”

Why Comparison Feels Productive — And Quietly Destroys YouHello, I’m Camila.
If I’m honest, comparison once felt like a necessary part of growth. It made me feel alert, ambitious, and aware of where I stood. Looking at people ahead of me felt like pressure in the right direction. What I didn’t realize then was that comparison wasn’t pushing me forward — it was slowly pulling my attention away from my own work.
Comparison keeps the mind busy. I would analyze other people’s progress, their speed, their outcomes. It felt productive, almost responsible. But nothing was actually being built. I was thinking about progress instead of creating it, and my brain rewarded me for observation rather than execution.
Over time, comparison changed how I made decisions. Instead of focusing on what I needed to improve today, I started measuring myself against someone else’s timeline. That shift led to rushed moves, unnecessary doubt, and a growing impatience with my own pace. Not because I was doing poorly — but because I was constantly looking elsewhere.
The real cost wasn’t a loss of confidence. It was a loss of trust in my process. Once that trust faded, hesitation took over. And hesitation, more than failure, is what quietly slows everything down.
If there’s one thing I’ve learned, it’s this: real progress is quiet. It doesn’t demand comparison to feel valid. When I focus on my own work and my own pace, growth takes care of itself — without the noise.
Traders, If you liked this educational post, give it a boost and drop a comment.

Gold Trapped Between Supply & Demand Price is approaching a strong supply zone around 4,500–4,520, where selling pressure has previously entered the market aggressively. The recent upside move shows signs of momentum loss, suggesting this rally may be corrective rather than impulsive.
A clear rejection from the supply zone would favor a pullback toward the 4,450–4,440 area, with further downside continuation likely into the 4,420 demand zone, where buyers previously stepped in.
If the 4,420 demand fails to hold, bearish continuation could extend toward 4,380–4,360. Only a strong breakout and close above the supply zone would invalidate the bearish pullback scenario and shift the bias back to bullish expansion.

Why You Should NOT Go All-In When Trading GOLDGold is one of the most attractive markets, but it is also where many traders pay the highest price because of a single decision: going all-in. Not because their analysis is wrong, but because they underestimate gold’s volatility.
1. Gold Has Strong Trends, But It Rarely Moves in a Straight Line
Gold can trend beautifully, but along the way there are always:
Deep pullbacks
Sudden news-driven spikes
Liquidity sweeps before the next continuation
When you go all-in, there is no room to absorb volatility. A single short liquidity sweep is enough to knock you out of the trade, even if the final direction is exactly what you anticipated.
2. All-In Turns Small Risk Into “Fatal” Risk
A normal losing trade is simply a trading cost.
But a losing all-in trade can cost you the ability to trade at all.
Trading is not about winning or losing a single position.
It is a game of survival.
3. All-In Damages Your Psychology More Than You Think
When all your margin is tied to one trade:
You fear the stop loss more than you respect market structure
You move your SL emotionally
You hope instead of acting correctly
And in the gold market, hope never pays traders.
4. Gold Is a Liquidity Market, Not an Emotional One
Gold frequently sweeps levels that everyone can clearly see on the chart.
All-in traders who place tight, “perfect-looking” stop losses unintentionally become ideal liquidity for the market.
🎯 Conclusion
All-in is not confidence — it is a gamble.
To trade gold sustainably, you need to:
Split your position size
Keep margin flexibility
Prioritize survival before profits

Gold Respects EMA 50 — Short-Term Bullish Continuation in FocusGold (XAUUSD) on the 30-minute timeframe is showing early signs of bullish continuation after completing a healthy pullback within a broader recovery structure. Following the prior impulsive leg higher, price corrected in a controlled manner and has now reacted cleanly from the EMA 50, confirming it as dynamic support.
The recent higher low formed along the ascending trendline indicates that buyers are still in control of the short-term structure. This pullback appears corrective rather than impulsive, suggesting the market is reloading for the next expansion phase instead of reversing.
Price is currently trading back above the EMA 50 and holding above the 4,458–4,460 intraday support area, which acts as a key pivot zone. As long as this level holds, bullish continuation remains the preferred scenario.
On the upside, the next liquidity objectives are clearly defined. The 4,495–4,500 zone marks the first resistance and reaction area, followed by the higher-timeframe target near 4,545–4,550, where previous highs and resting liquidity sit.
Trading Plan:
Bullish scenario: Holding above the EMA 50 and the 4,458 support opens the door for continuation toward 4,495, with extension toward 4,545–4,550 if momentum accelerates.
Bearish scenario: A loss of the EMA 50 followed by acceptance below 4,440 would invalidate the short-term bullish setup and expose a deeper pullback toward 4,420–4,400.
Overall, Gold is behaving technically clean on M30. As long as price respects dynamic support, the bias remains buy-the-dip, with confirmation favored over anticipation.

Gold at a Liquidity Crossroads — Expansion or Breakdown IncomingGold (XAUUSD) on H1 is currently trading inside a well defined liquidity price range, following a strong bullish expansion earlier in the week. That impulsive rally confirmed buyer dominance, but recent price action shows momentum has slowed, with the market now entering a distribution and decision phase.
Price is consolidating around the mid range near 4,460, closely aligned with the short-term moving average. This area acts as equilibrium not an ideal zone for aggressive entries as liquidity is building on both sides of the range.
The lower boundary of the structure sits around 4,408, marking a critical support and liquidity sweep zone. A clean break below this level would signal a range failure and open the door for a deeper bearish expansion toward 4,350.
On the upside, the upper boundary and key target remain near 4,545–4,550, where previous highs and resting liquidity are located. Acceptance above this area would confirm bullish continuation and trend resumption.
Bullish scenario: As long as price holds above the 4,408 support, buyers may attempt a push higher. A clean break and acceptance above 4,500, followed by continuation, would open upside targets toward 4,545–4,550.
Bearish scenario: A confirmed breakdown below 4,408, with follow-through and failed pullback, would validate a bearish expansion toward 4,350, signaling that liquidity below the range is being targeted.
For now, Gold is compressing inside a liquidity box. Patience is key the highest-probability trades will come after the range resolves, not while price remains trapped in the middle.

Repeated Rejections at Resistance — Is Gold Deeper Drop?Gold is trading inside a broader corrective range after a prior bullish impulse, with price repeatedly failing to break and hold above a well-defined higher-timeframe resistance zone. Multiple rejections from this area clearly show that upside momentum is being absorbed, not expanded.
While the larger structure has not fully flipped bearish yet, the current price action reflects distribution near the highs, not accumulation. Buyers are struggling to generate follow-through, and each push into resistance is met with increasing selling pressure.
The resistance zone around the 4,48x–4,50x area has been tested several times, with clear rejection wicks and weak closes a classic sign of supply dominance. At the same time, the EMA 200 is flattening below price, indicating a loss of bullish momentum rather than trend acceleration.
Volume behavior further supports this view: recent upside attempts are occurring on declining volume, suggesting the move higher lacks participation and strength. This divergence often precedes either a deeper pullback or a full corrective leg.
Resistance: 4,480 – 4,510 (major supply / rejection zone)
Support:
4,420 – 4,430 (intermediate reaction level)
4,350 (major downside support / correction target)
EMA / Dynamic Level: EMA 200 around 4,425 (loss of momentum / balance level)
➡️ Primary Scenario (Bearish Continuation):
Failure to break and accept above the resistance zone leads to another rejection. A move back below the 4,420–4,430 level would confirm distribution and open the path toward the 4,350 support zone, where a broader corrective leg is likely to unfold.
⚠️ Risk Scenario (Bullish Extension):
If price manages a clean breakout and acceptance above the 4,510 resistance with expanding volume, the distribution thesis would be invalidated. In that case, gold could transition into renewed bullish continuation rather than correction.

GBP/NZD BEST PLACE TO SELL FROM|SHORT
Hello, Friends!
Bearish trend on GBP/NZD, defined by the red colour of the last week candle combined with the fact the pair is overbought based on the BB upper band proximity, makes me expect a bearish rebound from the resistance line above and a retest of the local target below at 2.327.
Disclosure: I am part of Trade Nation's Influencer program and receive a monthly fee for using their TradingView charts in my analysis.
✅LIKE AND COMMENT MY IDEAS✅

Gold Is Coiling in a Descending Triangle — Breakdown Risk Market Outlook (XAUUSD – H1)
Price is compressing inside a well-defined descending triangle, with lower highs pressing against a flat support around 4,420–4,430, signaling increasing sell-side pressure. Momentum remains capped below the descending trendline and the EMA, keeping the short-term bias bearish.
A minor bounce toward 4,450–4,460 is likely to act as a corrective retest of triangle resistance rather than a reversal.
A decisive break and close below 4,420 would confirm the pattern breakdown, exposing downside liquidity toward 4,380–4,350. Only a clean breakout above the descending trendline would invalidate the bearish setup and shift the bias back to bullish continuation.

Gold Compresses Under Descending Resistance ...........Gold on the M45 timeframe remains in a broader bullish context, but recent price action shows the market transitioning into a clear compression phase beneath a descending trendline. After the strong impulsive advance from the lower support zone, momentum has slowed, and price is now rotating sideways while respecting both descending resistance above and a well-defined support base below.
Current structure shows repeated reactions around the 4,460–4,470 region, where descending trendline resistance continues to cap upside attempts. Sellers have defended this area consistently, preventing immediate continuation and forcing price into a tightening range. At the same time, buyers remain active above the 4,400–4,410 support zone, indicating that downside pressure is being absorbed rather than expanded.
As long as price holds above the support zone, the ongoing consolidation appears corrective rather than bearish. This range-bound behavior suggests accumulation, with the market building liquidity through multiple rotations before committing to a directional move. A brief dip toward support followed by higher lows would further reinforce the bullish case by confirming buyer control at discounted prices.
From a bullish continuation perspective, a clean break and sustained acceptance above the descending trendline would mark a structural shift back into expansion. In that scenario, Gold would likely target the 4,500 region initially, with further upside potential toward the 4,520–4,540 zone as momentum accelerates and trapped sellers are forced to exit.
Conversely, failure to hold the 4,400 support would invalidate the accumulation thesis and expose the market to a deeper corrective move. Until such a breakdown occurs, the current price action favors patience, with Gold coiling between support and descending resistance as it prepares for its next decisive move.

GBPJPY Will Go Higher! Buy!
Please, check our technical outlook for GBPJPY.
Time Frame: 4h
Current Trend: Bullish
Sentiment: Oversold (based on 7-period RSI)
Forecast: Bullish
The market is approaching a key horizontal level 210.599.
Considering the today's price action, probabilities will be high to see a movement to 211.071.
P.S
Please, note that an oversold/overbought condition can last for a long time, and therefore being oversold/overbought doesn't mean a price rally will come soon, or at all.
Like and subscribe and comment my ideas if you enjoy them!

Accumulation for a Push Higher or Breakdown Into Deeper CorrectHello traders! Here’s a clear technical breakdown of XAUUSD (1H) based on the current chart structure.
Gold previously printed a strong bullish impulse, establishing a sequence of higher highs and higher lows. After reaching the recent peak, price transitioned into a sideways consolidation, signaling a pause in momentum rather than an immediate trend reversal.
This consolidation has formed between well-defined boundaries, reflecting market equilibrium as buyers and sellers reassess value after expansion. Price action within this range remains controlled, with no impulsive follow-through in either direction so far.
🟦 SUPPLY & DEMAND – KEY ZONES
Supply Zone:
The upper range near 4,500–4,520 acts as a clear supply zone, where previous buying momentum stalled and sellers entered aggressively. This area represents overhead resistance and the ceiling of the current range.
Demand Zone:
The 4,430–4,440 region is a key demand zone, aligned with prior breakout structure and repeated reactions. Buyers have consistently defended this level, preventing deeper downside.
Breakdown Risk Area:
A clean acceptance below the demand zone would expose 4,330, which aligns with the next liquidity pool and the projected downside target if structure fails.
🎯 CURRENT MARKET POSITION
Currently, Gold is trading directly on top of its demand zone, placing price at a high-impact decision point. This is where the market will determine whether the consolidation resolves as accumulation or transitions into distribution.
The lack of strong bearish momentum into demand suggests sellers are cautious, but confirmation is still required.
🧠 MY SCENARIO
As long as Gold holds above the 4,430–4,440 demand zone, the broader bullish structure remains intact, and current price action can be viewed as range consolidation after expansion. A bullish reaction from demand could lead to a push back toward the 4,500 supply zone, and acceptance above that area would open the door for continuation higher.
However, a decisive hourly close below the demand zone would invalidate the accumulation thesis. In that case, price could accelerate lower toward 4,330, confirming a deeper corrective phase before buyers potentially re-enter.
For now, price is balancing, not breaking.
⚠️ RISK NOTE
This is a critical inflection zone. Let price confirm direction from demand or breakdown, avoid anticipation, and always manage your risk.

Gold Slips Under Descending Pressure — Correction Unfolding Gold on the M30 timeframe is showing clear signs of short-term structural weakness after failing to sustain the previous bullish impulse. Following the strong rally into the recent highs, price has transitioned into a descending structure, characterized by lower highs forming beneath a clearly defined descending trendline. This shift reflects a loss of upside momentum and signals that the market has entered a corrective phase.
Current price action is consolidating around the 4,430 area, a level that previously acted as a key intraday support. Repeated reactions around this zone suggest indecision, but the inability to reclaim and hold above the descending trendline keeps downside pressure dominant. Each rebound attempt has been met with selling interest, indicating that buyers are struggling to regain control in the short term.
As long as price remains capped below the descending trendline, the corrective scenario remains favored. A brief bounce from current levels cannot be ruled out; however, such a move would likely function as a liquidity-driven pullback rather than a genuine reversal. In that case, renewed selling pressure could drive price toward the 4,399 support zone, which represents the first meaningful downside target and a prior reaction area.
If bearish momentum persists and this level fails to hold, Gold could extend lower toward the 4,380 region, where a deeper liquidity sweep is likely to occur. This zone aligns with previous consolidation and may attract stronger buyer interest, potentially marking the point where the correction begins to stabilize.
Despite the current bearish intraday structure, the broader higher-timeframe bias remains constructive unless price decisively breaks below the lower support range. Until that happens, the ongoing decline should be viewed as a corrective pullback within a larger trend, rather than confirmation of a full trend reversal.

Gap Filled, Momentum Flips — Buyers Take ControlOANDA:XAUUSD has rebounded strongly from the gap support zone, reclaiming the short-term EMA cluster and shifting momentum back to the upside. The impulsive recovery suggests buyers are stepping in decisively after the corrective sell-off, turning the recent drop into a higher-low formation rather than trend failure.
As long as price holds above the 4,400 support zone, the structure favors continuation toward higher resistance levels.
Resistance: 4,495 → 4,525 → 4,550
Support: 4,400 – 4,410
Key demand (gap): 4,330 – 4,350
➡️ Primary: hold above 4,400 → pullback buys → continuation toward 4,495, then 4,525–4,550.
⚠️ Risk: loss of 4,400 → revisit the gap support at 4,330–4,350 before reassessment.

Gold Is at a Decision Point — Break Higher or Deeper Liquidity Price is currently reacting at the key demand zone around 4,430–4,440, where buyers are attempting to defend the EMA support after a rejection from the 4,470–4,480 resistance zone.
A hold and bullish reaction above 4,430 would signal absorption of selling pressure, opening the path for a recovery toward 4,460–4,470, with a potential extension back into the upper resistance zone.
However, a clean break and close below 4,430 would invalidate the short-term bullish attempt and expose the downside toward 4,400, where liquidity and a stronger demand area are likely to be tested before any meaningful continuation.

Gold Is Inside a Bearish Structure — Breakout or BrekdownPrice is respecting a descending trendline and trading below the EMA50, confirming a short-term bearish structure as momentum continues to weaken. The market is currently reacting near the 4,420–4,430 demand zone, where buyers are attempting to slow the sell-off.
A bullish reaction from this zone could trigger a corrective bounce toward 4,445–4,460, aligning with the trendline resistance and prior supply. However, this move is expected to remain corrective unless price can reclaim the EMA and break structure.
A clean break and close below 4,420 would confirm bearish continuation, exposing downside liquidity toward 4,400–4,395. Failure of the demand zone would likely accelerate selling pressure into the lower range before any meaningful reversal attempt.

GOLD (XAUUSD) — Sell From Resistance | Targets 4,412 → 4,330Gold prices are currently holding firm in strong demand after a positive correction within a bullish market structure. Prices have broken through resistance levels several times, but the next resistance is the all-time high (ATH). Sellers will likely prevent the price from breaking through and reaching a new peak just before news from the White House.
A sharp drop is expected when the price reaches the predicted resistance level of 4,491.
If the price fails to break through and holds below this resistance, a liquidation is likely to occur, and the price will quickly fall to 4,400.
Despite being in an uptrend, a sharp correction is expected to consolidate for a stronger subsequent rally. It will also fill the gap left by the previous day.
A breakdown above the resistance level would invalidate this setup.

Gold Breaks Out on Venezuela Crisis and Dovish Fed SignalsGold surged above $4,400 after a U.S. operation captured Venezuela’s president, sparking geopolitical tensions and safe-haven demand.
- OANDA:XAUUSD prices surged above the $4,400 region during Asian trading on Monday. This move was because of a US operation that resulted in the capture of Venezuelan President Nicolas Maduro. This unexpected strike created new geopolitical tensions and increased demand for safe-haven assets.
- The market is afraid of further instability in Latin America. U.S. officials hinted at using the leverage of oil for political change. As a result, traders rushed into gold, expecting increased uncertainty and long lasting risk premiums. On the other hand, the Federal Reserve’s dovish stance is supportive of gold. However, good U.S. jobs data could boost the dollar and put a temporary ceiling on gold prices.
Gold Technical Analysis
- The daily chart for spot gold indicates that the price is rebounding from the strong support at an important junction and is looking for higher levels. This important junction is formed by the strong support of the ascending triangle and the ascending broadening wedge pattern. A break above $4,550 will signal further upside to the $5,000 level. However, a break below $4,260 will signal a downside move to lower levels.
The 4-hour chart for spot gold shows the price consolidating during thin liquidity and found support at the $4,380 level. The price rebounds higher during a bullish pattern. As long as gold maintains the $4,260 level, the next move in the gold market will likely be higher.

GBPCAD Will Go Down! Sell!
Here is our detailed technical review for GBPCAD.
Time Frame: 1h
Current Trend: Bearish
Sentiment: Overbought (based on 7-period RSI)
Forecast: Bearish
The market is approaching a significant resistance area 1.865.
Due to the fact that we see a positive bearish reaction from the underlined area, I strongly believe that sellers will manage to push the price all the way down to 1.860 level.
P.S
The term oversold refers to a condition where an asset has traded lower in price and has the potential for a price bounce.
Overbought refers to market scenarios where the instrument is traded considerably higher than its fair value. Overvaluation is caused by market sentiments when there is positive news.
Like and subscribe and comment my ideas if you enjoy them!

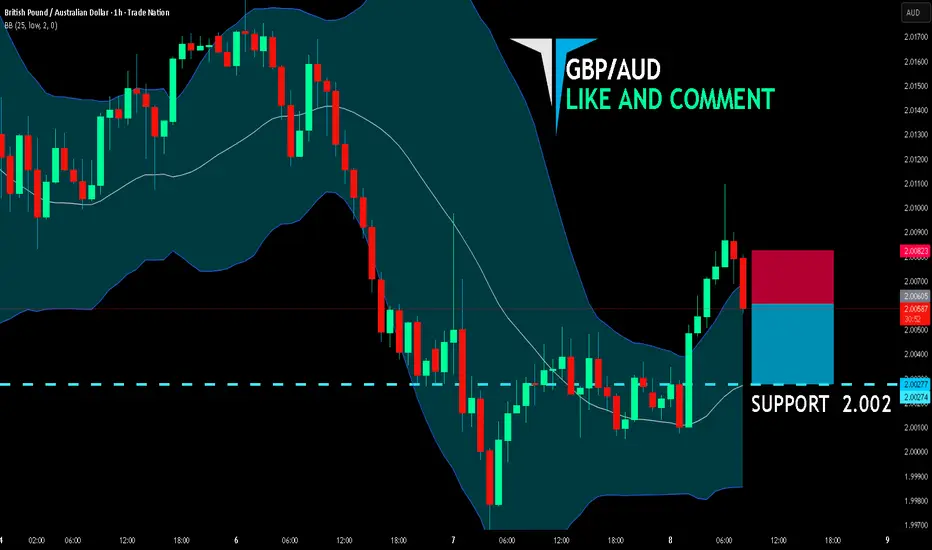
GBP/AUD BEARS ARE STRONG HERE|SHORT
GBP/AUD SIGNAL
Trade Direction: short
Entry Level: 2.006
Target Level: 2.002
Stop Loss: 2.008
RISK PROFILE
Risk level: medium
Suggested risk: 1%
Timeframe: 1h
Disclosure: I am part of Trade Nation's Influencer program and receive a monthly fee for using their TradingView charts in my analysis.
✅LIKE AND COMMENT MY IDEAS✅