HUNER (1D) — Seller Bias After OB Cluster; Descending BA SlopesHUNER (1D) — Seller Bias After OB Cluster; Descending BA Slopes, 4.00 Support Under Test
Executive read (VPA, 55-bar window)
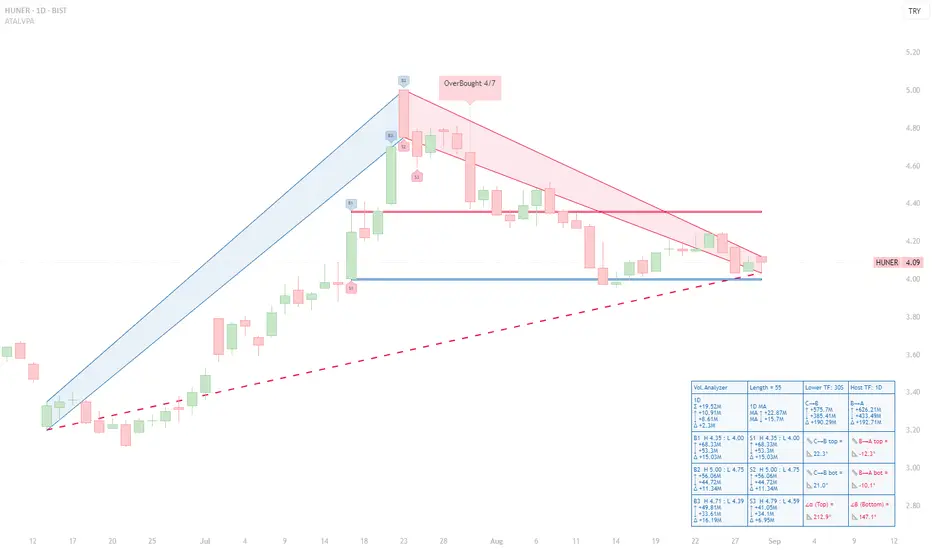
◉ OB/OS: An OverBought 4/7 tag printed at the apex; no confirmed OS on the right edge. That OB cluster preceded the entire red B→A leg and frames the current risk.
◉ Ranked volume peaks (Top-3):
- B1 (H 4.35/L 4.00) ↑ 68.33M, ↓ 53.3M, Δ +15.03M.
- B2 (H 5.00/L 4.75) ↑ 56.06M, ↓ 44.72M, Δ +11.34M.
- B3 (H 4.71/L 4.39) ↑ 49.81M, ↓ 33.61M, Δ +16.19M.
- S3 (H 4.79/L 4.59) ↑ 41.05M, ↓ 34.1M, Δ +6.95M.
Takeaway: Buying peaks were heavy, but subsequent price action failed to sustain higher highs; sellers have since controlled the B→A leg.
◉ Segment diagnostics:
- C→B advance: top/bottom slopes +22.3° / +21.0° → mature but constructive.
- B→A decline: top/bottom slopes –12.3° / –10.1° → persistent downside pressure.
- Orientation at B: α 212.9° (red) / β 147.1° (red) confirm the bearish state of the current swing geometry.
◉ Levels & structure:
- Support: the S1 low ≈ 4.00 is the active horizontal shelf repeatedly defended.
- Resistance: 4.35 (B1/S1 pivot), 4.71–4.79 (B3/S3 band), then 5.00 (B2). The descending B→A trendline caps bounces before these levels.
Actionable interpretation (educational):
Bias stays bearish-to-neutral while price trades beneath the B→A upper line and below 4.35. A credible shift would require (i) a fresh B-ranked bar with positive Δ near the right edge, and (ii) a close back above the B→A top. Failure to reclaim 4.35 after bounces leaves 4.00 vulnerable; a daily close below 4.00 would validate extension into the S-zones. Conversely, an OS print near 4.00 coupled with flattening BA slopes would set up a tactical mean-reversion toward 4.35 → 4.71/4.79.
Sellertrap
NVDA Under Pressure: Sellers Dominate as Volume Spikes Fail NVDA Under Pressure: Sellers Dominate as Volume Spikes Fail to Sustain Price Gains
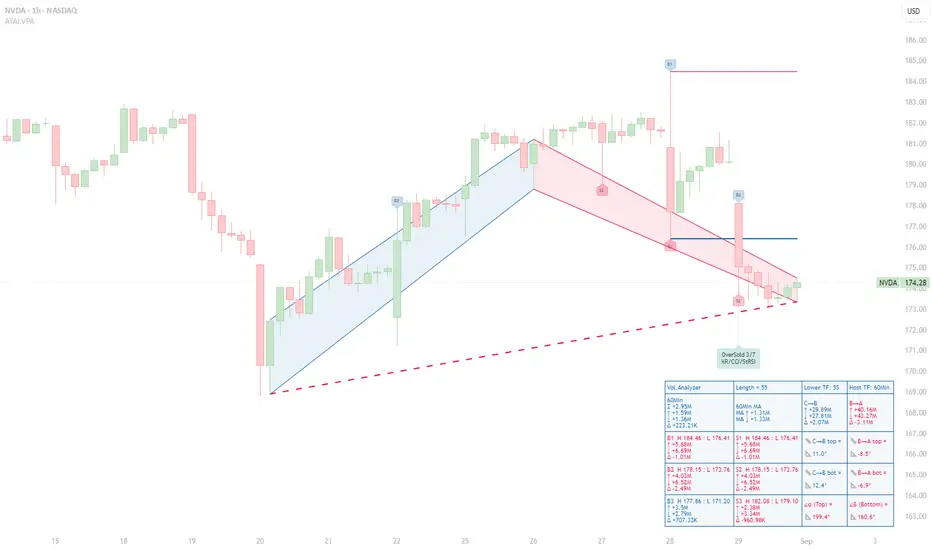
Context – This 60‑minute NVDA chart uses the ATAI Volume Pressure Analyzer (VPA) on a 55‑bar window. The indicator plots an A→B→C structure: the blue C→B segment tracks the preceding advance and the red B→A segment the subsequent pull‑back. Up‑volume and down‑volume are calculated on a lower time frame and then aggregated into host‑time‑frame bars to expose buying and selling pressure.
Volume ranking – Within this window the indicator labels the three largest buying and selling bars (B1–B3 and S1–S3) and reports their statistics in a HUD. The most prominent bar, B1, spans H 184.46 to L 176.41 and shows 5.68 M up‑volume versus 6.69 M down‑volume, producing a –1.01 M delta. B2 (H 178.15–L 173.76) is even more bearish, with 4.03 M up‑volume and 6.52 M down‑volume (delta –2.49 M). B3 (H 177.86–L 171.20) is the only buying bar with a positive delta: 3.50 M up‑volume, 2.79 M down‑volume and a +0.71 M surplus. On the sell side, S1 and S2 coincide with B1 and B2 and mirror their negative deltas. S3 (H 182.08–L 179.10) registers 2.38 M up‑volume against 3.34 M down‑volume for a –0.96 M delta. Collectively, the pattern shows that peaks in buying volume have not yielded higher closes; sellers control all but one of the ranked bars.
Segment behaviour – The C→B rally accumulated roughly 29.89 M up‑volume versus 27.81 M down‑volume, a modest +2.07 M delta. In contrast, the B→A decline logged 40.16 M up‑volume against 43.27 M down‑volume, giving a –3.11 M deficit. The slopes of the trend lines accentuate the story: the advance has gentle positive slopes (~+11° top, +12.4° bottom), whereas the pull‑back slopes downward (–8.5° and –6.9°). Sellers have pushed prices lower more decisively than buyers previously drove them higher.
Price structure and implications – Price currently trades around 174.28 USD. Resistance sits near 178.15 (B2/S2) and 184.46 (B1/S1). As long as price remains beneath these pivot highs and subsequent B‑ranked bars fail to show a positive delta, the selling bias persists. The red dashed guide, connecting recent lows, continues to slope downward, confirming the bearish tilt. Only a flattening or reversal of this guide—coupled with a new B‑ranked bar sporting a positive delta—would hint at a shift in momentum.
Risk management – This analysis is intended for educational purposes. It illustrates how separating up‑ and down‑volume on lower time frames can reveal hidden pressures in intraday charts. It is not a recommendation to buy or sell NVDA stock. Always consult your own trading plan and risk tolerance before acting.
Seller Strength Evident as Volume Peaks Fail to Propel Price HigAnalysis
Context – This 1D chart uses the ATAI Volume Pressure Analyzer to study the A→B→C structure over the last 11 trading sessions. Segment C→B captures the advance (blue), while B→A captures the subsequent decline (red). Each bar’s up‑ and down‑volume is measured on a lower timeframe to detect buying and selling pressure.
Volume ranking – Within this 11‑bar window, the indicator identifies the three largest buying (B1–B3) and selling (S1–S3) bars. Although the B1 bar shows the highest buying volume (~10.29 M units), its selling volume (~12.52 M) exceeds buying, resulting in a negative delta of ‑2.23 M. B2 is the only buyer bar with a positive delta (+1.87 M), while B3 again shows sellers in control (‑0.90 M). The seller bars S1–S3 all display net negative deltas, with S3 registering the heaviest selling (‑4.03 M). This pattern shows that peaks in buying volume are not producing higher closes and that sellers are consistently overwhelming buyers.
Segment behaviour – The C→B segment (the rally) totals approximately +28.9 M up‑volume versus +36.7 M down‑volume, a net deficit of about ‑7.74 M. The subsequent decline (B→A) is even more one‑sided: +26.9 M up‑volume versus +41.4 M down‑volume, yielding a ‑14.5 M delta. The slopes of the segment trend lines reinforce this narrative: the rise from C to B has a shallow positive slope (~ 5° on the upper line), whereas the decline from B to A has a steeper negative slope (‑12° on the upper line). Sellers are pushing the price lower more aggressively than buyers previously pushed it higher.
Price structure – Price currently trades near TRY 3.45,where resistance resides near the recent pivot highs around TRY 3.65 and TRY 3.73 (where B1 and S1 occur). As long as the price remains below these levels and buying peaks fail to translate into higher highs, the bearish bias remains. The red dashed line is not a fixed support; it dynamically connects the lows of the current C→A leg and updates with each new candle’s low. Its red colour confirms the bearish slope of this segment. As long as this guide remains red and slopes downward, the downtrend is intact. A meaningful sign of shifting momentum would be a flattening or reversal of this guide (e.g., changing colour) accompanied by a new B‑ranked bar that shows a positive delta.
Risk management – This analysis is provided for educational purposes and does not constitute investment advice. Always consider your own risk tolerance and trading plan before entering a position.

gbpjpy seller trap price engulfed previous swing low, creating a seller trap. looking for a strong retracement before continuing down


gbpnzd seller trap3 levels of drop, w formation, swing failure pattern second leg of w . looking for 50 pips


usdcad seller trapprice is obviously trapping sellers under a zone, large 4h candle wiks showing exhaustion . we are going to go long with a fat lot on this with a 10 pip stop. easy


ga seller trap under zone3 levels of drop after reset, w formation with sfp second leg (after break and retest of zone to induce sellers) we go long


First trend line break out seller trap projectiontap tap tap tap to trend line, everyone buying, we look for break of trend line which will kill buyers and induce sellers, we then look for reversal signs most likely around an order block to take price up against sellers. fuck ya
