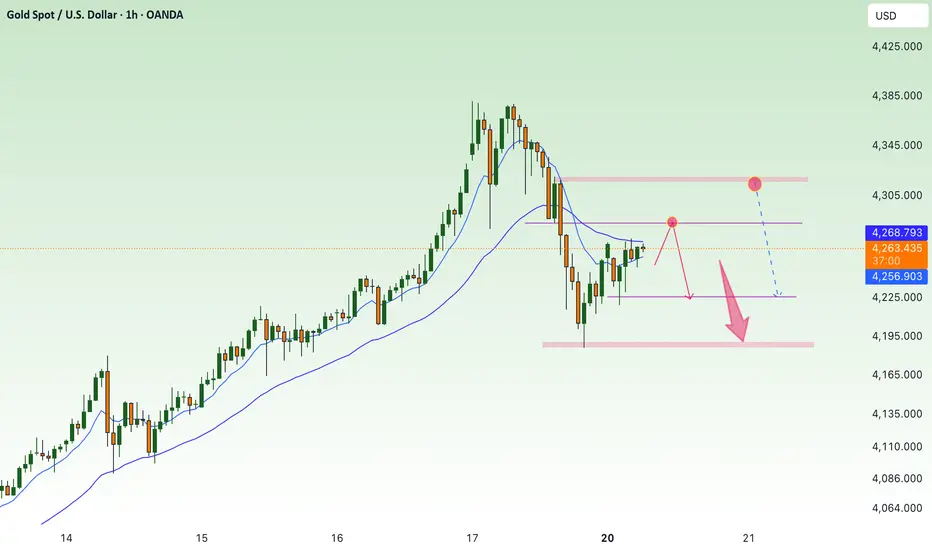
Daily Analysis Bias: Bearish continuation Key Level to Watch: 3After a corrective bounce, price remains capped below 4024 resistance.
A decisive daily close under 3976.03 would confirm momentum resuming to the downside, opening the door toward the 3930 support zone and possibly extending toward 3880 if sellers maintain pressure.
Technical Context
• Trend: Downtrend remains intact (lower highs and lower lows)
• Resistance zone: 4024 – 4040
• Support zones: 3976 → 3930
• Structure: Descending channel with recent failed breakout attempt
Trading Plan:
Watch for a retest of 3976 after a break to confirm as resistance before continuation down.
A daily close back above 4024 would invalidate the bearish setup short term.
Sellsetup

continue to accumulate - sideways price zone 4000⭐️GOLDEN INFORMATION:
Gold (XAU/USD) drops toward $3,965 in early Asian trading on Monday, extending its decline as improved US–China relations lift global risk appetite. Traders now await the US ISM Manufacturing PMI data for October, due later in the day.
Last week, Presidents Donald Trump and Xi Jinping agreed to ease trade tensions, with the US reducing tariffs from 57% to 47% in exchange for China suspending rare earth export curbs and boosting US soybean imports. The positive trade outlook weakens safe-haven demand, pressuring Gold prices.
⭐️Personal comments NOVA:
Not much economic news - gold prices continue sideways at the beginning of the week. Large frame correction
⭐️SET UP GOLD PRICE:
🔥SELL GOLD zone: 4059 - 4061 SL 4066
TP1: $4050
TP2: $4040
TP3: $4020
🔥BUY GOLD zone: 3919 - 3917 SL 3912
TP1: $3928
TP2: $3940
TP3: $3955
⭐️Technical analysis:
Based on technical indicators EMA 34, EMA89 and support resistance areas to set up a reasonable sell order.
⭐️NOTE:
Note: Nova wishes traders to manage their capital well
- take the number of lots that match your capital
- Takeprofit equal to 4-6% of capital account
- Stoplose equal to 2-3% of capital account

Gold price adjusted down below 4000 next week✍️ NOVA hello everyone, Let's comment on gold price next week from 11/03/2025 - 11/07/2025
⭐️GOLDEN INFORMATION:
Gold (XAU/USD) edges lower on Friday, slipping below the $4,000 mark as traders reassess the Federal Reserve’s (Fed) policy outlook after this week’s rate cut. The metal trades near $3,985, down about 1% on the day and heading for a second consecutive weekly loss.
A stronger US Dollar and steady Treasury yields weigh on Gold, as markets trim bets on another Fed rate cut this year. Chair Jerome Powell signaled a cautious stance, noting that a December cut is “not a foregone conclusion” and policy will depend on incoming data.
⭐️Personal comments NOVA:
Gold price lacks bullish momentum, accumulates and corrects down below 4000
🔥 Technically:
Based on the resistance and support areas of the gold price according to the H4 frame, NOVA identifies the important key areas as follows:
Resistance: $4154, $4235
Support: $3953, $3884
🔥 NOTE:
Note: Nova wishes traders to manage their capital well
- take the number of lots that match your capital
- Takeprofit equal to 4-6% of capital account
- Stoplose equal to 2-3% of capital account
- The winner is the one who sticks with the market the longest

EUR/USD Shorts towards 1.1440My analysis for this week is for EU to continue moving lower, in line with the current bearish trend. I’m watching for a potential pullback into the 5hr supply zone that recently caused a break of structure to the downside.
Once price taps into this area, I’ll wait for signs of distribution and confirmation entries to take shorts targeting the 16hr demand zone around 1.1440.
Confluences:
- Strong bearish structure with consistent breaks to the downside
- Multiple new supply zones, including the refined 5hr one near current price
- Significant liquidity resting below that still needs to be taken
- DXY remains bullish, supporting this bearish idea
- A clean pro-trend setup with no major news interference expected
P.S. If price breaches the 5hr supply, it’ll likely be due to it not being in a premium area. In that case, I’ll wait for price to reach higher premium levels before looking for another short setup — all depending on how price approaches the zone.

Continue to accumulate along the 4058 trend line⭐️GOLDEN INFORMATION:
Gold (XAU/USD) faces renewed selling pressure after an early Asian uptick toward $4,046, pausing this week’s rebound from its lowest level since October 6. The US Dollar (USD) holds near a three-month high following the Federal Reserve’s hawkish stance, weighing on the non-yielding metal.
Additionally, optimism over easing US–China trade tensions dampens safe-haven demand. Still, lingering worries about the prolonged US government shutdown could limit USD strength and offer some support to gold prices.
⭐️Personal comments NOVA:
market accumulation time, sideways around 4000. ended october with volatility
⭐️SET UP GOLD PRICE:
🔥SELL GOLD zone: 4058 - 4060 SL 4065
TP1: $4050
TP2: $4040
TP3: $4020
🔥BUY GOLD zone: 3887 - 3885 SL 3880
TP1: $3900
TP2: $3910
TP3: $3925
⭐️Technical analysis:
Based on technical indicators EMA 34, EMA89 and support resistance areas to set up a reasonable sell order.
⭐️NOTE:
Note: Nova wishes traders to manage their capital well
- take the number of lots that match your capital
- Takeprofit equal to 4-6% of capital account
- Stoplose equal to 2-3% of capital account

Gold price trading below 4000⭐️GOLDEN INFORMATION:
Gold (XAU/USD) steadies near $3,950 per ounce in Asian trading on Thursday, snapping a four-day losing streak. Prices find support from ongoing central bank buying and renewed ETF inflows, which have tightened supply in both official and market channels. However, gains remain capped after Fed Chair Jerome Powell signaled that another rate cut in December is uncertain, pushing 10-year Treasury yields above 4% and raising the opportunity cost of holding non-yielding bullion. The Fed had earlier delivered a widely expected 25-basis-point rate cut.
⭐️Personal comments NOVA:
Gold price is moving sideways, accumulating below 4000. Gold's long-term correction downtrend
⭐️SET UP GOLD PRICE:
🔥SELL GOLD zone: 4030 - 4032 SL 4037
TP1: $4020
TP2: $4010
TP3: $4000
🔥BUY GOLD zone: 3886 - 3884 SL 3879
TP1: $3900
TP2: $3910
TP3: $3925
⭐️Technical analysis:
Based on technical indicators EMA 34, EMA89 and support resistance areas to set up a reasonable sell order.
⭐️NOTE:
Note: Nova wishes traders to manage their capital well
- take the number of lots that match your capital
- Takeprofit equal to 4-6% of capital account
- Stoplose equal to 2-3% of capital account

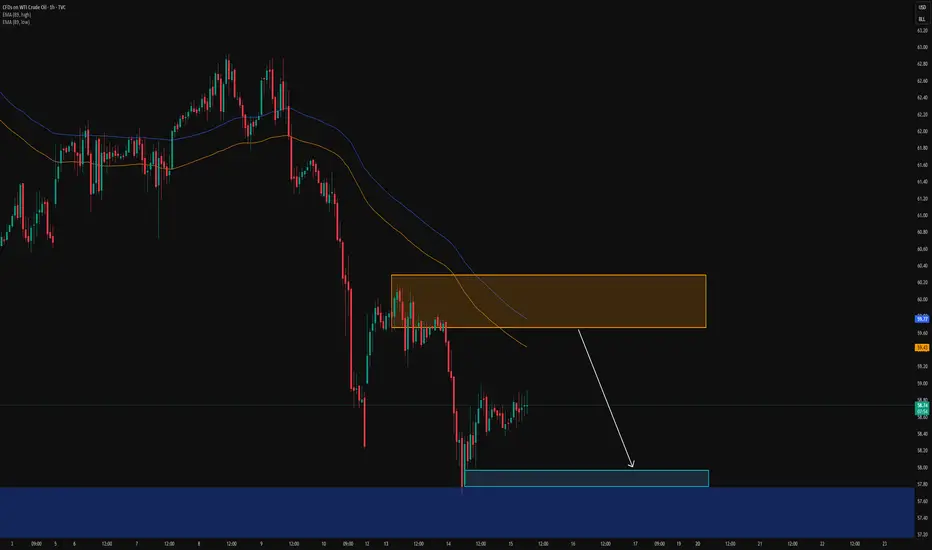
Capital.com: Crude Oil Sells US OIL Sell Setup – Bearish Structure
US Oil is showing signs of renewed bearish momentum after rejecting a key daily resistance zone. On the 1-hour timeframe, price has confirmed a lower high formation, followed by a decisive break below a key intraday support level—now acting as resistance. This shift in structure suggests potential continuation to the downside, with momentum favoring sellers as long as price remains below the reclaimed zone.
Technical Highlights:
Bearish structure confirmed on the 1H timeframe
Clean break and retest of structure
Momentum building for a potential push toward lower levels
Trade Setup:
Entry: 61.02
Stop Loss: 61.56
Target Levels:
Take Profit 1: 60.59
Take Profit 2: 56.34
This setup offers a favorable risk-to-reward ratio within a well-defined bearish structure. Wait for candle confirmation below resistance if not already in the trade, and always manage your risk according to your plan.
Drop your thoughts or questions below — and if you found this helpful, hit boost and follow for more structured US Oil trade ideas.
Stay sharp. Trade with precision. 🛢️📉

Gold downtrend, accumulation below 4000⭐️GOLDEN INFORMATION:
Gold (XAU/USD) picks up modestly in Tuesday’s Asian session, rebounding from a two-week low near $3,972. A softer US Dollar, pressured by expectations of two more Fed rate cuts this year, supports the non-yielding metal. Ongoing geopolitical tensions from the Russia-Ukraine conflict also add to its safe-haven appeal.
⭐️Personal comments NOVA:
There is still selling pressure, gold is definitely correcting below 4000, the market is waiting for interest rate results
⭐️SET UP GOLD PRICE:
🔥SELL GOLD zone: 4090 - 4092 SL 4097
TP1: $4080
TP2: $4070
TP3: $4050
🔥BUY GOLD zone: 3941 - 3943 SL 3936
TP1: $3960
TP2: $3980
TP3: $4000
⭐️Technical analysis:
Based on technical indicators EMA 34, EMA89 and support resistance areas to set up a reasonable SELL order.
⭐️NOTE:
Note: Nova wishes traders to manage their capital well
- take the number of lots that match your capital
- Takeprofit equal to 4-6% of capital account
- Stoplose equal to 2-3% of capital account

SHORT ON AUD/JPYAUD/JPY has made a pullback to a major supply area while also mitigating a FVG (fair value gap) in the same zone.
Jpyx index has major potential to rise. I expect AJ to fall and from this zone.
Looking to make 200-300 pips throughout the week.

Gold price is consolidating around 4100⭐️GOLDEN INFORMATION:
Gold (XAU/USD) slips below $4,150 in Friday’s Asian session, weighed down by a firmer US Dollar and cautious sentiment after recent sharp losses. The end of India’s Diwali festival may also curb physical demand. However, lingering US government shutdown risks, global trade tensions, and expectations of US rate cuts could lend support to the non-yielding metal.
⭐️Personal comments NOVA:
Gold's downward correction is still continuing, accumulating below 4200. Buying power is weakening and there is not much momentum to increase prices this week.
⭐️SET UP GOLD PRICE:
🔥SELL GOLD zone: 4217 - 4219 SL 4224
TP1: $4202
TP2: $4190
TP3: $4170
🔥BUY GOLD zone: 3954 - 3956 SL 3949
TP1: $3970
TP2: $3990
TP3: $4015
⭐️Technical analysis:
Based on technical indicators EMA 34, EMA89 and support resistance areas to set up a reasonable SELL order.
⭐️NOTE:
Note: Nova wishes traders to manage their capital well
- take the number of lots that match your capital
- Takeprofit equal to 4-6% of capital account
- Stoplose equal to 2-3% of capital account

Gold price tries to recover back to 4200⭐️GOLDEN INFORMATION:
Gold (XAU/USD) drops below $4,100 in Wednesday’s Asian session, extending its sharpest selloff in over a decade as traders lock in profits after a nine-week record-breaking rally. Easing US-China trade tensions ahead of the November 1 tariff deadline further dampen safe-haven demand.
⭐️Personal comments NOVA:
Gold price is accumulating, trying to recover back to 4163, 4200
⭐️SET UP GOLD PRICE:
🔥SELL GOLD zone: 4163 - 4165 SL 4170
TP1: $4150
TP2: $4135
TP3: $4120
🔥BUY GOLD zone: 4003 - 4001 SL 3996
TP1: $4020
TP2: $4035
TP3: $4050
⭐️Technical analysis:
Based on technical indicators EMA 34, EMA89 and support resistance areas to set up a reasonable SELL order.
⭐️NOTE:
Note: Nova wishes traders to manage their capital well
- take the number of lots that match your capital
- Takeprofit equal to 4-6% of capital account
- Stoplose equal to 2-3% of capital account

Your Gold is about to melt !Hey Traders!
Gold is showing similar pattern to its last bull market which lasted 10 years and followed by a bear market which lasted 3 years, well guess what ! We've just finished the 10 years for the current bull market and I think its the time to roach out xD
It might pump a little more but its definitely going down soon, after all any bull market doesn't last forever and 10 years is a lot of full market especially when we see a similar pattern in the chart History.
Stay safe and let me know what do you guys think about this ?

Gold prices begin to recover, big fluctuations⭐️GOLDEN INFORMATION:
Gold (XAU/USD) drops below $4,100 in Wednesday’s Asian session, extending its sharpest selloff in over a decade as traders lock in profits after a nine-week record-breaking rally. Easing US-China trade tensions ahead of the November 1 tariff deadline further dampen safe-haven demand.
⭐️Personal comments NOVA:
Currently, the gold price fluctuates greatly and moves quickly. There are signs of recovery and retreat to the resistance zone around 4235.
⭐️SET UP GOLD PRICE:
🔥SELL GOLD zone: 4235 - 4237 SL 4242
TP1: $4222
TP2: $4200
TP3: $4170
⭐️Technical analysis:
Based on technical indicators EMA 34, EMA89 and support resistance areas to set up a reasonable SELL order.
⭐️NOTE:
Note: Nova wishes traders to manage their capital well
- take the number of lots that match your capital
- Takeprofit equal to 4-6% of capital account
- Stoplose equal to 2-3% of capital account

Short term correction - down below 4300⭐️GOLDEN INFORMATION:
Gold (XAU/USD) dips to around $4,245 in early Asian trading on Monday, pausing after its record-breaking rally. The pullback comes as physical demand eases following the festive surge, while traders await China’s Q3 GDP, Industrial Production, and Retail Sales data later in the day. Last week, the metal gained support from India’s festive demand and robust ETF inflows. However, with fundamentals largely priced in, a short-term correction or consolidation appears likely.
⭐️Personal comments NOVA:
Gold price started to accumulate, adjusted down below 4300 at the beginning of the week. Short-term downtrend
⭐️SET UP GOLD PRICE:
🔥SELL GOLD zone: 4320 - 4322 SL 4327
TP1: $4310
TP2: $4300
TP3: $4283
🔥BUY GOLD zone: $4222-$4224 SL $4217
TP1: $4235
TP2: $4250
TP3: $4270
⭐️Technical analysis:
Based on technical indicators EMA 34, EMA89 and support resistance areas to set up a reasonable SELL order.
⭐️NOTE:
Note: Nova wishes traders to manage their capital well
- take the number of lots that match your capital
- Takeprofit equal to 4-6% of capital account
- Stoplose equal to 2-3% of capital account
USOIL: Pullback within the correction on the 4h timeframeTo better understand my current outlook on USOIL, please refer to my previous higher-timeframe and fundamental analyses:
* Trend: assessed using at least three trend indicators, with market structure as the primary guide.
** Weak or Reversal Signals: Assessed based on one of our criteria for trend reversal signals.
*** Support/Resistance: Selected from multiple factors – static (Swing High, Swing Low, etc.), dynamic (EMA, MA, etc.), psychological (Fibonacci, RSI, etc.) – and determined based on the trader’s discretion.
**** Our advice takes into account all factors, including both fundamental and technical analysis. It is not intended as a profit target. We hope it can serve as a reference to help you trade more effectively. This advice is for informational purposes only and we assume no responsibility for any trading results based on it.
George Vann @ ZuperView
SHORT ON GBP/NZDGBP/NZD has a nice rising wedge (bearish reversal pattern) at a major level of resistance.
I will be selling GBP/NZD To the next level of demand looking to catch 200-300 pips.

USDJPY: Selling on lower timeframes as price retraces on the 4hTo better understand my current outlook on USDJPY, please refer to my previous higher-timeframe and fundamental analyses:
* Trend: assessed using at least three trend indicators, with market structure as the primary guide.
** Weak or Reversal Signals: Assessed based on one of our criteria for trend reversal signals.
*** Support/Resistance: Selected from multiple factors – static (Swing High, Swing Low, etc.), dynamic (EMA, MA, etc.), psychological (Fibonacci, RSI, etc.) – and determined based on the trader’s discretion.
**** Our advice takes into account all factors, including both fundamental and technical analysis. It is not intended as a profit target. We hope it can serve as a reference to help you trade more effectively. This advice is for informational purposes only and we assume no responsibility for any trading results based on it.
George Vann @ ZuperView

AUDUSD potential SELL setupAUDUSD
Bearish Setup
Breakout Analysis:
Distribution pattern with breakdown below key support suggests downside acceleration/momentum.
Strategy Framework:
Since the forecast calls for more downside momentum we can anticipate a corrective move towards BOS. The zone between BOS and Resistance Zone give us our POI, where we should be looking for shorts to ride the downside wave towards our targets.
Technical Analysis:
- Breakdown Level:
- Entry Strategy: Short on confirmed BOS level
- Stop Loss: Above Resistance zone.
Target Zones:
- Primary Target: 1 (R:R 1:2)
- Secondary Target: 2 (R:R 1:3)
- Extension Target: 3 (R:R 1:4)
Bearish Confirmations:
🔻 Rejection candlestick patterns
🔻 Bearish Reversal patterns
🔻 Impulsive moves in line with setups directional bias
Position Management:
- Exit: Partial profits at targets
- Stop adjustment: Trail below resistance
LIKE or COMMENT if this idea sparks your interest, or share your thoughts below!
FOLLOW to keep up with fresh ideas.
Tidypips: "Keep It Clean, Trade Mean!"

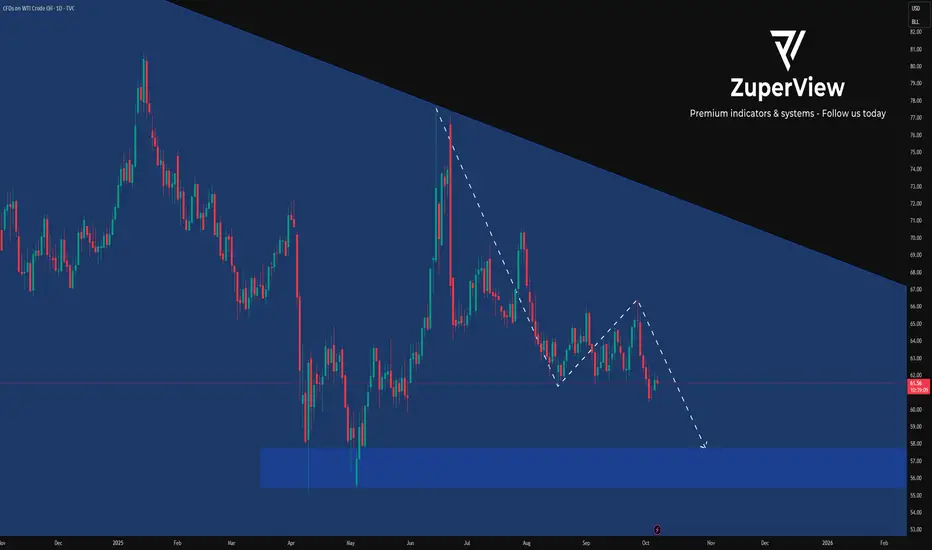
USOIL: Check lower levels after breaking out of the rangeThis is my previous analysis — feel free to take a look for reference.
OIL PRICE OUTLOOK
(Week of Oct 06 - 10, 2025)
1. Institutional Forecast Updates
● IEA (Sep 15, 2025):
WTI targets $64.2/bbl for 2025 and $47.8/bbl for 2026
Brent targets $68/bbl for 2025 and $51/bbl for 2026
● Goldman Sach (Jul 14, 2025):
WTI targets $63/bbl for H2 2025 and $52/bbl for 2026
Brent targets $64/bbl for H2 2025 and $56/bbl for 2026
● J.P. Morgan (May 16, 2025):
WTI targets $63/bbl for H2 2025 and $52/bbl for 2026
Brent targets $64/bbl for H2 2025 and $56/bbl for 2026
www.rigzone.com
www.reuters.com www.jpmorgan.com
2. Key Drivers & Risks
🔹 Updates on Supply–Demand and Geopolitical News
OPEC+ announced a milder-than-expected production increase of around 137 kb/d for November, leaving the oversupply outlook through 2026 largely unchanged.
Geopolitical tensions in the Red Sea / Gulf of Aden have flared up again.
U.S. inventories and weekly data: API estimated a draw of 3.7 mb (Sep 26), while recent EIA reports have shown mixed, inconsistent trends.
Market consensus: Reuters’ latest survey keeps the Brent forecast at ~$67.6/bbl for 2025, unchanged from last month, with expectations for lower prices around $60 in 2025 and further weakness into 2026.
🔹 Watchlist for Next Week
Official details on OPEC+’s November production implementation
API / EIA weekly U.S. oil data
Maritime security developments
Any notable demand-side signals
🔹 Overall View
Governments appear to favor keeping oil prices lower to support economic growth, though current levels are near or below breakeven for many producers.
Oil prices are expected to gradually decline within a relatively narrow range of $70–$50, while potential supply–demand shocks remain key factors to monitor for any sharp volatility.
3. Technical Analysis
* Trend: assessed using at least three trend indicators, with market structure as the primary guide.
** Weak or Reversal Signals: Assessed based on one of our criteria for trend reversal signals.
*** Support/Resistance: Selected from multiple factors – static (Swing High, Swing Low, etc.), dynamic (EMA, MA, etc.), psychological (Fibonacci, RSI, etc.) – and determined based on the trader’s discretion.
**** Our advice takes into account all factors, including both fundamental and technical analysis. It is not intended as a profit target. We hope it can serve as a reference to help you trade more effectively. This advice is for informational purposes only and we assume no responsibility for any trading results based on it.
Please like and comment below to support our traders. Your reactions will motivate us to do more analysis in the future 🙏✨
George Vann @ ZuperView
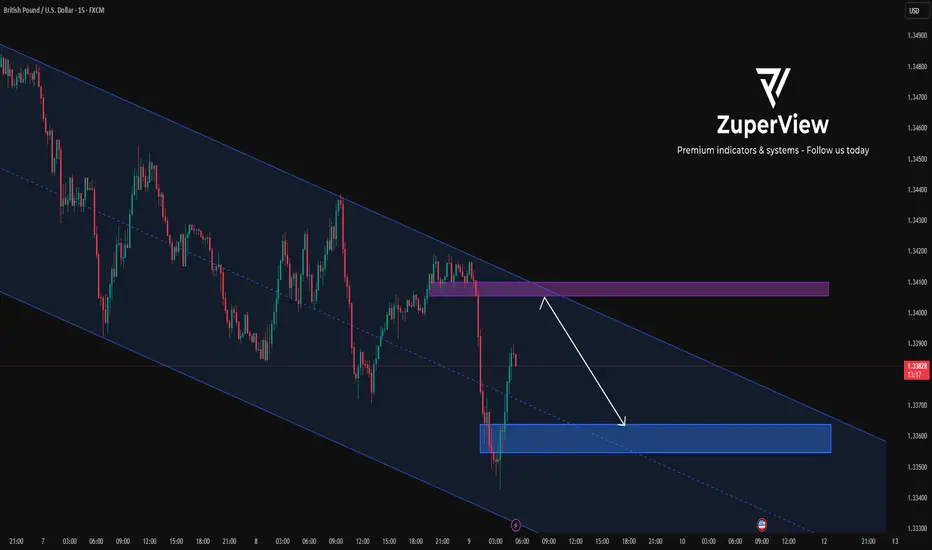
GBPUSD: testing bearish correction pressure from the higher time
* Trend: assessed using at least three trend indicators, with market structure as the primary guide.
** Weak or Reversal Signals: Assessed based on one of our criteria for trend reversal signals.
*** Support/Resistance: Selected from multiple factors – static (Swing High, Swing Low, etc.), dynamic (EMA, MA, etc.), psychological (Fibonacci, RSI, etc.) – and determined based on the trader’s discretion.
**** Our advice takes into account all factors, including both fundamental and technical analysis. It is not intended as a profit target. We hope it can serve as a reference to help you trade more effectively. This advice is for informational purposes only and we assume no responsibility for any trading results based on it.
Please like and comment below to support our traders. Your reactions will motivate us to do more analysis in the future 🙏✨
George Vann @ ZuperView
Gold price dropped sharply, adjusted around 3900⭐️GOLDEN INFORMATION:
Gold (XAU/USD) holds below the key $4,000 mark during the Asian session on Friday. While the metal remains under pressure after Thursday’s pullback from record highs, softer US Dollar momentum, expectations of further Fed rate cuts, and lingering US government shutdown concerns continue to lend support.
⭐️Personal comments NOVA:
Gold price started to have a large-scale correction, below 3400. Selling pressure continued around 3900.
⭐️SET UP GOLD PRICE:
🔥SELL GOLD zone: 4018 - 4020 SL 4025
TP1: $4005
TP2: $3980
TP3: $3965
🔥BUY GOLD zone: $3894-$3896 SL $3889
TP1: $3905
TP2: $3920
TP3: $3935
⭐️Technical analysis:
Based on technical indicators EMA 34, EMA89 and support resistance areas to set up a reasonable SELL order.
⭐️NOTE:
Note: Nova wishes traders to manage their capital well
- take the number of lots that match your capital
- Takeprofit equal to 4-6% of capital account
- Stoplose equal to 2-3% of capital account

Crude oil future Decline toward 59$hello,
According to my technical analysis, there is a high probability of a decline toward $59 in the next few hours for two main reasons:
-A breakout below the support level.
-A pullback retesting that broken support.

USDJPY: Waiting for a pullback to sell at resistanceThis could be a position trade in anticipation of a larger downtrend on the daily timeframe, but there's risk involved due to the upcoming Non-Farm Payrolls (NFP) report this Friday.
* Trend: assessed using at least three trend indicators, with market structure as the primary guide.
** Weak or Reversal Signals: Assessed based on one of our criteria for trend reversal signals.
*** Support/Resistance: Selected from multiple factors – static (Swing High, Swing Low, etc.), dynamic (EMA, MA, etc.), psychological (Fibonacci, RSI, etc.) – and determined based on the trader’s discretion.
**** Our advice takes into account all factors, including both fundamental and technical analysis. It is not intended as a profit target. We hope it can serve as a reference to help you trade more effectively. This advice is for informational purposes only and we assume no responsibility for any trading results based on it.
Please like and comment below to support our traders. Your reactions will motivate us to do more analysis in the future 🙏✨
George Vann @ ZuperView
