SENSEX 30M — BTR Pro generated a clean SELL signal and price perSENSEX 30M — BTR Pro generated a clean SELL signal and price perfectly achieved T-1 🎯
Disciplined entry + auto SL + predefined targets = rule-based trading in action.
✅ Sell signal executed
🎯 T-1 target perfectly achieved
📉 Strong downside momentum confirmation
BTR Pro continues to deliver high-probability setups with clear risk management.
⚠️ For educational purposes only.
#SENSEX #IntradayTrading #BTROPro #TradingView #PriceAction #BK_QuantDesk
Sensexanalysis

SENSEX Technical Analysis - Imortant levels📌 SENSEX – Recovery Attempt Approaching Strong Supply With Cautious CPR Tone
SENSEX is witnessing a technical rebound after the recent corrective decline, indicating responsive buying near lower levels but not yet confirming a decisive shift in the broader structure. Price is currently trading around the 83,400–83,550 region, gradually advancing toward a critical overhead resistance cluster. Immediate resistance is placed at 83,819.90, followed by 84,059.39, while the major structural barrier stands near 84,506.67, marking a strong supply band where prior advances have struggled to sustain.
On the downside, immediate support is seen at 83,133.13, which aligns with recent swing stability. Below this, stronger supports are positioned at 82,685.85 and 82,446.36, forming a layered cushion that could absorb declines if profit booking emerges. The chart highlights a primary demand zone near 81,500–81,650, with an extended accumulation area closer to 80,300–80,500, whereas the supply zone is concentrated between 83,800–84,100, suggesting the index is currently transitioning between value areas rather than trending decisively.
The CPR structure remains narrow and moving slightly lower despite being in a bullish zone, reflecting improving participation but still signalling caution. The dashboard indicates low momentum and a wait-and-watch environment, implying that the present move may be more of a stabilisation phase unless supported by stronger follow-through buying.
Overall, SENSEX appears to be in a range recovery within a broader corrective framework. Sustaining above 83,100 can keep the short-term tone stable, but only a decisive breakout above 84,100–84,500 would materially strengthen bullish confidence and signal potential trend repair.
📊 Sentiment remains balanced. Domestic liquidity and macro stability continue to support dips, yet markets are showing intermittent profit booking near higher levels, pointing toward consolidation rather than immediate expansion.
🔎 Probabilistic Tilt Based on Levels & Environment:
Bullish Scenario: A sustained move above 83,820–84,060 could open the path toward 84,500+, signalling strengthening momentum.
Neutral / Choppy Scenario: Holding between 83,100–84,000 would indicate range-bound behaviour as the market digests recent volatility.
Bearish Scenario: Failure to hold 83,133 may drag the index toward 82,685–82,450, with deeper downside possible if broader sentiment weakens.
⚠️ Disclaimer:
This content is shared purely for educational and informational purposes to enhance market understanding. It should not be construed as investment, trading, or financial advice. Market conditions can change rapidly, and past price behaviour does not guarantee future outcomes. Please consult a SEBI-registered financial advisor before making any investment or trading decisions, and ensure appropriate risk management at all times.

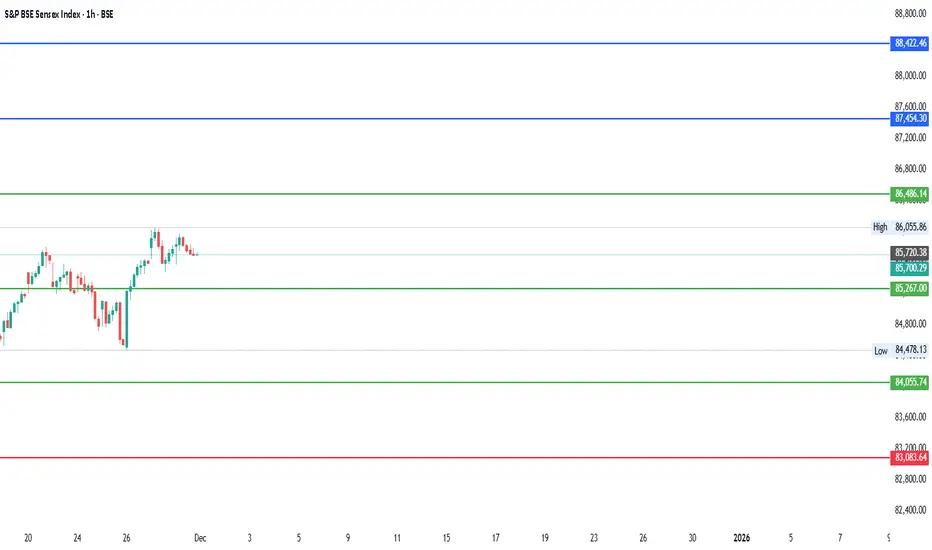
#Sensex - Is a 5,000-point move loading?Date: 30-11-2025
#Sensex Current Price: ₹ 85,706.67
Pivot Point: ₹ 85,267.00 Support: ₹ 84,055.74 Resistance: ₹ 86,486.14
Upside Levels:
L1: ₹ 87,454.30 L2: ₹ 88,422.46 L3: ₹ 89,605.75 L4: ₹ 90,789.05
Downside Levels:
L1: ₹ 83,083.64 L2: ₹ 82,111.54 L3: ₹ 80,928.24 L4: ₹ 79,744.94
#Sensex #Markets #Stocks #IndiaMarkets #Trading #Nifty #SensexUpdate #MarketOutlook #in_tradingview
BTR PRO Delivers Again – +50 Points INTRADAY! 27 Jan 2026🔥 BTR PRO DELIVERS AGAIN – +50 POINTS INTRADAY! 🔥
📅 Date: 27 Jan 2026
Stock: BSE LTD
Indicator: BTR PRO Price Action (SL + Targets)
✅ BUY ENTRY: 2705
🎯 T1 HIT
🎯 T2 HIT
🎯 T3 HIT
📈 INTRADAY EXIT: 2755
💰 PROFIT: +50 POINTS CLEAN MOVE
No noise.
No emotions.
Pure Price Action + Rule-Based Targets.
📌 Intraday traders booked full 50 points
📌 Swing targets worked perfectly
👉 Follow BTR PRO
👉 Trade with structure, not hope
#BTRPRO #50Points #IntradayTrading #BSELTD #PriceAction #TradingView #NoEmotionTrading #ConsistencyWins 💪📊

BTR delivers +50 points | 22 JAN 2026 | BSE LTD🔥BTR delivers +50 points | 22 JAN 2026 | BSE LTD 🔥
Live trade shared in advance.
End of day = CLEAR +50 POINTS PROFIT ✅
No noise. No emotion. Only BTR Price Action.
👉 Follow for LIVE trading setups
💰 +50 POINTS DONE & DUSTED | BTR POWER 💰
22 Jan 2026 — Live setup → Clean execution → 50 POINTS PROFIT
This is what discipline + structure looks like.
📌 Follow BTR for real-time trade setups
🚀 BTR HITS +50 POINTS TODAY (LIVE TRADE) 🚀
Setup shared live.
Market respected BTR levels.
End result = +50 POINTS PROFIT 🔥
Trade less. Trade smarter.
➡️ Follow for daily live setups
📊 FROM LIVE SETUP TO +50 POINTS PROFIT 📊
22 Jan 2026
BTR Price Action Indicator → Accurate entry & clean exit
No overtrading. No guesswork.
💥 +50 POINTS BANKED
🧠 PROOF > PROMISES | +50 POINTS WITH BTR 🧠
Live trade shared in the morning.
End of day result: +50 POINTS PROFIT ✅
Consistency beats prediction.
🔔 Follow for live BTR trade setups

BTR Price Action Indicator –Trade on NIFTY 50 600 POINTS DONE🔥 BTR Price Action Indicator – First Ever Trade on NIFTY 50 (1H) | 600 POINTS DONE 🔥
For the first time, we applied the BTR Price Action Indicator on the NIFTY 50 Index (Hourly timeframe) — and the result was nothing short of PERFECT. 🎯
📉 BTR Generated Short Signal at 26,170
The market respected pure price action, and BTR guided the trade step-by-step with precision.
✅ Trade Breakdown (Premium Setup):
Entry: 26,170 (BTR Short Signal)
Target 1: +200 points ✔️
Target 2: +400 points ✔️
Target 3: +600 points ✔️
Final Exit: 25,570
📊 Total Gain: 600 POINTS in a single directional move
💎 No guesswork. No overtrading. Only clean price action.
🔥 BTR Price Action Indicator – First Ever Trade on NIFTY 50 (1H) | 600 POINTS DONE 🔥
For the first time, we applied the BTR Price Action Indicator on the NIFTY 50 Index (Hourly timeframe) — and the result was nothing short of PERFECT. 🎯
📉 BTR Generated Short Signal at 26,170
The market respected pure price action, and BTR guided the trade step-by-step with precision.
✅ Trade Breakdown (Premium Setup):
Entry: 26,170 (BTR Short Signal)
Target 1: +200 points ✔️
Target 2: +400 points ✔️
Target 3: +600 points ✔️
Final Exit: 25,570
📊 Total Gain: 600 POINTS in a single directional move
💎 No guesswork. No overtrading. Only clean price action.
⚠️ Educational purpose only. Trade with proper risk management.
BTR – Let Price Action Do the Talking. 📈 NSE:NIFTY

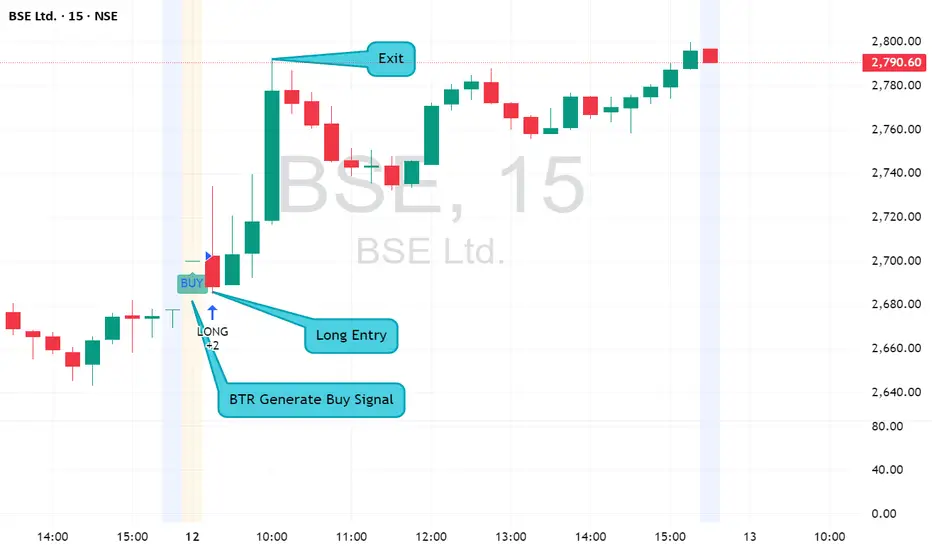
BTR Perfect Trade in BSE LTD| +100 Points in Just 4 Candles🚀 BTR Perfect Trade | +100 Points in Just 4 Candles
Stock: BSE LTD
Timeframe: Intraday
Indicator: BTR Price Action
🔔 Trade Details
Signal: 🟢 Buy (Long)
Entry: 2690
Exit: 2790
Points Captured: 🔥 +100 Points
Time Taken: Only 4 Candles
📈 Why This Trade Was Special
✔ Clean trend initiation
✔ Strong momentum confirmation
✔ No whipsaw, no noise
✔ Fast move → quick profit
✔ Textbook BTR execution
This is exactly how price action + structure should behave when the trend is real.
🧠 BTR Logic in Action
Entry came after confirmation, not anticipation
Exit respected target / structure, not greed
Trade delivered high reward in short time
❝ You don’t need many trades —
you need the right trade. ❞
📊 Market Insight
After several volatile and loss-recovery days,
BTR waited patiently and then attacked with precision.
This trade alone:
Covered previous losses
Restored confidence
Reinforced trust in the system
✅ Trader’s Discipline Checklist
NSE:BSE
✔ Followed signal
✔ No early exit
✔ No overtrading
✔ Let profits run
📍 Follow for Daily BTR Price Action Updates
📊 Indicator available in my profile → Scripts section
💬 DM for intraday & option trading guidance with BTR
BTR Update — 08 Jan 2026 | Profitable Trade 40 Points📊 BTR Update — 08 Jan 2026 | Profitable Trade
Stock: BSE LTD
Timeframe: Intraday
Indicator: BTR Price Action
🔔 BTR Signal
Signal Type: 🔻 Sell (Short)
Entry: 2735
Exit: 2695
💰 Trade Result
Points Gained: +40 Points
Trade Outcome: ✅ Profit Booked
🧠 Market Insight
Strong rejection from higher levels confirmed bearish momentum.
BTR accurately captured the intraday reversal, delivering a clean move.
✅ Execution Summary
✔ Clear signal
✔ Clean entry & exit
✔ Discipline maintained
✔ No emotional trading
📈 BTR Performance Note
BTR continues to perform well in volatile and trend-driven markets,
rewarding patience + rule-based execution.
📍 Next trade only on fresh BTR signal
— AdiJohn

31 Dec 2025 — Last Trading Day of the Year (Wining +15 Points)🚀 Thank You Traders!
Wishing everyone a powerful & profitable journey in 2026 with the BTR Price Action Indicator.
2025 was just the beginning…
BTR Price Action launched in Dec 2025 — and even with just one month of live testing, we saw consistent clarity, clean entries, and multiple winning trades.
📌 Today’s Trade — BSE LTD
Timeframe: 15M
Signal: Long (Buy)
Entry: 2620
Exit: 2635
Profit: +15 Points in Intraday 💥
➡️ Market conditions didn’t matter.
➡️ No noise, No confusion.
➡️ Just follow BTR.
🔄 What Happened
BTR Price Action generated a fresh long signal
Entry Activated at 2620
Target Reached → Exit at 2635
Another Winning Trade to close the year 🎯
🔥 2026 Vision
2026 = Full Year of Trading with BTR
📈 More setups
📈 More confidence
📈 More rule-based entries
📈 More discipline
📈 More success stories
I’ll share a complete recap of all December 2025 trades soon.
Stay tuned!
💡 Want to Start with BTR?
📌 Go to my TradingView Profile → Scripts Section
📌 Add BTR Price Action Indicator
📌 Start trading with clarity, not chaos.
🚀 Happy New Year in Advance 🥳
Follow BTR. Follow Discipline.
Let’s Win 2026 Together. 💙📊

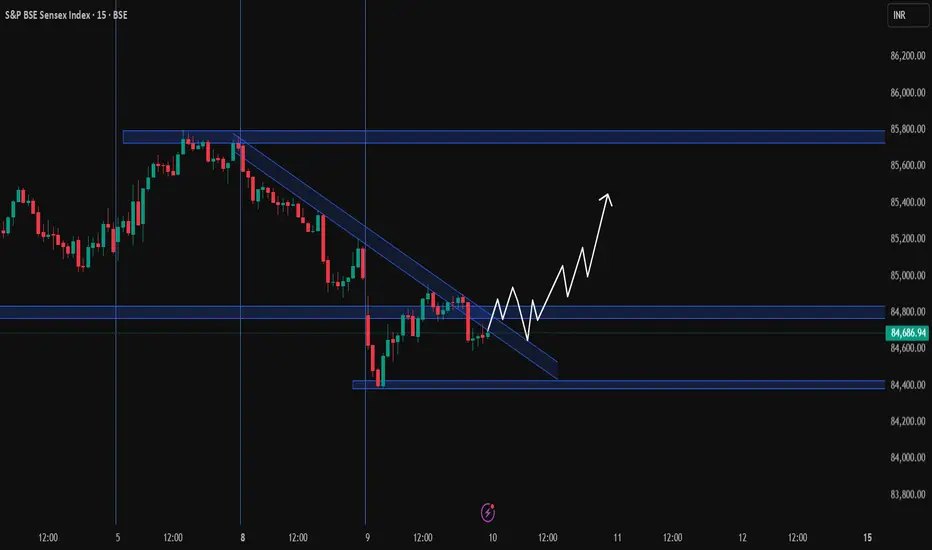
Breakout Reloaded: Sensex Setting Up for a Fresh Upside Leg?Strong support zone: 84,500–84,600. Buyers have defended it multiple times.
Immediate resistance: 84,780–84,820. A clean breakout above this can trigger momentum.
If price holds above the breakout retest area, the structure supports a steady grind up toward:
85,200
85,500
85,750–85,800 (major supply zone)
Bias: Bullish as long as 84,500 is protected.
Invalidation: Breakdown below 84,500 → trend weakens again.
Disclaimer: This is not financial advice. Do your own analysis before taking any trade.
Sensex index intraday ideasensex chart analysis on 15 minutes
this is only for intraday
t me profiitmantra

Can SENSEX Hit 82,600? Breakout + GST Reforms Explained.The SENSEX has successfully broken its downtrend and is now consolidating after a healthy retest, indicating strength and stability at current levels.
Key Macro Triggers
📊 Inflation Cooling:
* July CPI fell sharply to1.55%, the lowest since June 2017😮
* Food Inflation came in at -1.76%, down from -1.06% in June, signaling strong disinflationary trends.
This cooling inflation provides the RBI more room for policy support, boosting overall market sentiment.
⚖️ Policy Catalyst – GST Reforms by Diwali 2025:
In his Independence Day speech, PM Modi highlighted “Next-Gen GST Reforms,” which could act as a major structural trigger for the markets:
* 12% GST slab ➝ May shift to 5% 💡
* 28% GST slab ➝ May shift to 18% 📉
* New 40% slab** for sin goods (tobacco, beer, etc.)
These reforms, if implemented, would lower tax burdens, increase consumption, and improve corporate profitability**, setting the stage for a sustained equity rally.
Trade Setup – SENSEX
With strong macro tailwinds and technical breakout confirmation, we can look for long trades in the index:
* Entry: Current consolidation zone
* Stop Loss: Below recent retest level
* Target 1: 81,500
* Target 2: 82,600
⚠️ Risk Note:
While domestic triggers look favorable, Trump’s additional tariff policies could weigh on global risk sentiment and temporarily hinder momentum in Indian equities.
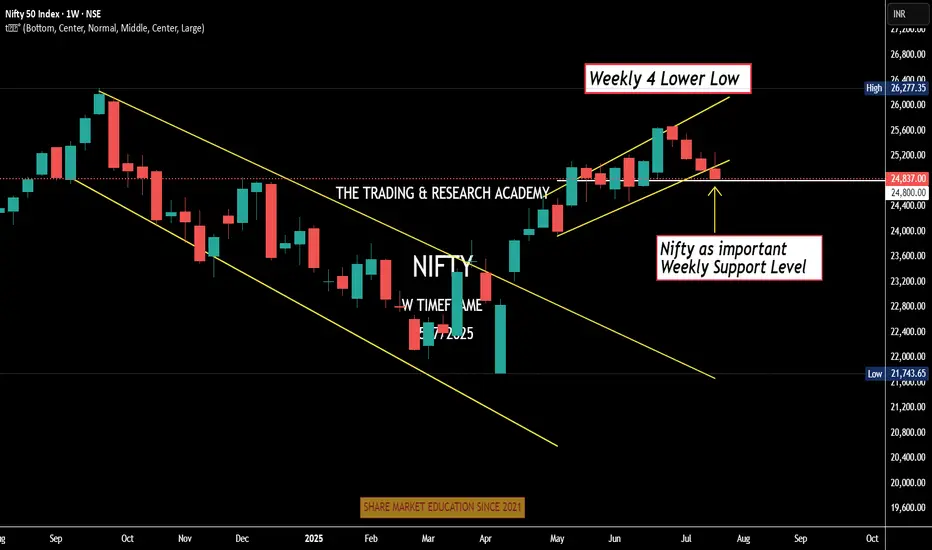
Weekly Nifty Analysis Next week, can we have a small bounce in #Nifty?
4 Lower Low
Daily channel Breakdown
Index at crucial weekly support level
Can one bullish week / Doji be expected. One news here or there & boom!
We have monthly expiry this week, let's see.
Trap Set at the Top? Sensex Sell-Side Objective = 81,886Sensex is currently trading at 82,220 and showing early signs of a potential sell-side move based on Smart Money dynamics. After grabbing buy-side liquidity above recent highs, we’ve now entered a distribution phase.
Price has shown rejection from a premium zone, and a market structure shift is forming on lower timeframes — all pointing toward a probable move to the sell-side liquidity pool near 81,886.
This zone aligns with Smart Money's objective to tap resting liquidity below recent swing lows before any major reversal. Caution is advised for longs. Wait for confirmation if you're planning to ride the short move with the institutions. 🎯💼

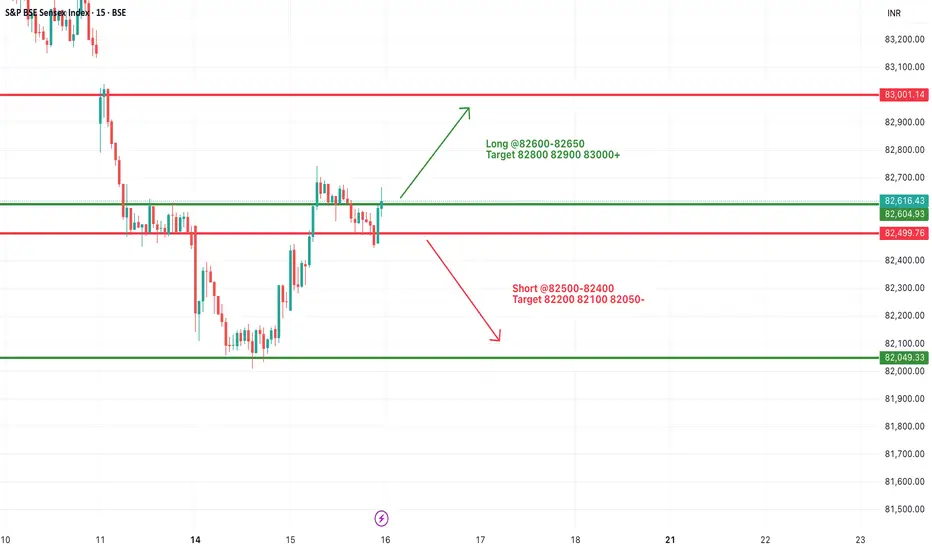
#SENSEX Intraday Support and Resistance Levels - 16/07/2025Sensex is expected to open flat near the crucial 82600–82650 resistance zone, which has acted as a turning point multiple times recently. A sustained move above this range may trigger bullish momentum toward 82800, 82900, and even 83000+. This move would indicate a positive continuation after the recovery seen from recent lows.
However, if the index faces rejection around 82600–82650, it may once again slip below 82500, opening the door for short-side opportunities with targets at 82200, 82100, and 82050. This region has seen a lot of price action over the last few sessions, so volatility may be higher.
#SENSEX Intraday Support and Resistance Levels - 15/07/2025Sensex is likely to kick off the session with a gap-up opening around the 82500 level, reflecting early bullish momentum. If this initial strength holds and the index begins to build above the 82600–82650 zone, it could signal the start of a recovery leg toward higher resistance levels at 82800, 82900, and potentially 83000+. Sustained action above 82650 may encourage momentum traders to chase strength during the day.
However, the 82500–82650 range will act as a battleground. Failure to defend this zone could invite selling pressure. A breakdown below 82500 may expose the index to intraday weakness, opening downside targets at 82200, 82100, and even 82050. In this case, expect volatility to increase near support levels.
Traders should approach with a flexible strategy—watching for breakout confirmation above 82650 or signs of reversal pressure below 82500. Today’s early range could set the tone for the entire session.

#SENSEX Intraday Support and Resistance Levels - 14/07/2025Sensex is likely to open slightly gap-down, reflecting weakness carried over from the previous session. The index is currently trading near the 82450 zone. A breakdown below the 82400 level may trigger further downside movement, with potential support targets at 82200, 82100, and 82000. This zone should be monitored closely for continuation or reversal.
On the upside, any strong recovery above the 82600–82650 level could push the index higher, with resistance targets at 82800, 82900, and 83000+. Sustaining above this range may indicate buying interest returning in the market.
If Sensex spikes toward the 82950–83000 zone and faces resistance, a reversal from there could create shorting opportunities with targets at 82800, 82700, and 82600. However, a clear breakout above 83000 would negate this short setup and shift the bias to bullish.
The index is currently in a consolidation zone, and price action around 82600–82400 will be critical to determine the day’s direction.

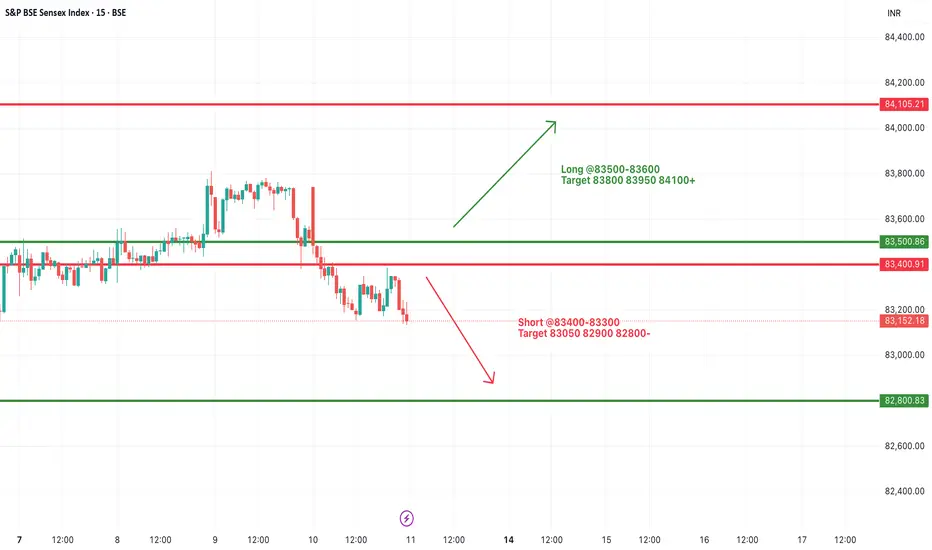
#SENSEX Intraday Support and Resistance Levels - 11/07/2025Sensex is expected to open flat after a consolidation phase and weak closing in the previous session. The index is currently hovering near the support zone of 83400–83300. If Sensex breaks and sustains below this level, further downside may unfold toward 83050, 82900, and 82800. This level should be watched closely as a decisive break may trigger increased selling pressure.
On the upside, a recovery and breakout above 83500–83600 could indicate a potential reversal. Sustaining above this zone can lead the index to rally toward 83800, 83950, and possibly 84100+. However, the price action near this resistance band will be crucial for any confirmation of bullish strength.
Overall, the sentiment remains weak with a bearish bias unless a strong breakout happens on the upside. Traders should remain cautious and focus on these breakout levels for intraday opportunities with proper risk management.
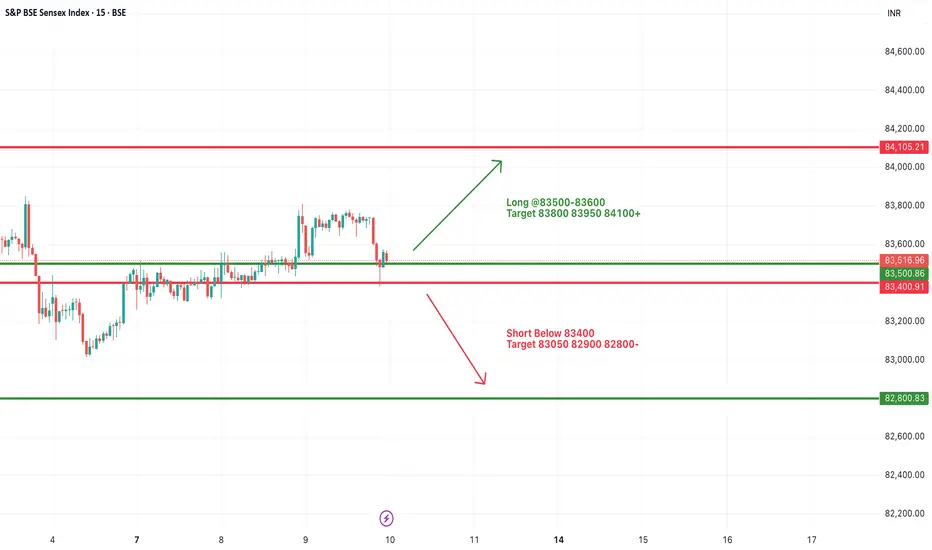
#SENSEX Intraday Support and Resistance Levels - 10/07/2025Sensex is expected to open flat today, continuing the consolidation observed in the past few sessions. The price action remains range-bound with key support near 83400 and resistance around 83600 levels.
Currently, Sensex is hovering near its critical range with buyers and sellers struggling for control. A breakout above the 83500–83600 zone may trigger fresh bullish momentum with targets at 83800, 83950, and 84100+. Sustained movement above 84100 could signal a stronger trend reversal.
On the downside, a breakdown below the 83400 level could lead to weakness, with immediate targets at 83050, 82900, and 82800-.
#SENSEX Intraday Support and Resistance Levels - 09/07/2025Sensex is expected to open slightly gap up near the 83500–83600 range, showing positive momentum as it breaks out from its recent consolidation zone. A sustained move above this level could trigger further upside, with immediate targets seen at 83800, 83950, and 84100+ levels. This zone will act as a crucial resistance-turned-support for the session.
However, if the index fails to hold above 83500 and slips below 83400, it may enter a corrective phase. A breakdown below 83400 could lead to a downward move toward 83050, 82900, and possibly 82800-. Overall, trend remains positive above 83600, and traders should watch for confirmation in the opening session.

#SENSEX Intraday Support and Resistance Levels - 08/07/2025Sensex is expected to open flat today around the 83400 zone, showing no major gap or volatility at the open. The index continues to move in a tight consolidation range between 83300 and 83500. A decisive move outside this zone is likely to give direction to the market.
If the index sustains above 83500, it could lead to a bullish breakout, pushing prices towards 83700, 83800, and eventually 83950+. This breakout may indicate fresh buying interest after a prolonged sideways phase.
However, if Sensex breaches the 83300 level on the downside, it could trigger selling pressure with targets at 83050, 82900, and 82800-. Traders are advised to wait for a clear breakout or breakdown before entering any trades, as the current zone lacks momentum.

NIFTY THIS WEEK? What's the plan
"There’s more hidden in a candle chart than most headlines will ever reveal.”
If you look at this NIFTY chart casually, you’ll see just another uptrend. But if you feel the price — really look into the structure — you’ll notice something deeper:
We’re not just in a rally. We’re in a breakout after base-building. And that’s a very different game.
What I Noticed This Week:
1. Strong Follow-Through
NIFTY didn’t just pop — it’s sustaining gains. Each green candle is following the next without hesitation. That means institutions are buying, not just retailers reacting.
2. Previous Resistance = Gone
Look back at 25,200–25,300. That zone rejected price multiple times. Now? It’s broken clean, with a bullish Marubozu-style candle. That’s a confirmation, not just a fluke.
3. No Panic Selling Yet
Usually, breakouts invite profit booking. This one? Sellers are quiet. When there's no rejection at new highs, it tells you confidence is strong.
But Here’s What You Must Watch:
Are we near psychological exhaustion? Markets can get euphoric and overextend - even in strong trends. Volume Spike or Divergence? If volumes dry or RSI starts diverging, stay alert.
Global cues & Bank Nifty:
If Bank Nifty stalls, NIFTY will slow too. Watch correlation.
What This Means for You:
Trend is strong, but smart traders plan exits in upmoves - not panic in downmoves.
Ask yourself:
Do you have entries based on structure?
Are you overexposed at highs, hoping for more?
Are you following momentum blindly or with plan?
Personal Reflection:
I’ve learned this the hard way:
“Buying strength is good. But riding strength without a stop loss is just greed in disguise.”
So this week:
Observe, don’t chase.
Track - don’t blindly enter.
There’s always another breakout. But there’s only one portfolio.

Sensex Intraday Analysis on May 12, 2025A bearish intraday trend is likely on May 12, 2025. The Sensex may find support at 79,067 (Support 1) and 78,250 (Support 2).
However, gap openings in either direction could invalidate this analysis. Traders are advised to rely on technical indicators before taking positions. Effective risk management remains essential.
