Sentiment Analysis: How AI Reads the Market's Emotional State
Markets Are Driven by Emotion - AI Can Now Read That Emotion at Scale
"Be fearful when others are greedy, and greedy when others are fearful."
Everyone knows this quote. Few can actually measure fear and greed in real-time.
AI changes that. Sentiment analysis allows you to quantify what the crowd is feeling - and position accordingly.
What Is Sentiment Analysis?
Definition:
Sentiment analysis uses natural language processing (NLP) to determine the emotional tone of text — positive, negative, or neutral.
In Trading:
Applied to:
News articles and headlines
Social media posts (Twitter/X, Reddit, etc.)
Earnings call transcripts
Analyst reports
Forum discussions
The Goal:
Quantify market mood to identify extremes and potential turning points.
How AI Processes Sentiment
Step 1: Data Collection
AI gathers text from multiple sources:
Financial news feeds
Social media APIs
Forum scrapers
Earnings transcripts
Step 2: Text Processing
Natural Language Processing (NLP):
Tokenization (breaking text into words)
Removing noise (stop words, punctuation)
Identifying relevant entities (tickers, companies)
Step 3: Sentiment Classification
Each piece of text is scored:
Positive (+1)
Negative (-1)
Neutral (0)
Or a continuous scale (-1 to +1)
Step 4: Aggregation
Individual scores are combined:
By asset (all mentions of a ticker)
By time (hourly, daily sentiment)
By source (news vs social media)
Step 5: Signal Generation
Extreme readings trigger alerts:
Extreme fear → potential buying opportunity
Extreme greed → potential selling opportunity
Types of Sentiment Indicators
1. News Sentiment
Analyzes financial news headlines and articles.
Characteristics:
More reliable, professional sources
Slower to update
Often reflects institutional view
Less noise, more signal
2. Social Media Sentiment
Analyzes Twitter/X, Reddit, StockTwits, etc.
Characteristics:
Real-time updates
High noise level
Reflects retail sentiment
Can identify viral narratives early
3. Options Sentiment
Derived from options market activity.
Indicators:
Put/Call ratio
Implied volatility skew
Options volume patterns
4. On-Chain Sentiment (Crypto)
Blockchain data revealing holder behavior.
Indicators:
Exchange inflows/outflows
Holder distribution changes
Stablecoin flows
5. Composite Sentiment
Combines multiple sources into single score.
Example: Fear & Greed Index
Volatility
Market momentum
Social media
Surveys
Safe haven demand
Trading Sentiment Extremes
The Contrarian Approach:
Sentiment works best at extremes:
Extreme fear often marks bottoms
Extreme greed often marks tops
Why This Works:
At extremes, most participants are already positioned
Few buyers left at peak greed
Few sellers left at peak fear
Reversals become more likely
The Confirmation Approach:
Use sentiment to confirm existing analysis:
Bullish setup + improving sentiment = stronger signal
Bearish setup + deteriorating sentiment = stronger signal
Sentiment Analysis Framework
Level 1: Identify Current Sentiment
What is the overall market mood?
Is it extreme or neutral?
What's driving the sentiment?
Level 2: Compare to Price Action
Is sentiment confirming price?
Or is there divergence?
Divergence often precedes reversals
Level 3: Identify Sentiment Shifts
Is sentiment improving or deteriorating?
Rate of change matters
Rapid shifts can signal turning points
Level 4: Context Integration
What's the fundamental backdrop?
Are there upcoming events?
Does sentiment make sense given context?
AI Sentiment Tools and Techniques
Technique 1: Keyword Scoring
Simple approach:
Define positive words (bullish, moon, buy)
Define negative words (crash, dump, sell)
Count occurrences and calculate ratio
Limitation: Misses context and sarcasm
Technique 2: Machine Learning Classification
Train models on labeled data:
Human-labeled examples of positive/negative text
Model learns patterns
Applies to new text
Advantage: Better context understanding
Technique 3: Large Language Models
Modern approach:
Pre-trained on massive text datasets
Fine-tuned for financial sentiment
Understands nuance and context
Advantage: Handles complex language, sarcasm, implied meaning
Technique 4: Entity-Specific Sentiment
Not just "is this positive?" but "is this positive for NASDAQ:AAPL ?"
Same headline can be:
Positive for one company
Negative for competitor
Neutral for market
Sentiment Analysis Pitfalls
Lagging Indicator — By the time sentiment is measurably extreme, the move may be mostly done. Focus on rate of change, not absolute level.
Noise in Social Media — Bots, spam, and coordinated campaigns distort readings. Filter sources, weight by credibility.
Sarcasm and Context — "Great, another crash" — is this positive or negative? Use advanced NLP models.
Self-Fulfilling Prophecy — If everyone uses the same sentiment indicator, it stops working. Combine with other analysis.
Different Timeframes — Social media sentiment changes hourly. Fundamental sentiment changes monthly. Match to your trading timeframe.
Building a Sentiment Dashboard
Components:
Overall Market Sentiment — Fear & Greed Index or equivalent, historical percentile ranking
Asset-Specific Sentiment — News sentiment for your watchlist, social media buzz and tone
Sentiment Momentum — Is sentiment improving or deteriorating? Rate of change indicators
Divergence Alerts — Price up, sentiment down (warning); Price down, sentiment up (opportunity?)
Extreme Readings — Historical extreme alerts, percentile rankings
Practical Implementation
For Beginners:
Use existing sentiment indicators (Fear & Greed Index)
Monitor social media manually for your assets
Note sentiment in your trading journal
For Intermediate:
Subscribe to sentiment data feeds
Build simple sentiment tracking spreadsheets
Backtest sentiment signals
For Advanced:
Build custom NLP pipelines
Train asset-specific sentiment models
Integrate real-time sentiment into trading systems
Sentiment Case Studies
Case 1: COVID Crash (March 2020)
Fear reached historic extremes
Social media was apocalyptic
Contrarian buyers were rewarded massively
Case 2: Meme Stock Mania (2021)
Social media sentiment exploded
Greed indicators maxed out
Late buyers suffered significant losses
Case 3: Crypto Winter (2022)
Sentiment collapsed to extreme fear
"Crypto is dead" headlines dominated
Marked significant accumulation zone
Key Takeaways
Sentiment analysis quantifies market emotion using AI and NLP
Extreme sentiment readings often precede reversals
Multiple sentiment sources (news, social, options) provide fuller picture
Sentiment works best as confirmation or at extremes, not as standalone signal
Modern AI can understand context, sarcasm, and nuance in text
Your Turn
Do you currently track market sentiment in your trading?
What sources do you find most useful for gauging market mood?
Share your approach below 👇
Sentimentalanalysis

Oil Target 62$: Sentiment Shifts Amid Geopolitical TensionsWe’re in a non-standard situation for oil markets — with the White House now openly threatening military action against Venezuela.
This dramatically increases the value of oil options sentiment.
You don’t need to be a PhD in geopolitics to understand:
A military operation = major supply disruption risk = price volatility on steroids.
And the market is already pricing it in.
Over the last two days, key levels like 58–60–72 have started appearing more and more in CME options flow — clear signs of positioning for extreme moves.
But here’s what matters most:
The trades that were placed before the Venezuela news broke.
That’s where we focus.
And if I had to summarize:
Two days ago, some guys were actively building spreads targeting 60–62 — betting on a pullback.
📌 Why?
These spreads are aggressive — they can generate 2x–3x returns from just a $2–$3 move, even if price doesn’t fully reach the target.
In short:
They’re not waiting for perfection.
They’re ready for explosion.
🔥 Final Take:
Yes, the option market has been extremely active over the past 48 hours — one of the busiest periods lately.
But beyond the noise, there’s a growing signal:
Oil is primed to explode.
And this "Venezuela narrative"?
It’s looking less like talk — and more like a setup for real movement. Big money is involved
The main question: will it explode before or after the New Year?

CHFJPY ShortWith the Bank of Japan rate decision approaching, markets are pricing in a shift toward tighter policy, supporting a stronger JPY. At the same time, year-end capital repatriation flows into Japan increase demand for the yen. As risk appetite cools, the defensive appeal of CHF weakens relative to JPY, creating sustained downside pressure on CHFJPY.

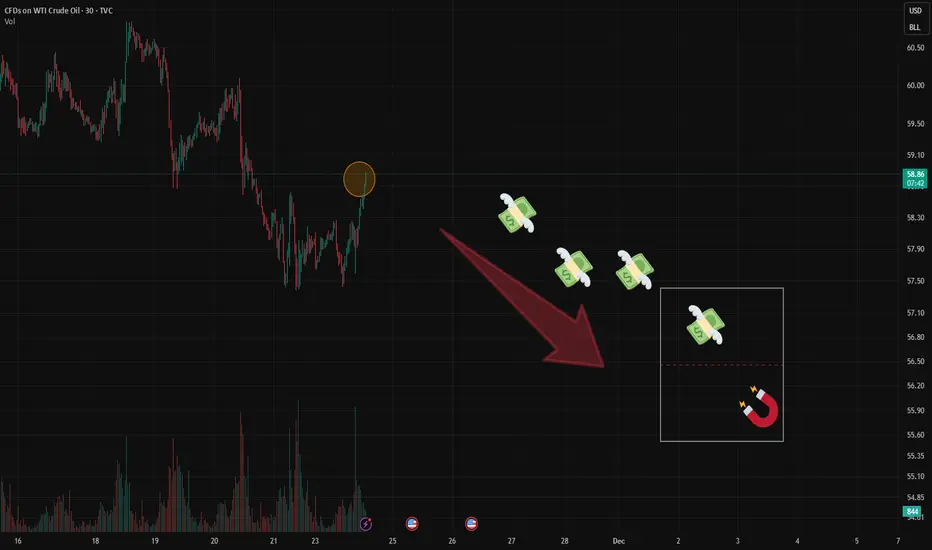
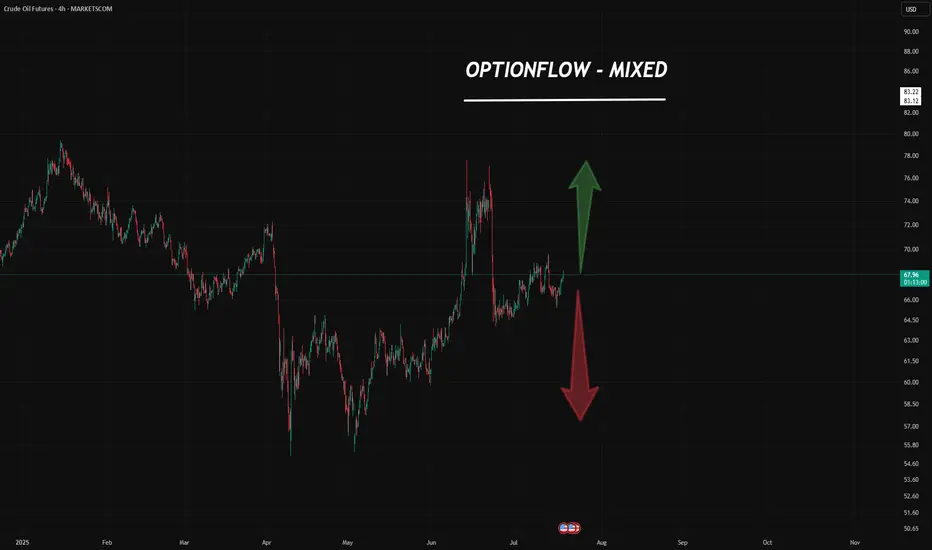
Oil Upd:Price at Resistance–But the Real Story Is in OptionFlowRight now, price has reached the upper boundary of the 1σ Expected Range (ER).
A pause or rejection here is possible.
But that’s not the main story.
Bears are getting active in the options market.
First sign: A significant Put Condor has appeared — large enough to stand out.
Target range: $55–$57
Timeframe: 20 days to expiry
📌 For those still learning:
A Condor profits most when price stays within a tight range at expiry.
Second wave of bearish positioning:
Additional players are placing Put Spreads targeting $54–$55, but with a much shorter horizon — 5–7 days.
This shows a layered approach:
Short and mid- term pressure expected
🧠 Bottom Line:
I’m not jumping into shorts right now — and I wouldn’t advise it blindly.
But given this growing bearish sentiment, it’s smart to start looking for short setups
Sentiment is building.
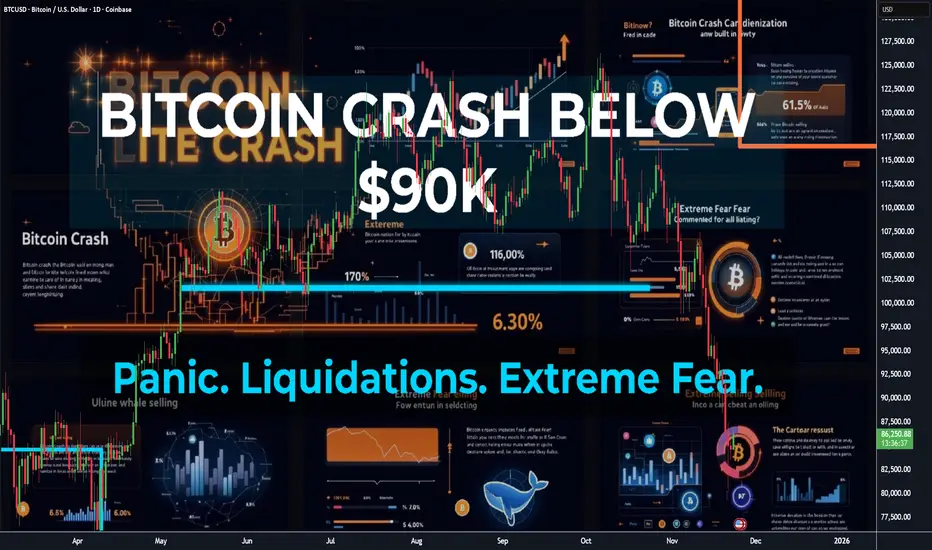
Bitcoin's Death Cross is Here: A crash with a message for all!Bitcoin has just delivered one of its most significant reality ✔ checks of the year — the recent crash wasn’t simply a dip; it was a multi-layered market unwind that exposes the current fragility of the crypto ecosystem.
📉 Current Bitcoin Situation: “From Euphoria to Uncertainty”
Bitcoin’s trend shifted rapidly over the past few weeks.
Spot ETFs that once fueled relentless upside have significantly slowed inflows, with some days printing net outflows as retail enthusiasm cooled and institutions trimmed exposure.
Meanwhile:
Over billions in long liquidations hit in some days.
Funding flipped aggressively negative
Sentiment turned from greed → hesitation
High beta alts saw steeper collapses, showing risk-off behavior
This wasn’t random volatility — it was a controlled flush triggered by structural weakness.
🔥 Why Bitcoin Crashed: The Real Story
🔹 Technical Factors
BTC lost a major support cluster after multiple failed attempts to hold the mid-range.
Open interest was overheated, creating the perfect setup for a liquidation cascade.
Price rejected sharply from a supply zone that aligns with the weekly imbalance.
☠️ Death Cross on Daily Time Frame: Now Confirmed
The 50 SMA crossing below the 200 SMA is not a “doom event” by itself…
But historically, Bitcoin rarely ignores this signal, especially when paired with weakening momentum and fading liquidity.
⚠ The last major Death Cross?
2022’s brutal bear continuation, which led to several months of grinding downside before any meaningful reversal.
The current structure looks uncomfortably similar:
Lower highs printing consistently
Loss of trend strength
Distribution patterns on higher time frames
Declining demand from smart money inflows
This isn’t fearmongering — it’s observation.
🔹 Fundamental + Macro Factors
ETF inflow cooldown = reduced demand pressure
Miners started selling into strength to stabilize income post-difficulty adjustment
Global markets leaned risk-off due to macro tightening
Whales began distributing quietly (confirmed by on-chain inflow spikes into exchanges)
When technical fragility meets fundamental slowdown, crashes are not accidents — they’re consequences.
🐋 Whales Are Selling: “When the quiet money moves, the market reacts loud.”
On-chain data over the last week showed:
Increase in exchange inflows from large wallets
Spot distribution from old long-term holders
ETF issuers are reducing inventory during downswings
This behavior is classic:
Whales distribute during periods of retail excitement…
Retail panics during whale exits…
And the crash becomes a self-fulfilling cycle.
📅 4–6 Week Forecast: “Chop, Pain & Opportunity”
Over the next month or so, the market will likely experience:
Sideways-to-down structure
Failed rally attempts near the 50 SMA
Whip-saw price action due to low conviction
Accumulation pockets are forming quietly
BTC needs to reclaim the 50 SMA with strength before a clean trend resumes.
Until then, volatility ≠ strength.
🎯 Conclusion: Re-Investment Zones & Smart Accumulation
Crashes are emotional for most, but strategic for the prepared.
This is not a call to rush.
It’s a reminder:
Smart money enters when sentiment collapses.
Dumb money enters when sentiment peaks.
Analyze. Prepare. Don’t chase.
🧩 Comment down below 👇 and let’s talk about how to overcome it — build awareness together as traders, not competitors.
If this Idea gave you valuable information, then please boost it, and follow for more practical trading!
Happy Trading & Investing!
Team @TradeWithKeshhav
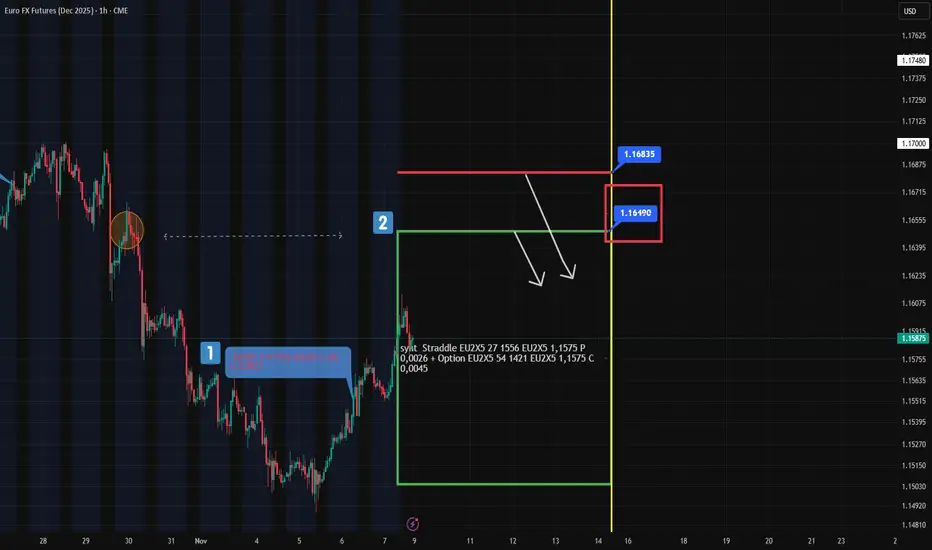
Euro Sentiment: What’s Ahead in the Next Few DaysRetail positioning tells a clear story:
70% short / 30% long on EUR/USD
→ That’s a textbook setup for a long .
The crowd is bearish — but structure favors bulls.
From a technical standpoint, we’re seeing a solid corrective move up from 1.15, with even a mini-higher high – higher low pattern forming — yes, like the ones in classic TA textbooks.
It looks not just logical… but inviting.
Now let’s look at the options market:
There’s real bullish momentum building:
1. Naked calls being bought
2. Call spreads actively traded
My focus is on two key structures:
First, the call at 1.165, entered on November 6 — now already in the money (#1 at chart)
Friday’s straddle at 1.1575 — its upper boundary aligns perfectly with the trigger level from October 29 (#2 at chart)
🎯 Confluence? Yes.
🔍 Putting It All Together:
We have fuel for further upside in EUR:
Retail overcrowded short
Technical structure improving
Options flow turning bullish
But resistance looms ahead:
1.1649 and up to 1.1683 (futures prices) are strong zones
These levels could cap the upside move and offer high-probability short setups
👉 In particular, 1.1649 stands out as an ideal zone to consider a short.
On Monday, I’ll calculate the Expected Range (ER) levels — and if it aligns with this resistance, I’ll definitely place a limit order here.
Not using ER levels yet?
Spend one minute learning them — and gain the edge most traders overlook.
What Bitcoin Options on CME Are Whispering Right Now
A quick look at the flow — and it’s clear:
the market is pricing in a move toward $145K–$150K.
But here’s the nuance:
nearly all these call spreads come with a hedge — a short futures leg added right away.
This isn’t pure bullish speculation.
It’s a structured play.
🔍 The Logic Behind It:
Primary goal: Profit from upside as BTC rallies.
But also prepared for downside:
These portfolios assume a potential drop to $103K, and in some cases even $101K — which are the break-even points of the structures.
At those levels:
The short futures can be bought back for profit (closing the hedge)
Or the entire position can be closed out entirely, if sentiment shifts dramatically
In other words — they’re bullish, but not blind.
They want exposure to upside…
while keeping an exit ramp ready if things go south.

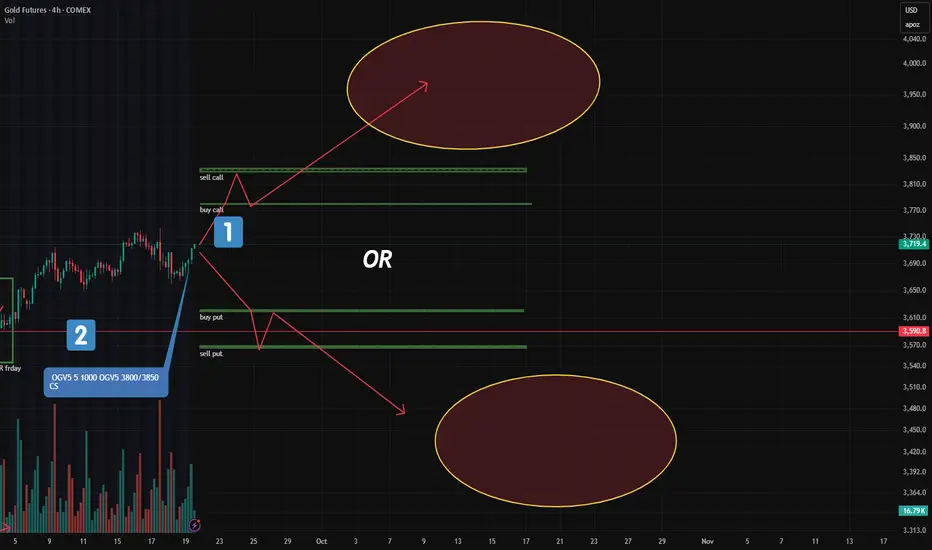
Gold’s outlook after Friday’s newsA question came in on TradingView about gold’s outlook after Friday’s news.
My analysis methodology is built on a holistic review of exchange data, where options flow plays a central role — something long-time followers of my posts are already familiar with.
So here’s what Friday’s options flow is quietly telling us:
🔸 The bearish put spread (on November option series ) targeting lower levels from October 8th onward is still intact — suggesting downside sentiment remains in play.
Now, let’s be realistic:
Sophisticated players can always flip this position mid-flight by adding futures to hedge — turning it into a neutral or even bullish setup if the rally continues.
After all, we’re dealing with pros with deep pockets — and they don’t like losing money.
They’ll adjust. They’ll hedge. They’ll exit clean.
🔸 Second, Friday’s CME activity leaned bearish (screen attached)— or at least, profit-taking (fixing).
We see call strikes above current price either being closed or re-sold.
Volume is present — but open interest is flat, declining, or even negative.
That tells a story:
No new conviction for higher prices.
Just closing old upside bets.
📌 Bottom line:
The flow doesn't scream "crash coming right now" — but it does whisper:
"Be careful with the longs."

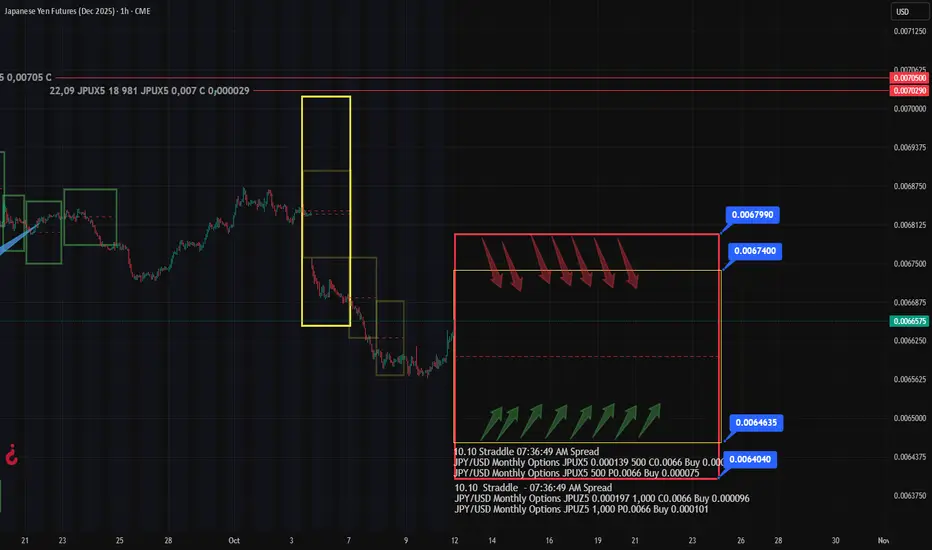
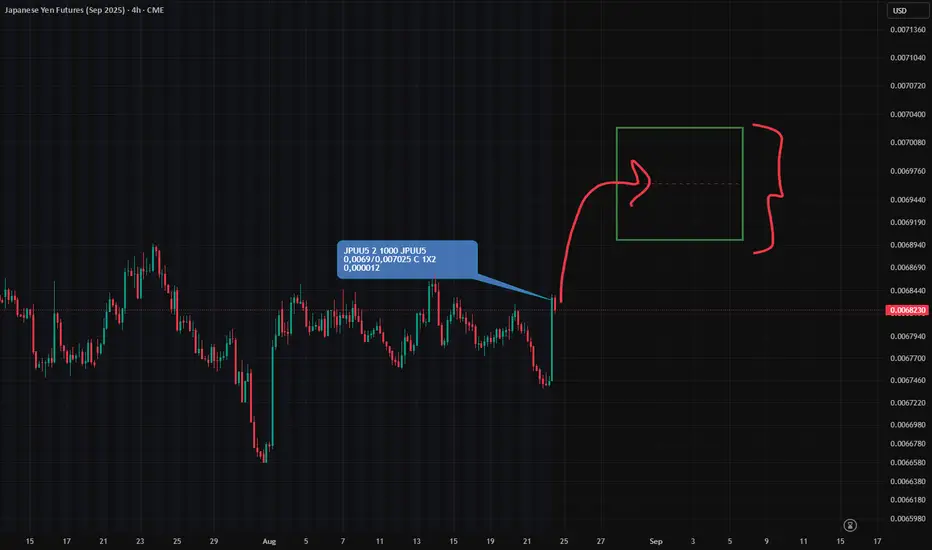
JPY Analysis & Outlook: Friday’s Options Flow Tells the StoryFriday’s trading on the options market revealed two key developments in JPY:
🔸 Two Straddles appeared in the current front-month expiry series
Plus a mid-sized Call Spread near 0.00675
Upper boundaries: 0.00674 and 0.006799 (marked on chart)
🔍 Key Takeaways:
Option traders are positioning likely for a correction in JPY futures after last week’s sharp drop.
But, Straddle isn’t a directional bet — it’s a volatility play with structure.
Call Spread is a a directional bet
As usual, when price approaches either Straddle boundary, option players will likely convert positions into synthetic calls or puts, reinforcing these levels as BE zones.
🎯 Strategic Levels:
0.00674 – 0.006799 → Potential resistance zone in the medium term
But here’s what’s interesting:
If you apply a Fibonacci retracement tool, the 61.8% level aligns almost perfectly with one of the already marked Straddle levels.
That kind of confluence?
It could attract additional downside liquidity from traders using Fib grids — especially those selling into "expected" reversal zones.
Is it a coincidence?
Sure, probably 😉
#GOLD WILL THE correction continue ATHResistance level:3760-3776-3791
Support levels:3752-3741-3731i expect a pullback 3737-3717 and if the bulls return the price to 3800.
my forecast on #gold is 3880.
By; Honey-trading!

Gold: Major New Option Portfolios Signal Strong Moves AheadFriday’s CME report showed a surge in large option blocks in gold — two of them stand out.
🔹 1. "Long Condor" on December Futures (GCZ24)
This is the most significant structure added:
Targets a move below $3,620 or above $3,780
In other words: a breakout is expected, not consolidation
📌 Key point:
A "Long Condor" profits from volatility, not direction.
It wins if price moves sharply — up OR down — but loses if it stays flat.
💡 My note:
When I first encountered delta-neutral strategies like this as a Forex trader — my brain exploded.
No directional bias… yet clearly positioned for action?
That was the moment I realized: options are a different game.
🔹 2. Bull Call Spread (Oct Series): $3800–$3850
Another key play:
A classic bullish call spread at 3800/3850
Target: upside beyond current levels
But here’s the difference:
Unlike the "Long Condor", this one needs a clear upward move — and soon. Within a few days.
This isn’t about volatility.
It’s a directional bet that gold will rise.
🧠 Bottom Line:
One portfolio says: "Breakout coming — no matter which way."
Another says: "Gold goes up — and soon."
Are they aligned?
Contradictory?
Or could both win?
Trade smarter, not harder! Looking to boost your profits with valuable market insights and data-driven entry points? Join us or keep moving!
"Aha!" Moments Are Dangerous — Here’s Why You Shouldn’t Panic Just because a big options trade appears — doesn’t mean it’s a signal.
Options move every day.
Some trades are:
-Speculative
-Hedging plays
-Pure lottery tickets
Only a few carry real directional sentiment.
And learning to separate noise from signal?
That’s one of the most powerful skills a trader can develop — even if you never trade options yourself.
Let’s Look at JPY (See Chart)
On September 5, two large put portfolios appeared:
1. 0.0064 Put
2. 0.00635 Put
Both new, both with no prior open interest — so not a roll.
And yes — they’re larger than average.
To a beginner, this screams:
“JPY is going to crash — time to short everything!”
But let’s pause.
An experienced flow analyst would ask:
Is this really a bearish signal?
🔍 Here’s What the Data Says:
❗️Size ≠ Significance
Yes, the portfolios are big — but each costs ~$90K.
In institutional terms? Not massive.
❗️Delta is ~2%
That means less than 2% chance of expiring in the money.
❗️This Happens Often in JPY
Same strike (0.0064), same structure — appeared in the previous series.
Price never went near it.
No crash. No panic.
Just… nothing.
🧠 So Why Buy It?
I don’t know.
And I don’t need to.
Could be:
1️⃣A hedge for a larger book
2️⃣A counterparty agreement
3️⃣A some extra aggressive logic
But here’s what I do know:
Based on years of CME data and personal tracking —
Trades like this don’t cause market crashes.
They don’t move the needle.
They don’t change the trend.
✅ Final Takeaway:
Don’t react to the data headline.
Ask:
How likely is this to matter?
Is it priced in?
Has this happened before? Price reaction after big OTM options?
Because real edge isn’t in the "Aha!" moment —
It’s in the "Wait, let me check…" moment.

So, the market will never fall ever again ?Sentiment in the market is max bullish right now, which has historically been a very good time to be bearish.

Just Because It’s Big Doesn’t Mean It’s SmartJPY Call Spread Breakdown: Bullish Signal — Or Just Obvious FOMO?
A new vertical call spread appeared in JPY options yesterday (per CME Globex data):
Long 0.0069 Call
Short 0.007025 Call
🎯 Target: 0.007025 — upside continuation play.
Open interest increased at both strikes → new position, not a roll.
Size? Relatively large for JPY (based on systematic observations).
⏰ When Was It Opened?
9:45 AM CT — after yesterday’s sharp rally in JPY futures.
In fact — right at the top of the move.
📌 Not before the move.
But after the impulse, on momentum.
🔍 Combining Flow + Chart Context:
Price had already spiked up.
The spread bets on further upside .
🧠 Key Takeaways:
✅ Sentiment: Bullish
❌ Predictive value: Low — nearly zero
Why?
The setup is too obvious.
No evidence of insider-like timing.
If this had been placed before the move — yes, it would matter.
But opening at the peak? That’s not edge — it’s FOMO dressed as strategy.
🚫 Will I go long JPY futures based on this?
No.
Not because I doubt the move.
But because this isn’t smart money behavior — it’s trend-chasing.
🎯 Final Lesson:
Not every large options trade is a signal.
Always ask:
When was it placed?
Why here?
Who’s behind it?
🔍 True edge isn’t in the trade itself — it’s in the context around it.
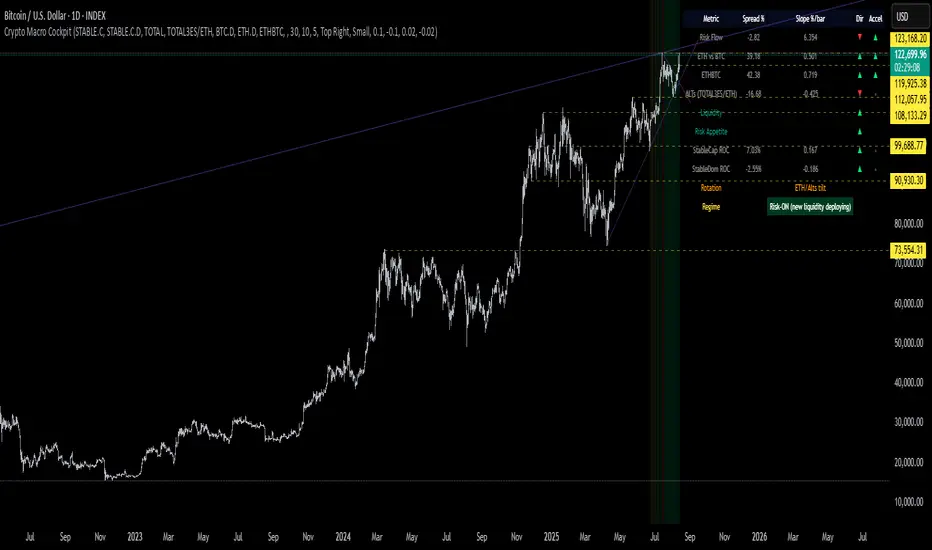
Crypto Macro Cockpit: Risk-ON Regime ConfirmedThis chart presents a live macro overlay for crypto markets using the new Crypto Macro Cockpit, a Pine Script-based dashboard that blends traditional flow metrics with institutional-era proxies.
We're currently reading a Risk-ON regime as fresh liquidity deploys into the system—confirmed across stablecoin metrics and sector rotation.
🔍 Key Insights
Risk Flow: Stablecoin cap is rising slower than total market cap → suggests active deployment (Risk-ON)
Liquidity Context: StableCap ROC at +7%, confirming real dry powder growth
Rotation: ETH vs BTC and ETHBTC both accelerating upward → ETH/Alts tilt
TOTAL3ES/ETH ratio: Softening short-term → confirms engineered altseason with ETH as the core liquidity channel
Macro Regime: Risk-ON (new liquidity deploying)
🧠 Thesis
This aligns with the Trojan Cycle thesis:
Institutional liquidity enters through safe, regulated channels (e.g. stablecoins), while synthetic altseasons are engineered to engage and extract liquidity from retail participants.
Legacy macro tools like M2 are no longer as effective. In today’s structure, stablecoin metrics offer real-time, blockchain-native liquidity signals.
- Stablecoin Market Cap reflects actual capital inflow (dry powder entering)
- Stablecoin Dominance proxies sentiment: declining = risk-on, rising = risk-off
- Their spread vs Total Market Cap reveals whether capital is being deployed or parked
As institutions and ETFs reshape market dynamics, this cockpit adapts.
M2 is out. Stablecoins are in.
⚠️ Disclaimer
This is not financial advice.
This script and dashboard are informational tools meant to support macro-level context and regime awareness—not trade signals.
Always do your own research.
DXY USDOLLAR CRASH Incoming!Long-term fundamentals are bearish
Long-term sentiment = bearish
Long-term technicals = bearish
Trump wants a weaker dollar + FED injecting endless amounts of cash into the markets
driving stocks/ gold up, and the dollar down, losing purchasing power.
My plan is to look for shorts on the 1hr-4hr timeframe with lower timeframe confirmation.
Once price starts turning over, day-traders can join in.
Agree or disagree?

Australian dollar rose 0.8% but there is a "Wall" of naked callsAustralian dollar is up 0.8% in 24h — and almost eyeing the 0.66–0.665 zone .
That’s exactly where we’ve been seeing a systematic build-up of naked calls on the futures.
More “bricks” added to the wall yesterday.
Early, looking at the CME data , there’s been a meaningful inflow in deep-out-of-the-money call options at the 0.665 strike . And this has been happening for several days for now
We can’t say it’s one single player — CME reports don’t show that.
But the pattern is too consistent to ignore.
🧠 Why it matters:
As I’ve said before — these long call stacks can easily turn into zero-cost put spreads by selling futures at those levels.
🎯 Bottom line:
Seems the market isn’t betting on a rally in long term.
It’s preparing to defend the range .
Strategy: open shorts at "build-up" resistance zone

Crude Oil: Bulls vs. Bears — A Market at the Edge
Here’s what we’re seeing from the latest CME block trade data & CME report:
🐻 Confirmed & Detailed Bearish Sentiment
Big players are actively hedging and betting on a drop.
Block trades are targeting key downside levels:
$62.50 , $55.00 , and even as low as $45.00 .
This isn’t noise — it’s institutional conviction.
🐂 Strong Bullish Resistance
At the same time, there’s heavy buying in:
Long futures
Bullish call spreads (1,000+ contracts)
This tells us: there are serious buyers stepping in, targeting $67.50–$72.50 .
They don’t believe in the bear case — and they’re backing it with real money.
🧭 Market at a Bifurcation Point
The presence of massive, conflicting block trades is a clear sign:
The market is preparing for a big move — up or down.
“Smart money” isn’t betting on sideways action.
They’re positioning for breakout volatility .
📊 Final Forecast
Oil is under strong bearish pressure.
That makes a downward scenario more likely in the medium term .
BUT — there’s strong support from big buyers stepping in around $64–$65 .
So the most probable path?
A high-volatility phase , with attempts to test both:
Upper targets (bullish side)
Lower support zones (bearish side)
🔑 Key Battle Zone: $62 – $68
This range will be critical in the days ahead.
Break it — and we’ll know which side is in control.
Still looking to sell on rallies — nothing’s changedStill looking to sell on rallies — nothing’s changed. The level on the chart? That’s where buyers jumped in before. Makes sense to target it again.
So… why do we say there are "suffering buyers" at this level?
Let’s rewind a bit (see Chart #2) and imagine price at the point marked on the chart.
At that moment, price had clearly returned to a visible local level — 0.8123 — a zone that naturally attracted traders to jump in on the fly , or triggered limit orders .
But here’s what happened next:
Selling pressure overpowered buying interest — and price moved swiftly lower .
That’s when those buyers got caught.
That’s when the pain started.
🔍 What Makes This Level Special?
Broker data from open sources confirms that open positions are still sitting at this level — meaning a lot of traders are underwater, hoping for a recovery that may never come.
It’s not just technical structure.
It’s crowded sentiment , failed expectations , and trapped capital — all wrapped into one.
🧠 This is what we call a "suffering trader" zone — and it often becomes a magnet for future selling .
📌 Follow along for more breakdowns on flow, positioning, and market sentiment .
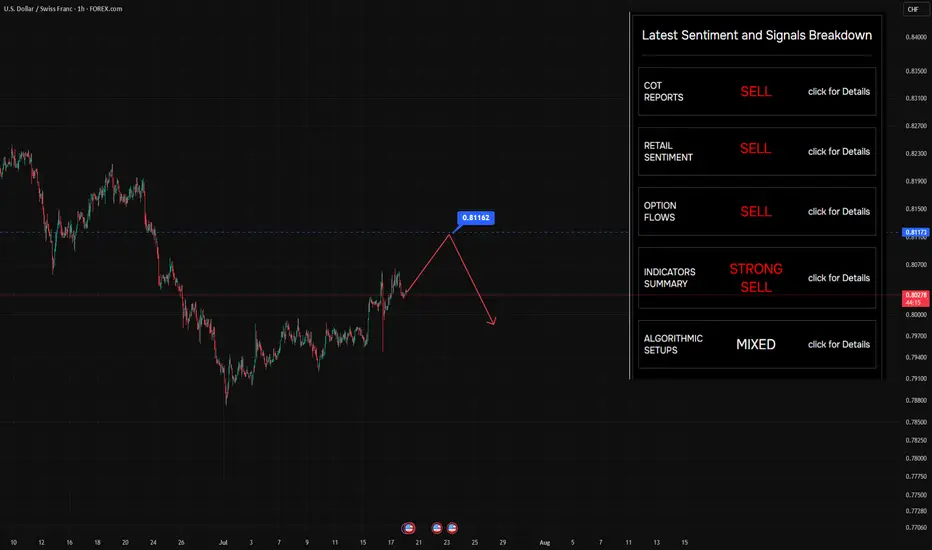
USD/CHF Weakness Alert: Retail Bulls vs. Smart Money FlowHere’s the latest aggregated data on the pair:
📊 4 out of 5 indicators suggest potential for further downside.
Sentiment - Bearish!
A quick note on sentiment in the table:
✅ It’s structured hierarchically — from the broadest view (COT reports) to specific entry points (algorithmic setups).
So, Retail traders are massively long USD/CHF — over 80% still buying , expecting strength.
But here’s the problem: the options flow tells a different story .
Looking at recent data from CME , we’re seeing fresh calls buying and growing open interest at key strikes upper current Swiss futures price — a sign that option traders are preparing for strong CHF
💡 Use this data in your trading OR quick check for market conditions at glance!
🎯 No Valuable Data, No Edge!

Gold new ATH soon?🟡 GOLD LONG SETUP: Buying the Fear at Key Support 📈
ICMARKETS:XAUUSD
"Be fearful when others are greedy, and greedy when others are fearful" - Warren Buffett
The oscillator we developed is showing some compelling signals on gold right now, and the market sentiment couldn't be more perfect for a contrarian play. 💎
Technical Analysis:
Our custom oscillator is painting a clear picture at the bottom - we're seeing those beautiful green zones emerging after extended red periods
Price action has found solid support around the 3,300 level, creating a strong foundation for the next leg up
The fear in the market is palpable, which historically has been an excellent buying opportunity for precious metals
Volume profile suggests accumulation is happening at these levels
Why This Setup Works: 🎯
The beauty of this oscillator lies in its ability to identify when institutional money starts flowing back into gold during periods of maximum pessimism. When retail traders are panicking and selling, smart money is quietly accumulating.
Key levels to watch:
• Support: 3,300 (current zone)
• First target: 3,350
• Extended target: 3,400+
Risk Management: ⚠️
• Stop loss below 3,275
• Position sizing: Never risk more than 2% of account
• Trail stops as momentum builds
The oscillator's fear signals have been remarkably accurate in identifying these reversal points. When fear reaches extremes, that's typically when the best opportunities present themselves.
This is not financial advice - always do your own research and manage risk appropriately.
What are your thoughts on this setup? Are you seeing similar signals on your charts? 🤔
#Gold #XAUUSD #TechnicalAnalysis #BuyTheFear #Oscillator

Quietly Building: A Major Options Position in August AUDEye-catching activity in August AUD options with a strike at 0.67 .
The break-even point for this portfolio sits slightly higher, at 0.674 — and judging by open interest, this is the largest position in play.
Quick reminder:
A break-even level like this could act as a synthetic put building zone by adding short futures to their positions. That means profit from downside moves — with limited risk .
But here’s the catch:
This setup alone doesn’t scream “buy” or suggest strong bullish conviction toward 0.674.
However, it’s definitely worth watching — especially if price starts moving in that direction.
Also keep an eye on option unwinds or roll-overs — they often tell us more about how big players see the future path of the asset.
📈 Bottom line:
Not a clear signal yet — but definitely a pattern forming. Stay tuned.
Follow for more edge-driven breakdowns!

CAD Option Flow Positive Sentiment. It's worth taking a closer Based on the analysis of yesterday's trading on CME, we have captured an excellent portfolio in the lens.
The trader methodically formed this position in a 5-minute period of time, which is a good sign.
Сonfirmation - the market is already moving in his direction
But, reasonable entry level - above 0.7339.
Don't rush it. The risk/profit ratio is still at acceptable levels, but it's worth waiting for the resistance to be overcome.
