KRBN - Clear resistance for a potential short🔱 The multiple struggle at the Centerline gives us a hint for a potential short. 🔱
The thin slanted support needs to be broken and only then can we consider a move to the downside.
The L-MLH is my first PTG and the red Centerline my second.
Wish you all a happy new week and don't forget to watch my 👉 Weekly Trading Watchlist.
Setup

OG/USDT Analysis. Long Setup
On this asset, we’ve detected a large number of volume anomalies, which suggests strong accumulation by a major player. Additionally, there’s a structural breakout on the chart, and above the current price, we can see a volume gap, creating potential for upward movement.
In the order book, below $10.8, there are limit buy orders totaling around $1.7 million, which is a significant volume for this coin.
We’re considering a long position from current levels or after a false breakout of $10.5, where the first signs of abnormal activity appeared.
Growth target: $12.7.
This publication is not financial advice.

EURAUD to find buyers at current market price?EURAUD - 24 expiry
The selloff is close to an exhaustion count on the intraday chart.
We expect a reversal in this move.
Risk/Reward would be poor to call a buy from current levels.
A move through 1.7775 will confirm the bullish momentum.
The measured move target is 1.7875.
We look to Buy at 1.7700 (stop at 1.7625)
Our profit targets will be 1.7850 and 1.7875
Resistance: 1.7800 / 1.7850 / 1.7875
Support: 1.7750 / 1.7700 / 1.7650
Risk Disclaimer
The trade ideas beyond this page are for informational purposes only and do not constitute investment advice or a solicitation to trade. This information is provided by Signal Centre, a third-party unaffiliated with OANDA, and is intended for general circulation only. OANDA does not guarantee the accuracy of this information and assumes no responsibilities for the information provided by the third party. The information does not take into account the specific investment objectives, financial situation, or particular needs of any particular person. You should take into account your specific investment objectives, financial situation, and particular needs before making a commitment to trade, including seeking, under a separate engagement, as you deem fit.
You accept that you assume all risks in independently viewing the contents and selecting a chosen strategy.
Where the research is distributed in Singapore to a person who is not an Accredited Investor, Expert Investor or an Institutional Investor, Oanda Asia Pacific Pte Ltd (“OAP“) accepts legal responsibility for the contents of the report to such persons only to the extent required by law. Singapore customers should contact OAP at 6579 8289 for matters arising from, or in connection with, the information/research distributed.

NZDUSD forming a bottom?NZDUSD - 24h expiry
Price action looks to be forming a bottom.
We expect a reversal in this move.
Risk/Reward would be poor to call a buy from current levels.
A move through 0.5775 will confirm the bullish momentum.
The measured move target is 0.5850.
We look to Buy at 0.5750 (stop at 0.5720)
Our profit targets will be 0.5825 and 0.5850
Resistance: 0.5775 / 0.5800 / 0.5825
Support: 0.5750 / 0.5725 / 0.5700
Risk Disclaimer
The trade ideas beyond this page are for informational purposes only and do not constitute investment advice or a solicitation to trade. This information is provided by Signal Centre, a third-party unaffiliated with OANDA, and is intended for general circulation only. OANDA does not guarantee the accuracy of this information and assumes no responsibilities for the information provided by the third party. The information does not take into account the specific investment objectives, financial situation, or particular needs of any particular person. You should take into account your specific investment objectives, financial situation, and particular needs before making a commitment to trade, including seeking, under a separate engagement, as you deem fit.
You accept that you assume all risks in independently viewing the contents and selecting a chosen strategy.
Where the research is distributed in Singapore to a person who is not an Accredited Investor, Expert Investor or an Institutional Investor, Oanda Asia Pacific Pte Ltd (“OAP“) accepts legal responsibility for the contents of the report to such persons only to the extent required by law. Singapore customers should contact OAP at 6579 8289 for matters arising from, or in connection with, the information/research distributed.

GBPJPY's Reversal BaseHi Traders!
When looking at GJ, the chart seemed messy as it was in a range for a long time. After finally breaking out of the 200s, priced reach a Weekly OB area in the 203s.
Over the past weeks or so, GJ created a counter trend dipping back into the high 200s area with what it appears to be a reversal base. If this reversal is true, I would be planning swinging this trade into the next resistance areas around 206-207. That will bring price to a previous Monthly Bearish OB.
Despite of how the chart has looked, the trend remained bullish. Therefore, IMO, GJ seems to want to keep its bullish momentum.
Good luck to everyone!
*DISCLAIMER: I am not a financial advisor. The ideas and trades I take on my page are for educational and entertainment purposes only. I'm just showing you guys how I trade. Remember, trading of any kind involves risk. Your investments are solely your responsibility and not mine.*

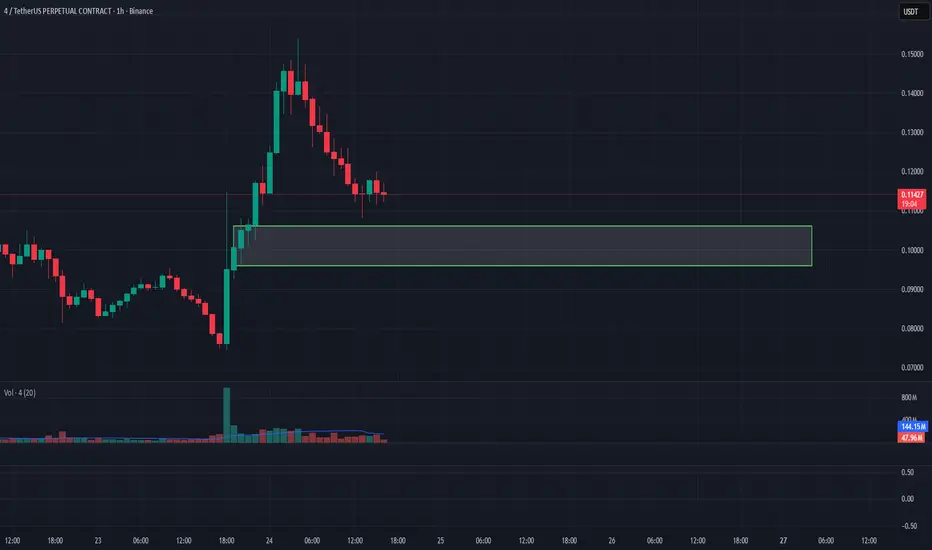
4/USDT Analysis. Long Setup
For this asset, we’ve noticed strong buyer activity, while during the pullback volumes are almost absent, suggesting a momentum-based decline rather than active selling.
Below the current price lies a strong volume zone at $0.106–$0.096 — a bullish reaction from this area could trigger a long setup with an initial target at $0.16.
This publication is not financial advice.
The Best DEX & Token PotentialAVNT #LONG
Potential for 130% growth .
You can go long on spot or with a small leverage.
Token from a DEX, the exchange is good , the drop was awesome , staking their token with a good interest rate is available, the team's cliff is long, so there is an incentive to push the price up .

NZDJPY to stall at earlier swing high?NZDJPY - 24h expiry
Selling posted close to the previous high of 88.58.
88.13 has been pivotal.
Early optimism is likely to lead to gains although extended attempts higher are expected to fail.
Expect trading to remain mixed and volatile.
Preferred trade is to sell into rallies.
We look to Sell at 88.32 (stop at 88.76)
Our profit targets will be 87.01 and 86.81
Resistance: 88.06 / 88.30 / 88.58
Support: 87.60 / 87.30 / 86.96

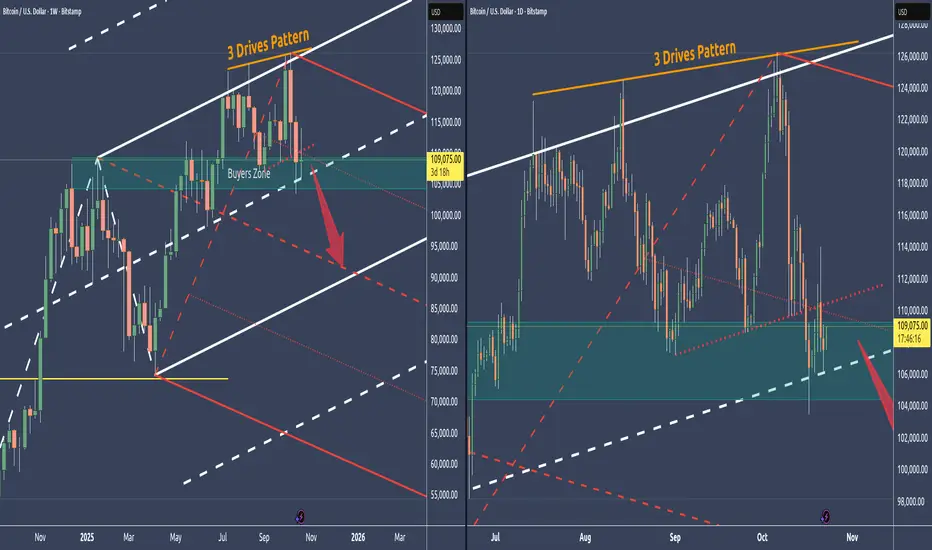
Bitcoin - We've reached the last line of support🔱 The Buyers’ Zone represents the last major support before price potentially drops toward the red centerline. 🔱
👉 The 3-Drives pattern, signaling exhaustion in the current move.
👉 Broader markets are highly stretched; a broader trend reversal would likely pull Bitcoin down with it.
👉 The slanted support line in the dayli chart is now resistance that could not be washed away.
Given these conditions, there’s a strong possibility that this final support zone won’t hold, leading to a deeper flush.
For targets I see the red Centerline, and even the L-MLH, which gives us a natural support.
Stay sharp and trade safe—wishing you a profitable week ahead
China50 to continue in the upward move?CHN50 - 24h expiry
Daily signals are bullish.
20 1day EMA is at 15033.
Intraday dips continue to attract buyers and there is no clear indication that this sequence for trading is coming to an end.
Dips continue to attract buyers.
We look for a temporary move lower.
Risk/Reward would be poor to call a buy from current levels.
We look to Buy at 15055 (stop at 14898)
Our profit targets will be 15505 and 15585
Resistance: 15339 / 15400 / 15500
Support: 15150 / 15000 / 14827
Risk Disclaimer
The trade ideas beyond this page are for informational purposes only and do not constitute investment advice or a solicitation to trade. This information is provided by Signal Centre, a third-party unaffiliated with OANDA, and is intended for general circulation only. OANDA does not guarantee the accuracy of this information and assumes no responsibilities for the information provided by the third party. The information does not take into account the specific investment objectives, financial situation, or particular needs of any particular person. You should take into account your specific investment objectives, financial situation, and particular needs before making a commitment to trade, including seeking, under a separate engagement, as you deem fit.
You accept that you assume all risks in independently viewing the contents and selecting a chosen strategy.
Where the research is distributed in Singapore to a person who is not an Accredited Investor, Expert Investor or an Institutional Investor, Oanda Asia Pacific Pte Ltd (“OAP“) accepts legal responsibility for the contents of the report to such persons only to the extent required by law. Singapore customers should contact OAP at 6579 8289 for matters arising from, or in connection with, the information/research distributed.

GBPAUD to find buyers at current market price?GBPAUD - 24h expiry
Our short term bias remains positive.
50 4hour EMA is at 2.0572.
Offers ample risk/reward to buy at the market.
Our short term bias remains positive.
Prices have reacted from 2.0244.
We look to Buy at 2.0575 (stop at 2.0505)
Our profit targets will be 2.0784 and 2.0824
Resistance: 2.0665 / 2.0697 / 2.0785
Support: 2.0559 / 2.0459 / 2.0425
Risk Disclaimer
The trade ideas beyond this page are for informational purposes only and do not constitute investment advice or a solicitation to trade. This information is provided by Signal Centre, a third-party unaffiliated with OANDA, and is intended for general circulation only. OANDA does not guarantee the accuracy of this information and assumes no responsibilities for the information provided by the third party. The information does not take into account the specific investment objectives, financial situation, or particular needs of any particular person. You should take into account your specific investment objectives, financial situation, and particular needs before making a commitment to trade, including seeking, under a separate engagement, as you deem fit.
You accept that you assume all risks in independently viewing the contents and selecting a chosen strategy.
Where the research is distributed in Singapore to a person who is not an Accredited Investor, Expert Investor or an Institutional Investor, Oanda Asia Pacific Pte Ltd (“OAP“) accepts legal responsibility for the contents of the report to such persons only to the extent required by law. Singapore customers should contact OAP at 6579 8289 for matters arising from, or in connection with, the information/research distributed.

EURAUD to find buyers near market price?EURAUD - 24h expiry
There is no clear indication that the upward move is coming to an end.
Although we remain bullish overall, a correction is possible with plenty of room to move lower without impacting the trend higher.
Risk/Reward would be poor to call a buy from current levels.
A move through 1.7900 will confirm the bullish momentum.
The measured move target is 1.8025.
We look to Buy at 1.7850 (stop at 1.7775)
Our profit targets will be 1.8000 and 1.8025
Resistance: 1.7900 / 1.7950 / 1.8000
Support: 1.7850 / 1.7800 / 1.7775
Risk Disclaimer
The trade ideas beyond this page are for informational purposes only and do not constitute investment advice or a solicitation to trade. This information is provided by Signal Centre, a third-party unaffiliated with OANDA, and is intended for general circulation only. OANDA does not guarantee the accuracy of this information and assumes no responsibilities for the information provided by the third party. The information does not take into account the specific investment objectives, financial situation, or particular needs of any particular person. You should take into account your specific investment objectives, financial situation, and particular needs before making a commitment to trade, including seeking, under a separate engagement, as you deem fit.
You accept that you assume all risks in independently viewing the contents and selecting a chosen strategy.
Where the research is distributed in Singapore to a person who is not an Accredited Investor, Expert Investor or an Institutional Investor, Oanda Asia Pacific Pte Ltd (“OAP“) accepts legal responsibility for the contents of the report to such persons only to the extent required by law. Singapore customers should contact OAP at 6579 8289 for matters arising from, or in connection with, the information/research distributed.

NZDJPY - Waiting for Bulls to Step In!NZDJPY has been trading within a broad ascending channel and is now approaching a strong demand zone that aligns with the channel’s lower red trendline.
This area has acted as a solid base in the past, and as price retests it once again, it could serve as the starting point for a new bullish swing.
As long as the blue demand zone holds, I’ll be watching for bullish reversal signals to look for long opportunities, with potential short-term targets toward 87.50 and 88.80, where previous supply and the upper boundary of the channel intersect.
However, if the price breaks below 85.00, the bullish structure would weaken, and a deeper correction could follow before buyers regain control.
⚠️ Disclaimer: This is not financial advice. Always do your own research and manage risk properly.
📚 Stick to your trading plan regarding entries, risk, and management.
Good luck! 🍀
All Strategies Are Good; If Managed Properly!
~Richard Nasr

ARKK — A “Short” Ranting🔱 ARKK isn’t a revolution - it’s a high-fee, high-drama lottery ticket dressed in a lab coat. 🔱
🏦 Here's my take on the Fundamentals 🏦
⚠️ Overpriced Dreams:
You’re paying luxury prices for companies that don’t make money—most can’t even spell “free cash flow.”
⚠️ Interest-Rate Kryptonite:
When rates rise, ARKK melts. Its “future profits” vanish faster than smoke in a wind tunnel.
⚠️Liquidity Trap:
It owns too much of too little; one wave of redemptions and it’s forced to dump stocks into a falling market.
⚠️ Weak Alpha, Big Fee:
For all the hype, it lags a plain NASDAQ ETF - you’re paying 0.75% to underperform.
⚠️ Factor Suicide:
It’s built from the worst statistical factors. Expensive, volatile, unprofitable stocks that hate inflation.
⚠️ Concentration Bomb:
Half the fund sits in a handful of “disruptors.” If one blows up, the whole thing shakes.
⚠️ Dumb Money Flow:
Retail investors chase this thing at highs and bail at lows. Every short seller’s dream.
⚠️ Copycats and Fee Drag:
Competitors now clone the “innovation” pitch cheaper and better, while ARKK drags its old fee chain.
📈 And finally, here's the Chart Analysis
This flying Pig is ready to be Barbequed.
It missed the pump up to the Warning Line and fell back into the Fork. Today it opened inside, and if nothing superstitious happens, it’ll close inside too.
So, I’m short - period.
As always, my first target is the Centerline.
Have a great weekend, everyone and grab some gas for the BBQ.

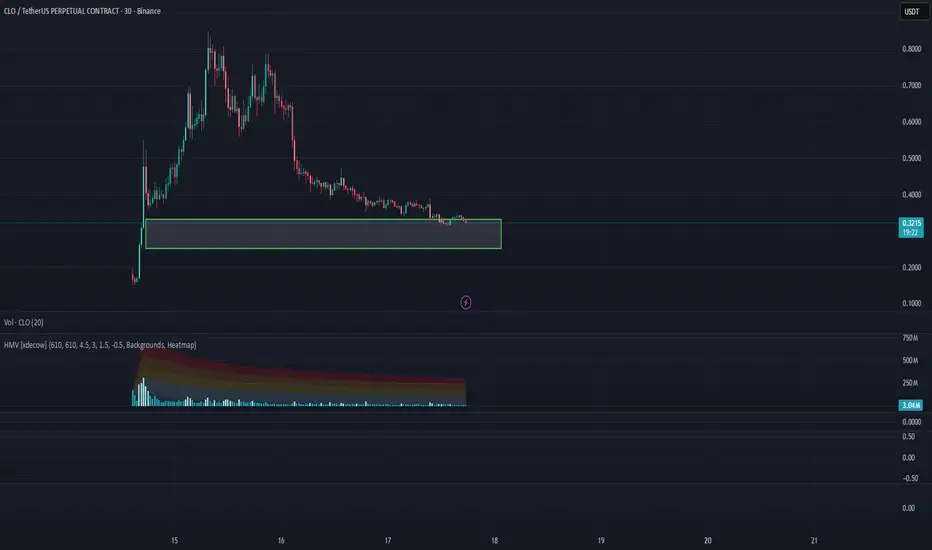
CLO/USDT Analysis. Long Setup
The asset has reached a strong volume support zone at $0.33–$0.25.
If we see strong buying activity — confirmed by a volume spike, local trend reversal, or delta-based absorption — we can consider a long setup with up to 100% growth potential.
This publication does not constitute financial advice.
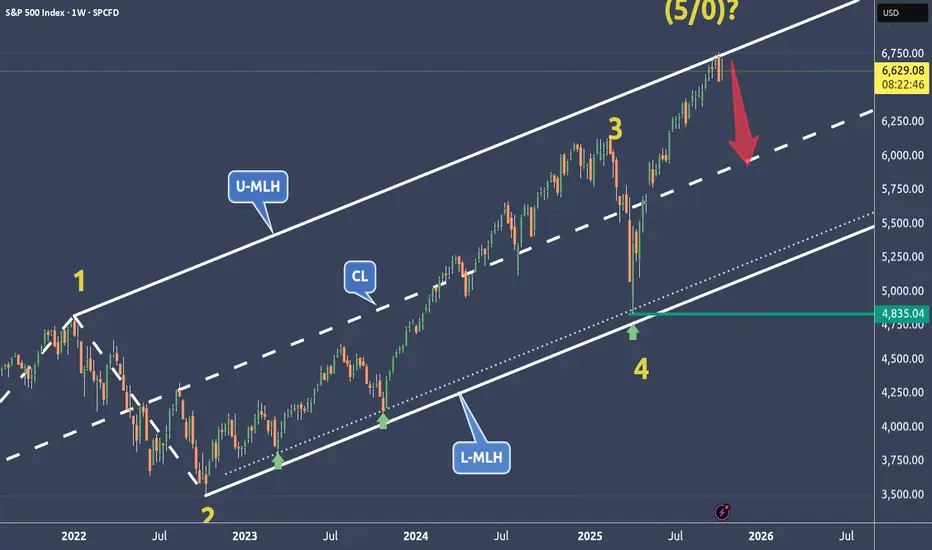
SPX is weakening at a very dangerous price level🔱 SPX is at a very dangerous price level ⚠️
...right at the Upper Median Line Parallel.
💰 If this market turns, the Centerline becomes the next target.
The 0-5 Count is also a good indication when prices start to turn at these extreme levels.
⚠️ Stay sharp — momentum is fading.
I wish you all a relaxing weekend.
METAs Short Target At $630🔱 The Cracks Are Showing 🔱
🏦 Let’s talk fundamentals.
The biggest storm cloud hanging over META right now? Regulation — in both the EU and the U.S. If fines or compliance costs ramp up, profits get squeezed and strategy shifts become inevitable.
👉 Competition is biting too. New apps are stealing attention, and every second users spend elsewhere chips away at Meta’s moat.
⚠️ Then there’s the AI spending spree. Billions are burning to build infrastructure, but if those bets don’t pay off fast, margins will bleed.
Add growing media pressure — from content moderation to child safety — and you’ve got a brand walking through a minefield of reputational risk.
📈 Now, look at the chart.
The price has fallen below the Centerline. That’s not noise — that’s a message. It’s a classic short signal.
Before the drop, we saw price action stall again and again at the upper quarter line. That’s not random congestion. That’s distribution — the big whales quietly unloading while everyone else was still bullish.
Then came the pullback to the Centerline. followed by a weak close. Translation: buyers are drying up.
💰 Target? $630 at the L-MLH. With smart position sizing, this could be a sweet Christmas trade.

NZDJPY to find buyers at previous swing low?NZDJPY - 24h expiry
The previous swing low is located at 85.56.
85.38 has been pivotal.
50 4week EMA is at 85.66.
Early pessimism is likely to lead to losses although extended attempts lower are expected to fail.
Dip buying offers good risk/reward.
We look to Buy at 85.67 (stop at 85.17)
Our profit targets will be 87.17 and 87.37
Resistance: 86.84 / 87.46 / 87.75
Support: 86.33 / 86.00 / 85.38
Risk Disclaimer
The trade ideas beyond this page are for informational purposes only and do not constitute investment advice or a solicitation to trade. This information is provided by Signal Centre, a third-party unaffiliated with OANDA, and is intended for general circulation only. OANDA does not guarantee the accuracy of this information and assumes no responsibilities for the information provided by the third party. The information does not take into account the specific investment objectives, financial situation, or particular needs of any particular person. You should take into account your specific investment objectives, financial situation, and particular needs before making a commitment to trade, including seeking, under a separate engagement, as you deem fit.
You accept that you assume all risks in independently viewing the contents and selecting a chosen strategy.
Where the research is distributed in Singapore to a person who is not an Accredited Investor, Expert Investor or an Institutional Investor, Oanda Asia Pacific Pte Ltd (“OAP“) accepts legal responsibility for the contents of the report to such persons only to the extent required by law. Singapore customers should contact OAP at 6579 8289 for matters arising from, or in connection with, the information/research distributed.

GOLD (XAUUSD) – Decision Zone Ahead | Bulls Holding DemandTVC:GOLD
Market Overview
Gold has shown repeated rejections from the demand base, confirming aggressive buyer interest.
Every retest of the yellow box created higher lows, showing accumulation before a potential expansion toward new highs.
If bulls hold above 4 200, continuation toward the 4 228–4 235 zone (previous all-time-high region) is expected.
Key Scenarios
✅ Bullish Case 🚀 → 🎯 Target 1 4 218 | 🎯 Target 2 4 230 | 🎯 Target 3 4 240
❌ Bearish Case 📉 → Rejection from decision zone → Retest of 4 185 then 4 165
Current Levels to Watch
Resistance 🔴 4 218 – 4 230
Support 🟢 4 185 – 4 165
⚠️ Disclaimer: This analysis is for educational purposes only. Not financial advice.

BNB/USD – Testing Patience Below the 200-SMA📈 Bias: NEUTRAL (reversal watch)
BNB trades around $1,186, consolidating after last week’s sharp pullback. Price remains capped under the 200-SMA ($1,238), suggesting the trend is still under pressure but flattening.
RSI near 46 shows recovering momentum. If bulls reclaim $1,223–$1,238, a shift to bullish bias is likely; failure to hold $1,178 opens the door to $1,145 support retest.
📊 Key Levels:
Resistance: $1,223 / $1,238
Support: $1,178 / $1,145

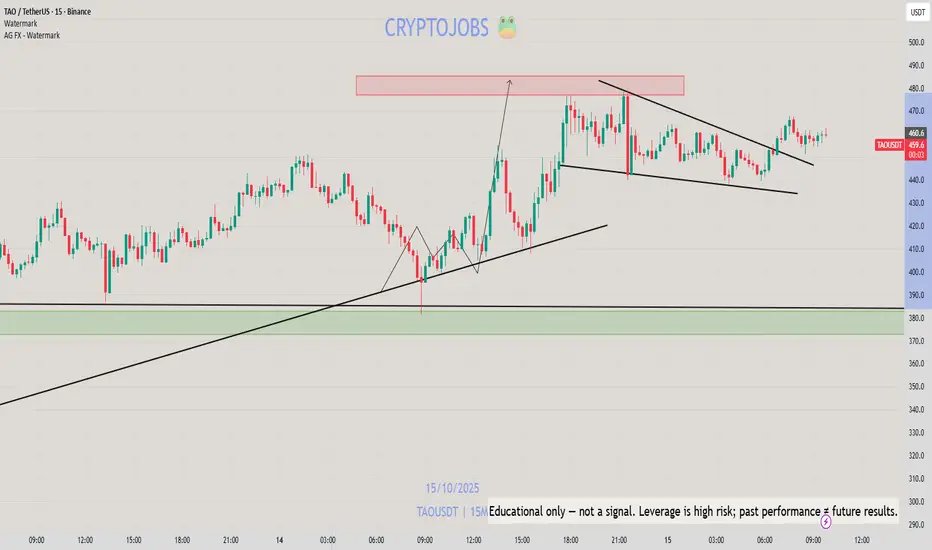
TAO - PERFECT SETUP SHARED AGAIN! GETTEX:TAO - perfect setup shared yesterday!
From the bottom to the top: +25%
Congrats fam.
NZDUSD to turnaround?NZDUSD - 24h expiry
Price action looks to be forming a bottom.
We expect a reversal in this move.
Risk/Reward would be poor to call a buy from current levels.
The measured move target is 0.5725.
A move through 0.5800 will confirm the bullish momentum.
We look to Buy at 0.5700 (stop at 0.5670)
Our profit targets will be 0.5775 and 0.5800
Resistance: 0.5750 / 0.5775 / 0.5800
Support: 0.5700 / 0.5675 / 0.5650
Risk Disclaimer
The trade ideas beyond this page are for informational purposes only and do not constitute investment advice or a solicitation to trade. This information is provided by Signal Centre, a third-party unaffiliated with OANDA, and is intended for general circulation only. OANDA does not guarantee the accuracy of this information and assumes no responsibilities for the information provided by the third party. The information does not take into account the specific investment objectives, financial situation, or particular needs of any particular person. You should take into account your specific investment objectives, financial situation, and particular needs before making a commitment to trade, including seeking, under a separate engagement, as you deem fit.
You accept that you assume all risks in independently viewing the contents and selecting a chosen strategy.
Where the research is distributed in Singapore to a person who is not an Accredited Investor, Expert Investor or an Institutional Investor, Oanda Asia Pacific Pte Ltd (“OAP“) accepts legal responsibility for the contents of the report to such persons only to the extent required by law. Singapore customers should contact OAP at 6579 8289 for matters arising from, or in connection with, the information/research distributed.

SI1! - Dancing on the SILVER Tracks🔱 I like risk. Specially when it's skewed to my favor 🔱
WL1 has been reached, and the market is wildly overextended.
Is it crazy to stand in front of this speeding train?
Absolutely — if you don’t know when to jump.
I’ve done my warm-up, and I’m ready to leap off the rails the moment it gets too close, too fast.
My move is with options — that means my risk is defined, my escape route mapped.
I would never short the underlying — not in a million years.
Now let’s see if this setup earns me that Steak & Lobster target.
