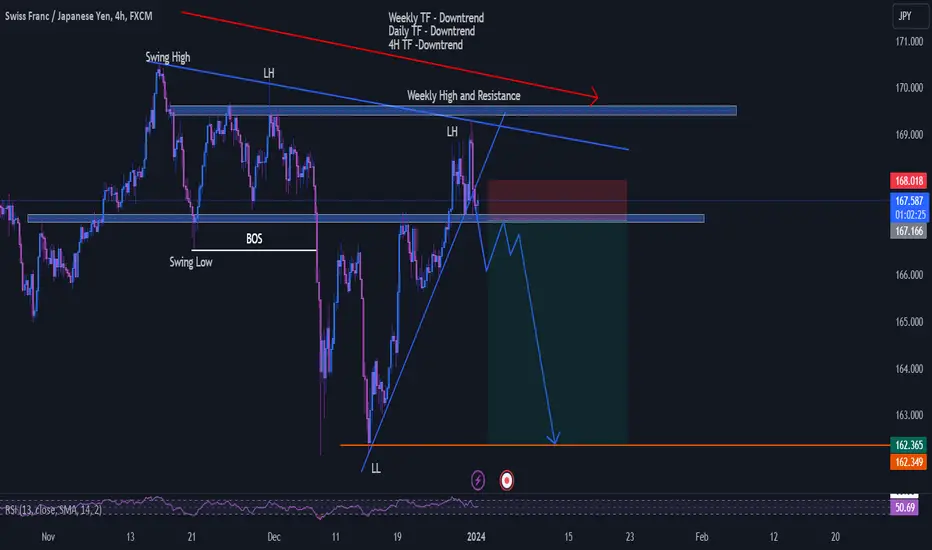
CHFJPY Short Idea Intra-day trading 4H entry TFHappy New Year Guys! Its your girl Forex Potatoe we smash the charts and here we are in 2024 ready to smash it again!.
CHF JPY has been in a prolonged uptrend and showing weakness as buyers are beginning to loose steam and momentum slowing down from buyers side. Price broke weekly and daily lows and currently bias changed to Sell on 3 TimeFrames.
What i hope to see before entering this trade is the trendline broken (which has broken a bit), i also need to see the support broken and the last low taken out before i'd be interested in taking a sell. I Predict CHFJPY sells to the TP point on the last Low.
Kindly follow me as i would be breaking down my analysis from time to time and posting videos as well mostly for beginners and intermediate traders that need to understand market structure, and how to execute trades. My goal is to simplify the charts and smash it so you can be a better traders
Tell me what you think about this idea.
Setupoftheday
EURUSD FORECAST 21/NOV/2023In this video, I did a full breakdown of eurusd, showing the important levels of structure in the market, and how I intend to trade today. I also talked about what I will expect to see before I take a trade and what I'll see that will make me not to take a trade.
If you like this kind of video, Please follow me and give me a boost.

EURJPY SELL | Day Trading AnalysisHello Traders, here is the full analysis.
Watch strong action at the current levels for SELL. GOOD LUCK! Great SELL opportunity EURJPY
I still did my best and this is the most likely count for me at the moment.
Support the idea with like and follow my profile TO SEE MORE.
Traders, if you liked this idea or if you have your own opinion about it, write in the comments. I will be glad 🤝
Patience is the If You Have Any Question, Feel Free To Ask 🤗
Just follow chart with idea and analysis and when you are ready come in THE GROVE | VIP GROUP, earn more and safe, wait for the signal at the right moment and make money with us💰

GBPUSD short term Longs to 1.22500SCENARIO 1 - My current bias for GBPUSD is to buy roughly were current price is at (9hr demand) but could expect a bit more downside and mitigate the 7hr demand zone for the buy setup to take place. Regardless we are expecting a wyckoff accumulation to take place in this POI. Targeting 1.22500 were the 8hr supply zone is located, we will then look for price to slow down momentum and distribute for a potential sell setup to form in either the 8hr or the 10hr supply zones.
My confluences for the buys are as follows:
- Price has tapped into a 9hr demand zone that has caused a change of character to the upside.
- There's lots of imbalances left from the downwards push we had today so we are expecting that to get filled in.
- Liquidity that was lying underneath the consolidation has also been swept hence why we are starting to see higher highs and higher lows.
- Also for price to continue going down in a bearish trend overall I would be expecting for price to mitigate the 1.22500 level in order to continue going down.
- wyckoff accumulation is starting to unravel as price was slowing down whilst entering the zone (good sign, as the rejection indicates price wants to go back up.)
P.S. If price decides to push higher than our two supply zones and sweeps the liquidity at 1.23400 it will form a break of structure on the higher time frame indicating the trend will officially be bullish temporarily.

EURUSD short term Longs to 1.06650 SCENARIO 1- My current bias for EURUSD is that it will currently react off the (9hr) demand zone, which we will expect for price to accumulate in order for us to enter buys up to 1.06650. From were the (6hr) supply zone is located, we will then expect price to slow down and distribute for potential sells all the way back down to 13hr demand zone. Or possibly even lower as there's loads of liquidity lying around those POI's that I have marked out.
My confluences for the buys are as follows:
- Price tapped in a 9hr demand zone that caused a BOS to the upside.
- Market is currently retracing due to the impulsive move up that happened during the past couple days.
- Imbalances are left from when price pushed down today that it needs to comeback and fill.
- There's lots of magnets that attract price in the bullish directions i.e untouched Asia highs and trend line liquidity.
- Price is creating higher highs and higher lows and has shown this via a change of character on the 4hr as well as a break of structure on the 4hr to confirm the shift in trend.
- In addition for price to continue going down in a bearish trend overall I would be expecting for price to mitigate the 6hr supply zone above in order to continue going down.
P.S. For now I would be expecting wyckoff accumulation to play out in the lower timeframes to give us a indication of were we can find a sniper entry in order to maximise our risk to reward ratio.

DXY Dollar Index The Dollar Index (DXY) is presently situated at the upper boundary of a trading channel, accompanied by several concurring factors that suggest potential selling opportunities. These include the possibility of encountering resistance near the range of 103.380 to 103.450, aligning with a notable rejection point. Furthermore, there is the presence of the -0.618 bullish Fibonacci target, potential rejection candlestick formations on the hourly chart, contact with the 200-day moving average, interaction with a descending trend line stemming from November 2022, and the impending trading session tomorrow, which adds another layer of convergence to the analysis.

Simple Setup on GBPJPYHey guys, here is a simple setup for GBPJPY. Wait for the candles to close below the sell zone or buy zone. I am using the Stochastic RSI with settings of 14-3-3 to identify a fake out. Once the one hour candle closes below or above the zone, you can check if the Stochastic isn't oversold or over bought. If you have these confirmations, then you can take position on either side.

Netflix and Crash?Price has been on a steady uptrend since the beginning of July 2022. Looking at higher timeframe charts we can see price forming a head and shoulders around the $333 zone which could signal a reversal coming soon given if there's enough downward momentum. If price breaks above the $333 zone, this head and shoulders pattern would be considered a failure. We'll see what happens in the next coming days and react to what the charts show us!

USDCAD SetUP (CPI HIGH)Not much to say.
Continuing with HIGH CPI SetUp
USDCAD retest to previous lows and then with the fundamentals (possible HIGH CPI numbers) continues up.

GOLD CPI DAY (HIGH CPI)Waiting the news but this is 1 of the 3 setups.
1- High Cpi
2- Expected Cpi or close to the previous Cpi (Gold ranges or a little bit bull)
3- Cpi improvement ---> Gold bull

THIS IS MAGIC!Intraday setup for purchase and sale of the BINANCE:MAGICUSDT asset. The transaction must be accompanied by a short stop, or the purchase should be made in parts at each of the levels.
The goals are minimal, you can carry some higher.

$EURCAD - A break to either direction!$EURCAD - A break to either direction!
A break to either direction re-test and then execute!
Key Tip: Follow your own trade plan.
Trade Journal

$EURAUD - Where to next?$EURAUD - Where to next?
Short term trade idea! Within the range a break to either direction...
Don't forget to follow your trade plan!
Enjoy,
Trade Journal

$GBPCAD - Range-bound until...!$GBPCAD - Rangebound until...!
As you see we are range bound until a break to either direction, perhaps NFP can shift this tomorrow...
Lows: 1.61980
Highs: 1.64600
Trade Journal

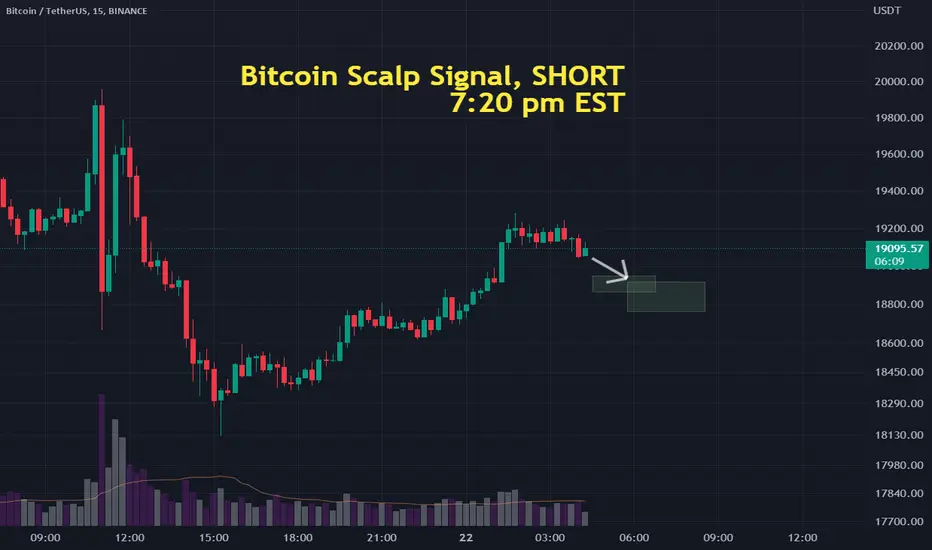
Bitcoin Scalping Signal for Day Trading🖥️ We have determined there is a 60% chance Bitcoin will Fall from our current entry point.
📉 SHORT - BTC : $19,090 📉
💵 Length of trade: we are expecting BTC to hit a 200 scalp, with a high end of $300, and a minimum expectation of $150.
🕰️ Duration of trade: we are expecting this to occur within 1.5 hours of this signal for the Min. Profit Target. Then we see a maximum duration of 4 hours.
❗THIS IS A FAST SCALP OPPORTUNITY
Break Down Analysis GBPJPY, 20/09/22# GBPJPY : Short Desk, Supply zone head and shoulder, my expectation 161.944$

XAUUSD ShortGold looking to trap bulls going into weekly closure heading into 1671 price level
Trade setup is really good Risk to Reward
This is only for educational purposes, trade at your own risk.
Always use risk management, be safe.

US30 2h Setup I'm looking at US30 long setup going into London and NY, its looking pretty good as we are trading with bullish structure and price respecting some level of area I have marked up.
This is educational purposes only mind your risk and be safe in the market.
ULong

BTC Long Setups for todayBTC is creating liquidity at the moment by making a compression.
Its being made for a next impuls push, i will be watching the price in the green box POI to look for bullish conformation to make a new HH. I will look on the 1 MIN for bearish structure breaking. And create a limit long on the retest
There is still some Supply imbalances that makes it intresting to still look for a 3th push to the upside.
Also there is an Eliot wave 5 inplay and at the moment writing this its in retracement phase/Consolidation phase.
The long more below is intresting if price wants to test the lower levels demand and create alot off liquidty with a probability to move up with a strong impuls.
No financial advice.

BTC Long setupBTC broke Out off an downtrend, tested liquidity to the downside and made a W pattern that is a Common bullish reversal pattern.
BTC also broke the structure that made the Low on the chart
Alot off signs BTC looks bullish and is ready to make a full reversal to higher targets
Also BTC Completed a market cycle that consist off 3 Phases:
1: Accumulation Phase
2: Contraction/expension Phase
3: Impuls phase
And is now back in accumulation phase and making ready for the next move,
usually breaking out off the accumulation zone to the downside in this case with a Fake move to then move higher and reach the targets.
I hope this helps you to create A long setup for BTC.
Its also possible for BTC to already move higher from here or test the beginning from the impuls that made the HH.
No financial advice.

Long Setup BTCBTC is in a 15min Compression close to an important point to gain.
High probability market is building up liquidation to then make a HigherHigh push
BTC is in a downtrend so take profits before the target.
This is called a Fadeout play because you take the other side of what normal traders do when a breakout happens in this case is Shorting when it brakes out off the compression.
It leads to building up even more liquidation for the market to then push higher en hit alot of Short StopLosses.
If you have any questions feel free to ask.
No financial advice.

Possible Long setup for todayPerfect condition to take this long:
BOS
Makes HL
Filled total imbalance

SLPUSDT Long ScenarioYesterday SLP broke out of descending channel also breaking the triangle. We have the first impulse upwards and it makes sense now to wait for a correction and enter the market before the second impulse. I would expect a bounce between 0.618 and 0.786 Fib zones. Also in that area market would retest the descending channel and triangle. Market made a liquidity zone forming equal highs so that would be my target. I would put invalidation level below the "e" of triangle.
What do you think about this one? :)
