SHIBUSD Bullish Structure Aligning With Market Flow🚀 SHIBA INU (SHIB/USD) - Swing Trade Profit Pathway Setup 🎯
Current Market Data ✅
Real-Time Price: $0.00000827 USD (+14.85% 7-day momentum)
Market Cap: $4.87B (Ranking #25)
24h Volume: $133.6M USD
Status: Bullish momentum breakout zone 📈
🎯 TRADE SETUP OVERVIEW
Asset: SHIBA INU vs U.S DOLLAR (SHIB/USD)
Strategy: Swing Trade - Simple Moving Average Breakout
Trade Type: BULLISH CONTINUATION 🔝
Timeframe: Multi-day swing setup
📍 ENTRY STRATEGY
Entry Approach: Flexible zone entry
✅ ANY PRICE LEVEL ENTRY - Multiple entry opportunities on breakout confirmation
Primary Entry: Above Hull MA (HMA) breakout zone
Secondary Entry: Dips into support after initial breakout
Optimal Entry: Confirmed 4H HMA golden cross + volume surge
Entry Signal Confirmation:
Hull Moving Average (HMA) slope turns bullish ✓
Volume increases above 20-day average ✓
Price breaks & holds above key resistance levels ✓
⛔ STOP LOSS (SL) - RISK MANAGEMENT
SL Placement: $0.00000750
Placement Rule: AFTER Hull MA breakout confirmation
Reasoning: Thief SL = Security line against false breakouts
⚠️ Important: Your stop loss placement is YOUR OWN CHOICE & RESPONSIBILITY. This is not financial advice. Adjust SL based on your personal risk tolerance and trading account size. Many traders adjust SL to 2-3% below entry after confirmation.
🎁 PROFIT TARGET (TP) - EXIT STRATEGY
Primary Target: $0.00000900
Secondary Target: $0.00001019 (Technical golden cross)
Tertiary Target: $0.00001280 (6-month upside potential)
Why These Levels?
Hull MA = POLICE BARRICADE - Acts as dynamic support/resistance barrier
$0.00000900 zone = Oversold trap recovery + strong correlation support
Previous resistance = Future support principle applies here
Risk/Reward Ratio = 1:2+ (Excellent for swing traders)
⚠️ Important: TP selection is YOUR OWN CHOICE & RESPONSIBILITY. Lock in profits at levels that align with YOUR trading strategy. Consider taking partial profits (25-50%) at primary target, then trailing SL on remainder.
📊 TECHNICAL ANALYSIS FACTORS
Bullish Indicators ✅
RSI Momentum: Currently 57.05 (Neutral-Bullish zone)
Moving Averages: HMA slope turning positive
Volume Profile: Exchange inflows declining = Accumulation phase
7-Day Performance: +14.20% outperforming crypto market (+4.50%)
24-Hour Action: Strong buying pressure above support levels
Whale Activity: 167.99B SHIB ($1.18M) exited exchanges on Dec 31 = Institutional accumulation signal
Risk Factors ⚠️
Large circulating supply (589.24 trillion SHIB) = Price scaling challenges
Daily burn rate slowing = Deflationary pressure reduced
September Shibarium bridge exploit = Some ecosystem trust issues
Anonymous development team = Leadership transparency concerns
🔗 RELATED PAIRS TO WATCH (Correlation Analysis)
Positive Correlations - Follow SHIB Moves:
1. DOGE/USD (Dogecoin) 🐕
Correlation Index: +0.85
Reason: Meme coin ecosystem + retail sentiment driver
Action: If DOGE breaks $0.20, expect SHIB breakout confirmation
Watch Level: $0.20-$0.22 resistance zone
2. ETH/USD (Ethereum) ⛓️
Correlation Index: +0.70
Reason: SHIB runs on Ethereum layer-2 (Shibarium) - Direct network dependency
Action: ETH strength = Shibarium efficiency = SHIB upside
Watch Level: ETH above $3,500 = Bullish for SHIB ecosystem
Current ETH Price: $3,123.74 (+4.06% momentum)
3. BTC/USD (Bitcoin Dominance) 👑
Correlation Index: +0.69
Reason: Alt-season driver - When BTC rallies, alts follow
Action: BTC above $90k = Alt coin money rotation confirmed
Watch Level: Bitcoin dominance below 55% = Altcoin strength signal
Current BTC Price: $89,904.63 (+1.45%)
4. SOL/USD (Solana) 🚀
Correlation Index: +0.65
Reason: Layer-2 network competition + ecosystem adoption race
Action: SOL weakness = Potential SHIB strength divergence
Watch Level: SOL support at $130-$135 zone
Current SOL Price: $132.51 (+4.57%)
5. SHIBARIUM (BONE/USD) 🦴
Correlation Index: +0.95 (Highest correlation - Direct ecosystem token)
Reason: Governance token + network utility token for Layer-2
Action: BONE strength = Shibarium adoption = SHIB ecosystem health
Watch Level: BONE above $0.85 = Strong ecosystem signal
Action: Track Shibarium RPC migration completion (Q1 2026)
6. Total Cryptocurrency Market Cap
Correlation Index: +0.63
Reason: Risk-on/risk-off sentiment across all alts
Action: Total crypto market cap above $2.5T = Favorable SHIB trading
Watch Level: Watch for macro capitulation/recovery phases
📰 FUNDAMENTAL & ECONOMIC FACTORS (Real-Time Data - Jan 4, 2026)
BULLISH CATALYSTS FOR 2026:
🔧 Shibarium L2 Technical Upgrades (Upcoming Q1-Q2 2026)
Zama FHE Privacy Integration: Q2 2026 launch confirmed
Brings on-chain privacy & confidential smart contracts
Makes Shibarium competitive with privacy-focused chains
Estimated Impact: +15-25% ecosystem value growth if executed
RPC Network Migration: Early 2026 (post-security audit)
Decentralizes network (removes single point of failure)
Increases trust post-September bridge exploit
Improves transaction reliability & developer confidence
AI Technical Paper Release: Q1 2026
Partnership announcements with NVIDIA & Alibaba Cloud
Positions SHIB in AI + blockchain convergence trend
Enterprise adoption narrative strengthens
Shibarium Layer-3 Rollout: Mid-2026
Faster transactions, multi-currency gas fees
Improves UX for retail traders & developers
Adoption potential + volume increase expected
💰 Market Sentiment Shifts (Early 2026 Data)
Meme Season Starting: SHIB +17.95% since Jan 1, 2026
First green weekly candle in 2026
Retail FOMO entering the space = Volatility opportunity
Momentum traders accumulating positions
Whale Accumulation Signals:
Exchange outflows: 167.99B SHIB ($1.18M) on Dec 31
Institutional buyers repositioning
Futures open interest +9.39% = Leveraged long positioning
Derivatives Market Heating:
Open interest: +20% surge in early 2026
Indicates trader positioning for breakout
Volume concentration = Price move likely
⚖️ Regulatory & Macroeconomic Factors:
Positive Developments:
CLARITY Act Potential: Crypto regulatory framework clarity could unlock institutional capital
Coinbase Regulated SHIB Futures: Launched - Legitimacy + retail access
Crypto Market Recovery: Bitcoin +1.45%, Ethereum +4.06% - Broad-based strength
Lower Fed Rate Expectations: 17.7% odds of January rate cut = Liquidity increase favors risk-on assets like SHIB
Risk Factors to Monitor:
SEC Scrutiny: 60% of altcoins under review globally for potential restrictions
September Shibarium Exploit: K9 Finance issued Jan 6, 2026 deadline for full restitution
If not resolved: May trigger ecosystem departures
If resolved: Major bullish catalyst + confidence restoration
Anonymous Leadership: Shytoshi Kusama silent since early December
Communication concerns post-exploit
2026 focus on "repair, focus & building to last" (per dev Kaal Dhairya)
Less hype marketing = More serious infrastructure focus (Could be Bullish long-term)
Supply Inflation Risk:
589.24 trillion tokens in circulation
Daily burns slowed to ~3.2M SHIB (from billions earlier)
Price scaling challenges without massive adoption
🎯 TRADE PROBABILITY FACTORS
Bullish Case: 65% Probability
✅ Momentum breakout confirmed (7-day +14.20%)
✅ Whale accumulation signals strong
✅ Multiple 2026 technical upgrades lined up
✅ Broader crypto market recovery supporting altcoins
✅ Meme season retail FOMO entering
Bearish Case: 35% Probability
⚠️ Large circulating supply limits upside scaling
⚠️ Regulatory headwinds could cause delisting risk
⚠️ Ecosystem restitution deadline (Jan 6) = Event risk
⚠️ Leadership transparency issues post-exploit
⚠️ Failed to rally with Bitcoin's 2025 surge = Relative weakness
💡 TRADER NOTES & STRATEGY TIPS
For Swing Traders (3-14 days holding):
Enter zones: First breakout above HMA + confirmed volume
Scale in: Use 3 equal entries on dips within the trend
Take profits: 50% at $0.00000900 (secure gains), 30% at $0.00001019, hold 20% for trend extension
Use alerts: Set price alerts at key technical levels to avoid emotional decisions
Risk/Reward: Maintain 1:2+ ratio minimum before entering
Risk Management Checklist:
Position size: Only risk 1-2% of account per trade
SL placement: Confirmed after breakout (NOT before)
TP scaling: Don't try to catch "the top" - take profits systematically
Market context: Check Bitcoin dominance + overall crypto sentiment before entry
Stop loss trails: Move SL to breakeven after +50% gain minimum
Event Calendar for SHIB Traders (Q1 2026):
Jan 6, 2026: K9 Finance ecosystem restitution deadline (Event risk)
Q1 2026: Shibarium RPC migration completion expected
Q1 2026: AI technical paper release with NVIDIA/Alibaba details
Q2 2026: Zama FHE privacy upgrade rollout begins
Mid-2026: Shibarium Layer-3 Alpha launch
⚠️ DISCLAIMER & RISK ACKNOWLEDGMENT
IMPORTANT - READ CAREFULLY:
This analysis is based on technical setups and market data AS OF JANUARY 4, 2026. This is NOT financial or investment advice. SHIB is a highly volatile cryptocurrency with meme-coin origins.
🚨 Risks involved:
Cryptocurrency markets operate 24/7 with extreme volatility
SHIB's large circulating supply presents scaling challenges
Regulatory decisions could impact value substantially
Past performance does not guarantee future results
You can lose your entire investment
🎬 ACTION CHECKLIST FOR TRADERS
Confirm Hull MA breakout on 4-hour timeframe
Wait for volume surge above 20-day average
Enter on breakout confirmation + hold above HMA
Place SL at $0.00000750 (AFTER breakout)
Set TP alerts at $0.00000900, $0.00001019, $0.00001280
Monitor Bitcoin dominance & Ethereum strength daily
Watch Jan 6 K9 Finance restitution deadline
Track Shibarium development milestone announcements
Scale out profits (don't be greedy - secure gains!)
Maintain proper position sizing & risk management
Good luck, traders! May your profits be realistic & your losses minimal. 🚀💰
Shibainu

SHIBUSDTWe are in correction at big short but should failed short and continue move price to high levels.
I wait for take trade with breakout 0.0000900 for buy and breakout 0.0000810 for short position.
CRYPTOCAP:PEPE KRAKEN:PEPEUSD BINANCE:PEPEUSDT

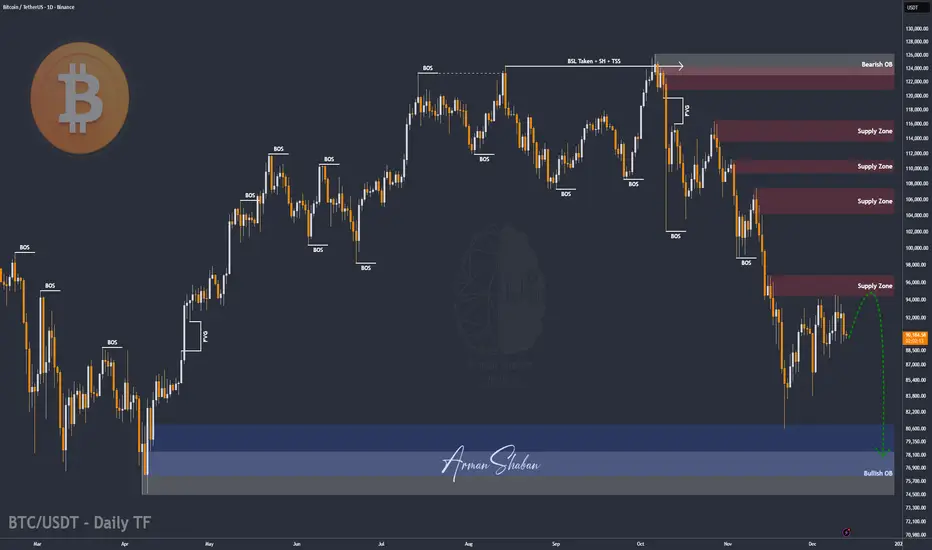
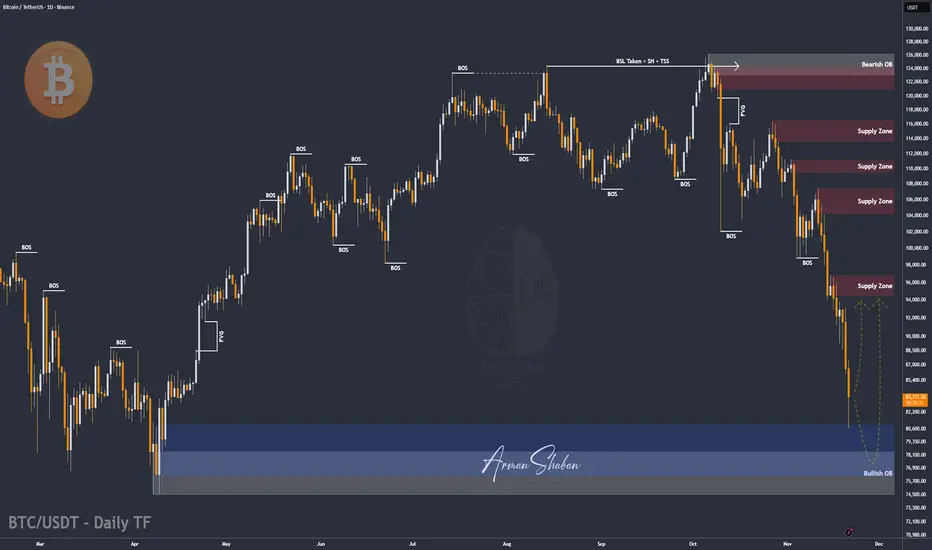
BTC/USDT | More Downside Ahead? Let's Discuss in the Comments!Bitcoin climbed back to $90,500, tapped resistance, and is now trading around $87,800. This bounce looks more like a classic liquidity grab than a trend reversal. I’m still leaning bearish. As long as $90,000 doesn’t flip into solid support, we’re likely heading lower. My next downside targets: $85,000 → $82,700 → $80,500
Nothing’s changed, structure is still weak, and the pressure’s on the bulls.
Please support me with your likes and comments to motivate me to share more analysis with you and share your opinion about the possible trend of this chart with me !
Best Regards , Arman Shaban

ETH/USDT | Ethereum Weekly Update Key Demand Zone Still in Play Ethereum rallied up to $3,450, but failed to hold and is now trading near $2,900. This correction could deepen, and I’m watching the $2,100–$2,700 demand zone closely.
It remains one of the strongest institutional zones on the chart. If price returns there, a sharp bullish reaction is highly likely.
Please support me with your likes and comments to motivate me to share more analysis with you and share your opinion about the possible trend of this chart with me !
Best Regards , Arman Shaban

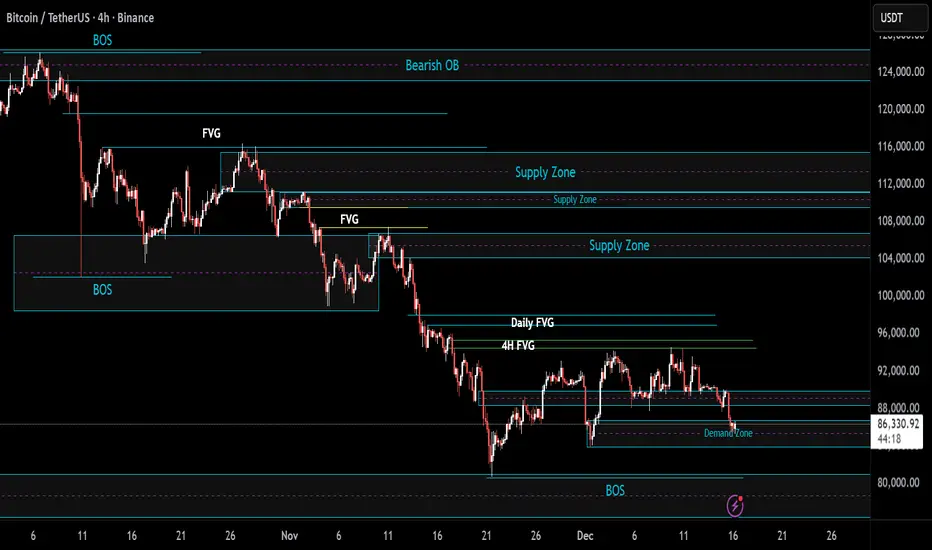
BTC/USDT | No clear movement! (READ THE CAPTION)As you can see in the Hourly chart of BTCUSDT, it surged in price after the CPI news, going as high as 89,477, before dropping to the demand zone again. However, this drop came with BTC going as low as 84,450, reaching the Bullish Rejection Block, and then going upwards towards the IFVG, reaching 88,449 before dropping again in between the demand zone and the IFVG.
So far, BTC is yet to make a strong move towards up or down, consolidating in the range with no clear motif.

BTC/USDT | Tests ahead! (READ THE CAPTION)As you can see, the BTC is ranging between the Demand zone and IFVG. BTC dropped to the mean threshold of the demand zone before going back up to the low of the FVG, at $88,350 level, then again dropping to the high of the Demand zone, at $86,680 level.
At the moment, BTC doesn't seem to be making any meaningful movements. If BTC fails to bounce back from the Demand zone and goes lower, a drop to 80,955, the high of the Bullish OB is likely to happen.
If BTC manages to bounce back up and go through the IFVG, it can go up all the way to the low of 4H FVG at 94,515 to challenge it once more.

BTC/USDT | Hold 90K or Prepare for a Heavy Flush? Let's See!CRYPTOCAP:BTC pushed into $94,700, tapped the target perfectly, and then slipped into a sharp correction. Right now Bitcoin is trading around $90,000, and the entire market is focused on a single decision level. If BTC can stabilize above $90,000 within the next 24 hours, the bullish structure stays alive and we can look for a continuation toward $97,000 and then $100,000.
If BTC fails to hold $90,000, the door opens for a deeper decline and the first downside target becomes the $78,000 demand zone. This is the point where the next major direction gets decided.
Please support me with your likes and comments to motivate me to share more analysis with you and share your opinion about the possible trend of this chart with me !
Best Regards , Arman Shaban
ADA/USDT | Cardano Pulls Back After the Rally! What's Next?CRYPTOCAP:ADA pushed all the way to $0.485 before getting hit with a sharp correction and right now price is trading near $0.40 which is roughly a sixteen percent drop from the recent high. Nothing major has changed in the broader structure because the key zone has always been the $0.32 to $0.36 demand range. If ADA drops into that area again I expect a fresh wave of buyers to step in just like the previous reactions.
For now I want to see if momentum cools down a bit more and whether ADA will revisit the deeper demand levels. That is still the zone where the next strong bullish leg can start building again.
Please support me with your likes and comments to motivate me to share more analysis with you and share your opinion about the possible trend of this chart with me !
Best Regards , Arman Shaban

BTC/USDT | Bears in control? (READ THE CAPTION)Good day folks, hope you're doing okay.
As you can see and I previously mentioned, BTC dropped to the demand zone and now it's being traded at 86,560 level.
However, it is yet to break out of the demand zone, if it fails to do so, a drop to the low of the demand zone at 83,860 is possible. If it goes up, it'll be met by the FVG at 88,350.
ETH/USDT | Another try to be bullish? (READ THE CAPTION)As you can see in the Daily chart of ETHUSDT, it went through the supply zone and got rejected there. I expect a fall to the Bullish OB in 2630-2874 zone and then a reaction back to the supply zone to challenge it once more. If it fails to show a reaction and go up after reaching the Bullish OB, I expect a drop to 2117-2328 Demand zone.
Make sure to leave a comment and like the analysis in order to make me motivated to bring you analysis everyday.
Sincerely, Amirali

BTC/USDT | a major drop incoming? (READ THE CAPTION)By examining the Daily chart of BTCUSDT, we can see that price has failed to break the 4H FVG at $94000 and has dropped twice from that zone. I expect another try to break through that FVG, but I expect BTC to drop from that zone again and maybe all the way to the bullish OB that is shown in the chart.
If BTC fails to hold above $90000, I expect a drop.

SHIBA Its first 1W Death Cross ever has been formed.Shiba Inu (SHIBUSD) has been trading within a Channel Down since the March 2024 High, which was the former Bull Cycle's Top. 4 weeks ago it completed its first ever 1W Death Cross, potentially signaling a strong bearish extension for the current Bear Cycle.
Until that happens, we have a short-term Buy Signal at our hands as not only did the Channel Down price a new Lower Low, thus technically granting the start of a new Bullish Leg, but this also took place on the 4-year Support Zone, which has been unbroken since May 2021.
As you can see, this Zone has offered numerous long-term buy opportunities. As in 2022 and 2023, every such rebound though is limited/ restricted by the presence of the 1W MA50 (blue trend-line), which has been rejecting every test since January 20 2025 (almost 1 year).
Based on that, unless we break the recent low, we expect SHIB to rally on the short-term and peak near the 1W MA50 at 0.0000115.
---
** Please LIKE 👍, FOLLOW ✅, SHARE 🙌 and COMMENT ✍ if you enjoy this idea! Also share your ideas and charts in the comments section below! This is best way to keep it relevant, support us, keep the content here free and allow the idea to reach as many people as possible. **
---
💸💸💸💸💸💸
👇 👇 👇 👇 👇 👇

BTC/USDT | Another try before bearish move? (READ THE CAPTION)Good day everyone, Amirali here.
As stated in the previous analysis, BTCUSDT reacted to the supply zone and faced a dropdown and now it is being traded 92,600 level right now. I expect another move to the FVG and seeing how it reacts before making a move. Should it manage to break through the 4H FVG, I expect a move to $96,900, the lower level of daily FVG.

BTC/USDT | Consolidation and fall (READ THE CAPTION!)By examining the 4H chart of BTCUSDT, we can see that BTC is struggling to make a move and is consolidating over the IFVG. If it fails to make a move, a fall to the Demand Zone at 86,600 is possible. However, if it manages to go up, it'll face the FVG at 94,500 level, which then determines whether BTC can make an upwards move or falls again.

BTC/USDT | Another run over 100K? (READ THE CAPTION!)By analysing the 4H BTCUSDT chart, we can see that a fall into the FVG and dropping all the way too $87700, it has reacted positively and is now being traded at $91700!
We shall see if BTC manages to go through the daily FVG, which is the $96900-$98000 zone. If BTC goes over than zone, another run to over $100K is possible!
This analysis will be updated!

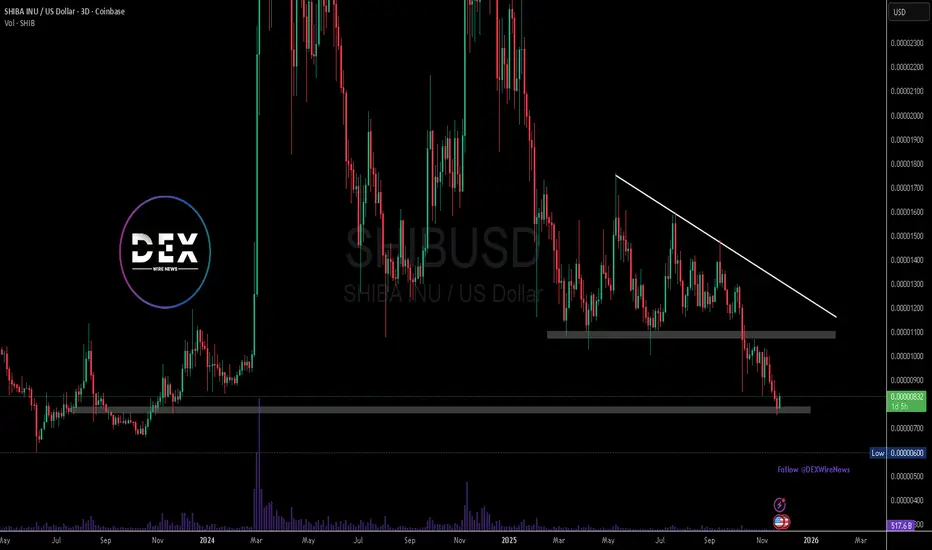
SHIB approaching a key reversal zone inside a descending channelSHIB continues to move inside a clear descending channel that has been respected since mid October. Price is once again approaching the mid zone of the channel while holding above a short term support created by recent higher lows.
The structure is now offering two possible scenarios.
Bullish idea
A reclaim of the short term trendline resistance can trigger a recovery toward the upper boundary of the descending channel.
Important focus points:
• Price stability above the short term support
• Breakout of the diagonal resistance
• Room toward the liquidity cluster at 0.00000913
• A full channel rotation opens the path to 0.00001035
Bearish idea
Failure to hold the mid support area invites continuation inside the channel.
What to watch:
• Loss of the support zone
• Return toward 0.00000827 then 0.00000779
• Deeper liquidity around 0.00000755 at the channel bottom
This level is an important pivot inside the overall channel. SHIB is preparing for a directional decision and the next breakout or rejection should define the coming weeks.

ETH/USDT | The Market Is Back ? More Bullish Move Ahead?CRYPTOCAP:ETH reacted perfectly to the 2100 to 2600 demand zone and the move played out exactly as expected. After the pullback the buyers stepped in and pushed the price all the way to 3150 and right now Ethereum is trading around 3100. The broader bullish setup is still valid and as long as ETH stays above the main demand area the bigger targets at 3200 and 3500 remain on the table. For now I’m watching to see if momentum continues to build from this recovery.
Please support me with your likes and comments to motivate me to share more analysis with you and share your opinion about the possible trend of this chart with me !
Best Regards , Arman Shaban

BTC/USDT | $BTC Smashes Back to 94K but The Real Test Is Ahead!CRYPTOCAP:BTC pulled a full reversal after the heavy crash and pushed all the way back to 94K. Right now price is trading around 93K and this entire move basically filled the liquidity void created during the violent dump. For short term traders this is where I prefer staying on the sidelines because premium entries will show up again at lower levels once the market cools down.
For long term traders and holders nothing has changed. The bullish structure is still alive and if Bitcoin can break above 97K the next upside leg can easily extend toward 105K and even 106K. I will update the view again once we see how price behaves around the 97K zone.
Please support me with your likes and comments to motivate me to share more analysis with you and share your opinion about the possible trend of this chart with me !
Best Regards , Arman Shaban

BTC/USDT | The real test ahead! (READ THE CAPTION)Hello everyone, back with another analysis, this time on BTC.
By examining the daily chart of BTC, we can see that bitcoin has been boosted up after hitting the demand zone and is currently being traded in 93K zone. I expect a rise to 97k-98k FVG zone, if BTC manages to go past through this zone, a rise to 104K could be possible. Should it fail to go past 98K, another drop to 81K is likely to happen.

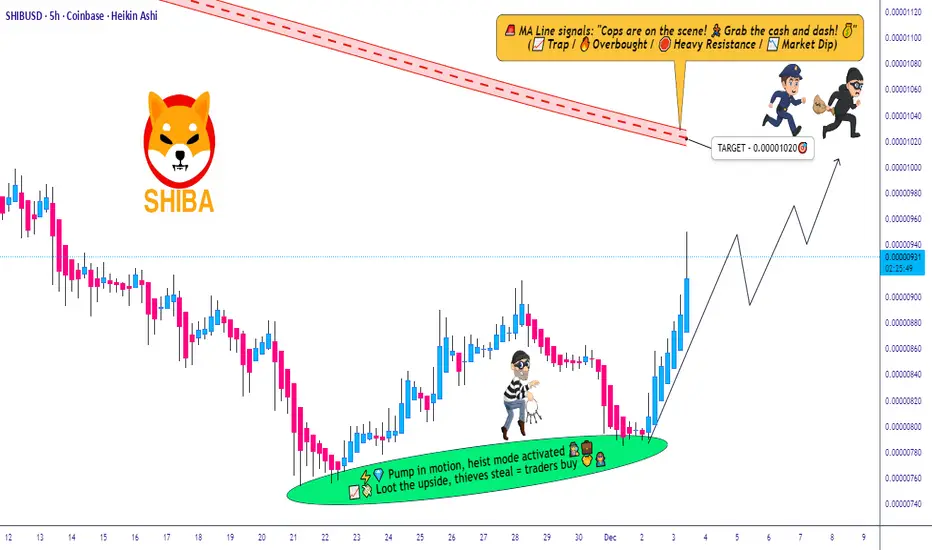
SHIB/USD Momentum Building — Is a Upside Expansion Coming?SHIB/USD Breakout Blueprint — Bullish Run Loading…? 🚀📈
📌 Asset Overview
SHIB/USD — “SHIBA INU VS U.S DOLLAR”
Crypto Market Opportunity Blueprint (DAY Trade)
🧭 Trading Plan
Plan: Bullish plan
Entry: YOU CAN ENTRY ANY PRICE LEVEL
🛡️ Stop Loss Guidance
Stop loss: This is thief SL @ 0.00000840, Dear Ladies & Gentleman (Thief OG's) Adjust your SL based on your startergy & own risk.
Note: Dear Ladies & Gentleman (Thief OG's) iam not recommended to set only my SL. its your own choice you can make money then take money at your own risk.
🎯 Take-Profit Outlook
Target: TRIANGULAR Moving average act as a strong resistance + overbought + trap is there so kindly escape with profits.
OUR target @ 0.00001020
Note: Dear Ladies & Gentleman (Thief OG's) iam not recommended to set only my TP. its your own choice you can make money then take money at your own risk.
📡 Market Context & Key Technical Insight
SHIB is now reacting strongly to triangular MA compression, signaling momentum buildup.
Overbought conditions create potential trap-zones, so profit-taking discipline is important.
Market structure remains bullish, buyers stepping in consistently on dips.
🔗 Related Pairs to Watch (Correlation + Key Points)
1️⃣ COINBASE:DOGEUSD — Dogecoin
Often moves in parallel with SHIB because both are meme-driven assets.
DOGE liquidity spikes usually lead SHIB volatility by a few minutes.
Strong DOGE breakouts can indicate SHIB momentum continuation.
2️⃣ BITSTAMP:BTCUSD — Bitcoin
BTC controls entire crypto risk sentiment.
If BTC holds above intraday EMA clusters and trends bullish, SHIB gets risk-on support.
Sharp BTC pullbacks may cause SHIB short-term weakness.
3️⃣ BITSTAMP:ETHUSD — Ethereum
SHIB is built on Ethereum, so gas fees + network congestion can influence SHIB’s intraday ranges.
ETH bullish breakouts often open liquidity for altcoins like SHIB.
4️⃣ COINBASE:SOLUSD — Solana
Not directly correlated but competes for retail meme attention.
If SOL rallies aggressively, retail flows may shift between meme-coins and high-beta L1 assets.
5️⃣ BINANCE:SHIBUSDT (Spot)
Tracks most liquid version of SHIB trading.
If SHIB/USD and SHIB/USDT diverge, it signals USD-index impact or exchange-based liquidity imbalances.
🧭 Summary
This SHIB setup is a momentum-driven bullish opportunity, but smart exits are key due to resistance and overbought traps. Watch DOGE and BTC closely—they are the primary flow leaders determining SHIB’s intraday aggression.
SHIB ($SHIB) Approaches a Critical Market Turning Point Shiba Inu ( CRYPTOCAP:SHIB ) trades near $0.0000082, hovering at the lower boundary of its long-term descending channel. This area has triggered strong rebounds in previous cycles, and traders now watch closely to see if the pattern repeats. Weeks of selling pressure pushed SHIB into a critical zone, but derivatives shifts suggest a potential turning point. Open interest flipped sharply after billions in short positions were liquidated, creating a cleaner foundation for any bullish attempt.
Global Derivatives Upgrades Strengthen SHIB’s Market Reach
Coinbase’s December expansion plays a major role in the latest sentiment spike. Starting December 5, Coinbase Derivatives activates 24/7 altcoin monthly futures, allowing SHIB to trade without old hour-based restrictions. This introduces constant volatility and increases liquidity in a way SHIB has not experienced before.
The exchange will also introduce perpetual-style futures for U.S. traders on December 12, placing SHIB alongside Bitcoin Cash and Avalanche. Perpetual futures typically attract speculative demand, and this could boost intraday momentum during key events.
Regulatory progress adds another bullish layer. Japan now classifies SHIB under the same flat crypto tax structure used for BTC and ETH. Meanwhile, Gemini enabled SHIB perpetual contracts for European traders. These steps mark a growing acceptance of SHIB within regulated frameworks.
Technical Outlook: Can SHIB Hold and Reverse?
SHIB sits at a major decision zone. Buyers defended support near the channel floor, triggering an open interest recovery that signals renewed confidence. If SHIB bounces, the roadmap points toward $0.00000840, $0.00001030, $0.00001160, $0.00001480, and $0.00001670.
Failure to hold support may send price toward $0.0000071 before forming a new base. Sentiment appears weak, but SHIB historically begins major breakouts from similar conditions. If futures inflows strengthen, the market could prepare for another sharp move.
BTC/USDT | Bitcoin Hit Major Demand, What’s Next?By analyzing the #Bitcoin chart on the daily timeframe, we can see that the price dropped exactly as expected and fell sharply to $80,500. Once it reached this major demand zone, buyers stepped in and Bitcoin bounced back to around $83,900.
As long as BTC can hold above the large demand zone between $74,000 and $81,000, we can expect the next bullish wave to start.
From my perspective, the trend is not bearish! this is still a healthy correction.
From the ATH at $126,200, Bitcoin has corrected 36%, which is completely normal in strong uptrends. Now it’s time to watch for decreasing selling pressure and the beginning of a stronger upside move. This analysis will be updated soon.
Please support me with your likes and comments to motivate me to share more analysis with you and share your opinion about the possible trend of this chart with me !
Best Regards , Arman Shaban
Shiba Inu Will Become Bullish Soon (3D)Shiba Inu is completing a very large correction across higher degrees and larger time frames.
It appears to be in a double or multiple correction, currently in the second phase. This phase itself is a complex correction, and it is now finishing wave C of this complex corrective structure.
The green zone is where Shiba can enter wave D in the higher time frames | a bullish wave.
Remember, we do not make decisions based on emotions; we analyze based on signals and indications.
For risk management, please don't forget stop loss and capital management
When we reach the first target, save some profit and then change the stop to entry
Comment if you have any questions
Thank You
