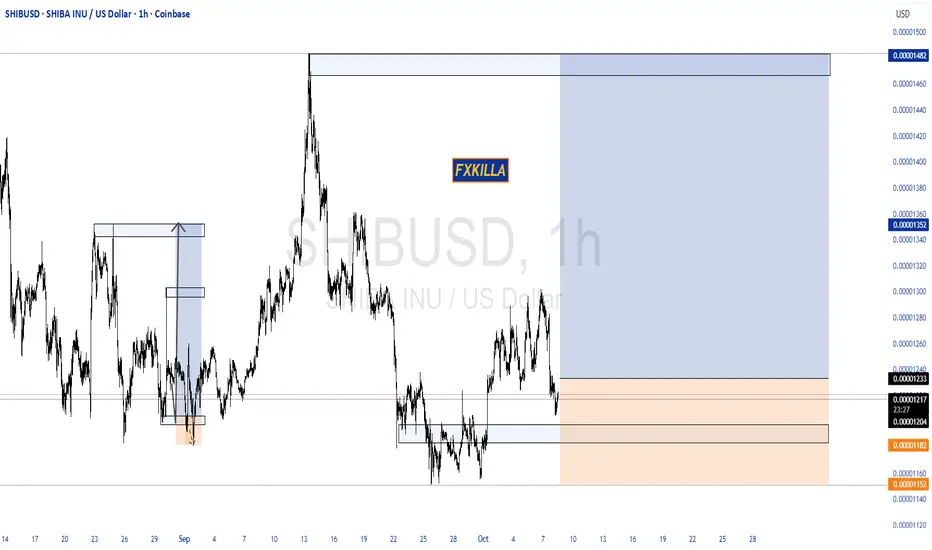
SHIBA INU HIGH PROBABILITY SETUP SOON!!!🚨 SHIBUSD HIGH PROBABILITY BUY SETUP 🚨
* Here We Can See Clearly The Next Potential Move For SHIBA Coming Hours/Days.
* Keep Your Eyes Close On Your Trading Positions.
* Happy PIP Hunting Traders.
FXKILLA.
Shibainu
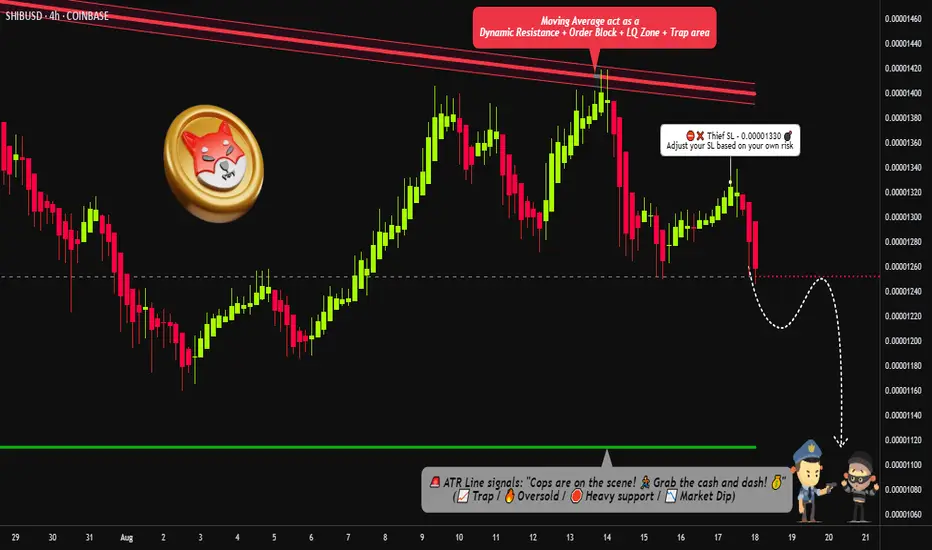
"SHIB Short Opportunity – Quick Heist, Faster Exit!"🔥🦊 SHIB/USD CRYPTO HEIST PLAN – THIEF TRADER STYLE 🚨💰
🔥 Thief OG’s Assemble – Tonight we Rob the SHIBA Vaults 🔥
👑 Dear Ladies & Gentlemen, Fellow Money Thieves, & OG Robbers 🏴☠️💸
Welcome to the Bearish Robbery Plan for SHIB/USD. Strap in, we’re going in with Thief Layering Strategy™ – multiple limit orders to maximize the loot.
📉 ENTRY PLAN – LAYERING STYLE
We don’t enter once… we layer the robbery. Multiple sell-limit orders stacked like a real thief’s toolkit:
💎 (0.00001250)
💎 (0.00001260)
💎 (0.00001270)
💎 (0.00001280)
👉 Add more layers if you want to spread your robbery wide. Remember: thieves don’t knock once, they pick every lock. 🔐
🛑 STOP LOSS (SL) – THIEF ESCAPE HATCH
Our Thief SL is parked at 0.00001330 🚨
But hey, every OG knows – adjust your SL based on your risk appetite & robbery style. 🏃♂️💨
🎯 TARGET – POLICE BARRICADE AHEAD 🚔
There’s heavy police resistance around 0.00001400… so don’t get greedy!
🎯 Our loot target is 0.00001120 💰 – grab it, stash it, and disappear before the cops surround the vault.
📜 MASTER HEIST PLAN
❌ Trend: Bearish (Shiba vault is weak & exposed)
🧨 Method: Layered Sell Orders (Limit Entries)
🏴☠️ Risk: Controlled by Thief SL
💰 Reward: Escape with stolen profit @0.00001120
⚠️ Trading Alert: Police patrol = market volatility (news, events). Avoid fresh robberies during major announcements. Use trailing SL to protect your stash.
💖 If you vibe with this Thief Trading Style™, hit that BOOST 🚀 & LIKE ❤️ to power up the robbery crew.
Together, we rob the market, escape clean, and celebrate with champagne & profits. 🥂💵
📌 Disclaimer: This is a Thief-Style Robbery Plan, not financial advice. Rob responsibly.

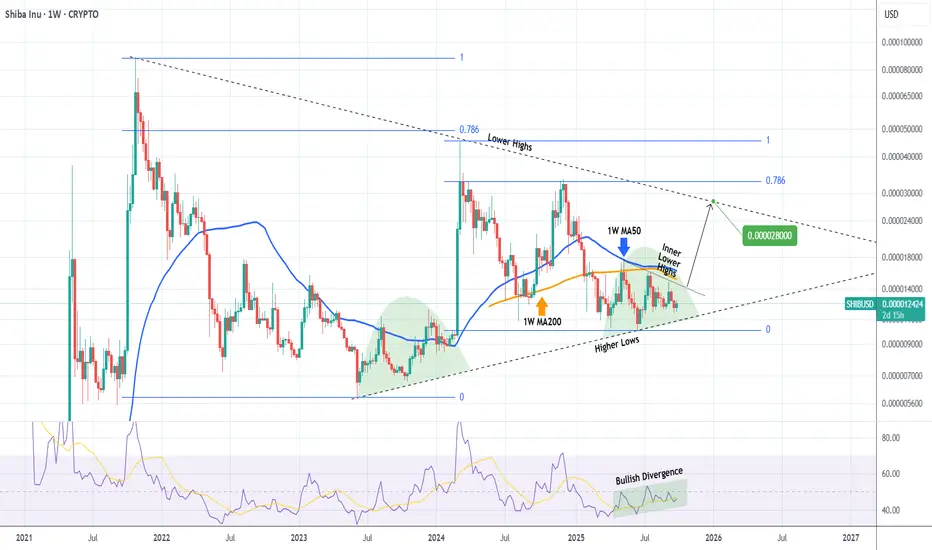
SHIBA Strong break-out expected, targeting 0.000028!Shiba Inu (SHIBUSD) has been trading within a Triangle pattern since the October 25 2021 Top of its previous Bull Cycle. The successive Lower Highs of the current Cycle have failed to make a new All Time High (ATH) and have 'trapped' the price action below its 1W MA50 (blue trend-line), is a similar Accumulation Phase on the Higher Lows like June 2023 - January 2024.
However, the 1W RSI has been rising within a Channel Up, showcasing a technical Bullish Divergence. If the price breaks above the Inner Lower Highs trend-line, it will be a first Buy Signal with confirmation coming above the 1W MA50. In that case, we expect at least a 0.000028 test of the Triangle's top (Lower Highs), still a conservative target given that the 2024 rally almost hit its 0.786 Fibonacci retracement level.
-------------------------------------------------------------------------------
** Please LIKE 👍, FOLLOW ✅, SHARE 🙌 and COMMENT ✍ if you enjoy this idea! Also share your ideas and charts in the comments section below! This is best way to keep it relevant, support us, keep the content here free and allow the idea to reach as many people as possible. **
-------------------------------------------------------------------------------
💸💸💸💸💸💸
👇 👇 👇 👇 👇 👇
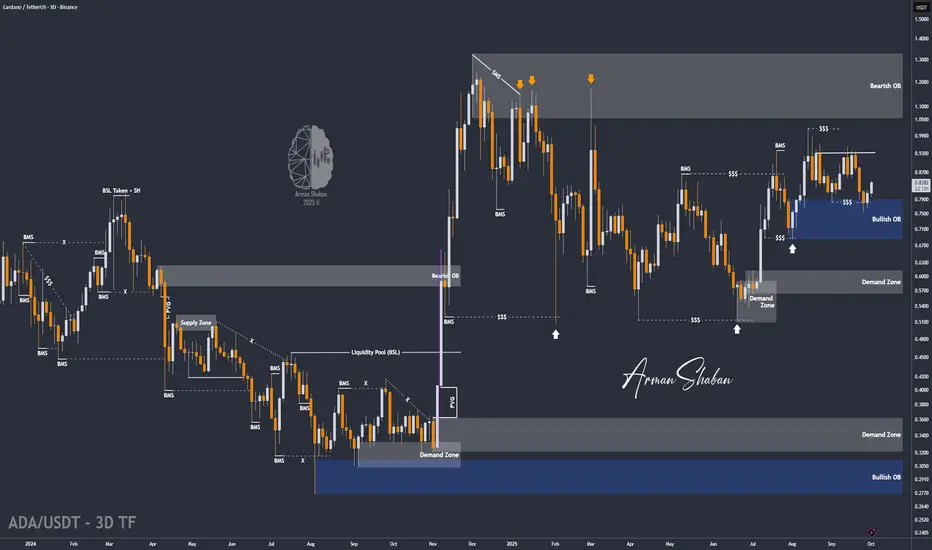
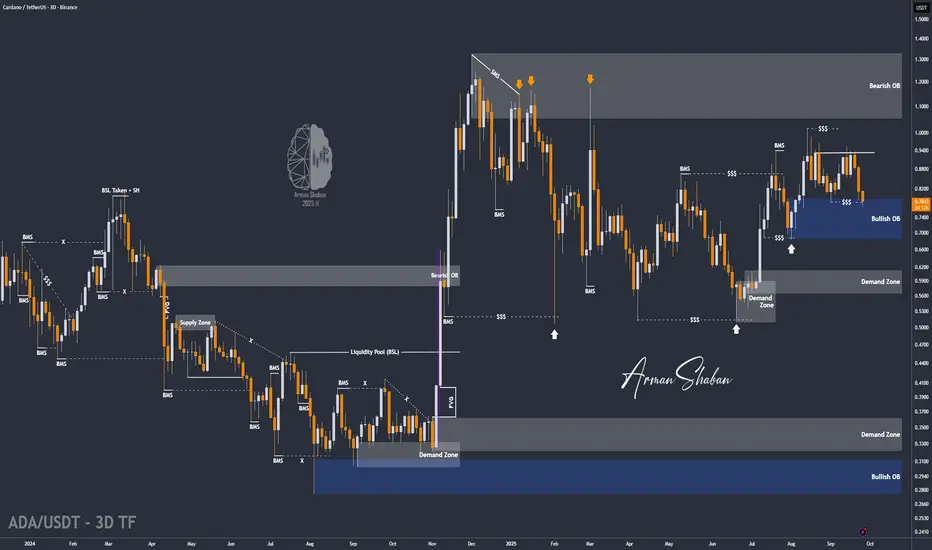
ADA/USDT | ADA Breakout Setup – More Upside AheadBy analyzing the Cardano (ADA) chart on the 3-day timeframe, we can see that the price has started to rise as expected and is now close to the first target at $0.85, giving us more than 11% gains from the previous analysis so far.
All other points from the last analysis remain valid. The next short-term targets are $0.95 and $1.00, while the mid-term targets are $1.05, $1.17, and $1.33.
Please support me with your likes and comments to motivate me to share more analysis with you and share your opinion about the possible trend of this chart with me !
Best Regards , Arman Shaban
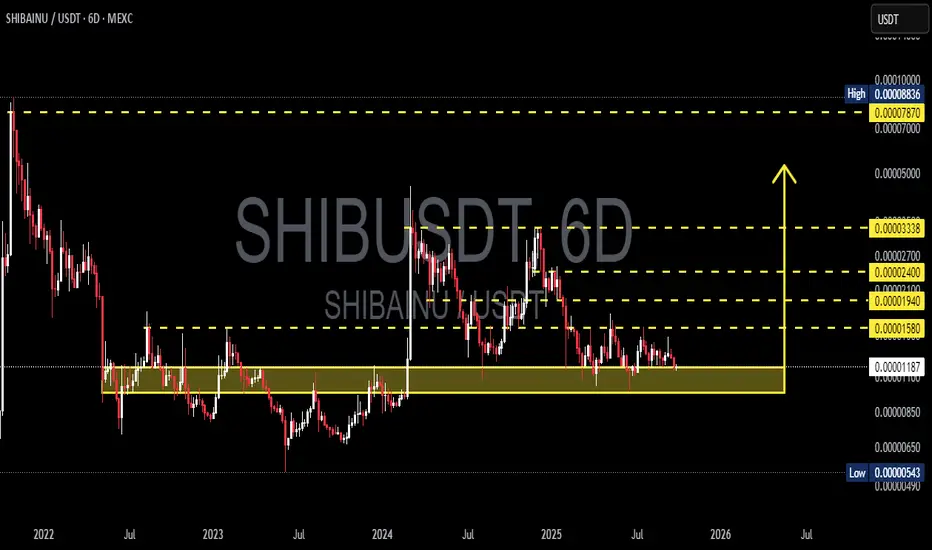
SHIBUSDT — A Major Move Will Be Decided From This Critical Zone!Overview
The 6D chart of SHIB/USDT shows a long-term consolidation that has been developing since 2022. Price is once again testing the key demand zone (0.00000850 – 0.00001183), an area that has acted as a strong support multiple times.
This zone is now a true “make or break level” — either SHIB rebounds for a major bullish wave, or it breaks down to much lower levels.
---
Structure & Price Pattern
1. Macro Downtrend
Since the ATH, SHIB has been printing lower highs, showing long-term seller dominance.
Yet, despite selling pressure, the demand zone has held — a sign that large buyers still exist here.
2. Extended Accumulation Zone
The yellow area (0.00000850 – 0.00001183) has acted as a base of accumulation since 2022.
Such prolonged consolidation often precedes explosive moves.
3. Clear Supply Levels
Resistance levels above price:
0.00001580 (initial breakout trigger)
0.00001940 → 0.00002400 → 0.00003338 (progressive bullish targets)
Major supply cluster at 0.00007870 – 0.00008836, which could be a magnet in case of a macro bullish reversal.
4. Volatility Contraction → Imminent Big Move
The 6D candles show a tightening range.
Classic signal of volatility compression, usually followed by a strong breakout or breakdown.
---
Bullish Scenario
Confirmation:
A breakout and 6D close above 0.00001580 with strong volume.
Targets:
0.00001940 → 0.00002400 → 0.00003338.
Ideal sequence:
Accumulation at support → breakout above resistance → retest as new support → rally continuation.
Reward potential: High risk-to-reward setup if the demand zone holds.
---
Bearish Scenario
Confirmation:
A breakdown below 0.00000850 with high volume.
Targets:
First: 0.00000543,
Then: potential new lows if liquidity is drained.
Risk:
If support fails, SHIB could enter a capitulation phase with accelerated downside.
---
Market Interpretation
Optimistic Buyers: See this as a long-term accumulation opportunity.
Cautious Sellers: A breakdown could trigger a steep sell-off.
Neutral Traders: Waiting for confirmed breakout/breakdown before committing larger positions.
---
Conclusion
SHIB is sitting at a critical zone that will define its macro direction into 2025–2026.
Holding support → opens path for multi-level rally.
Losing support → risk of deeper correction.
For long-term investors, this is the area to watch closely.
For swing traders, waiting for clear confirmation is the safer strategy.
---
#SHIB #SHIBUSDT #CryptoAnalysis #TechnicalAnalysis #SupportResistance #CryptoTrading #PriceAction #Accumulation #BreakoutSetup
BTC/USDT | BTC Bounce After $111K Dip – Liquidity Gap in FocusBy analyzing the Bitcoin chart on the 4-hour timeframe, we can see that after a heavy correction down to $111,000, the price found demand again and is now trading around $113,600.
I expect Bitcoin to continue rising to fill the liquidity gap, with the first target at $114,150. Other targets and scenarios will be shared tomorrow!
Please support me with your likes and comments to motivate me to share more analysis with you and share your opinion about the possible trend of this chart with me !
Best Regards , Arman Shaban
Will Shiba Inu bounce 18% from this key support level? Hello✌️
Let’s analyze Shiba Inu’s price action both technically and fundamentally 📈.
🔍Fundamental analysis:
Shiba Inu plans AI features and a new Layer-3 in July 2025 to cut costs and scale better.
If users adopt fast, SHIB could see demand grow like past upgrades.
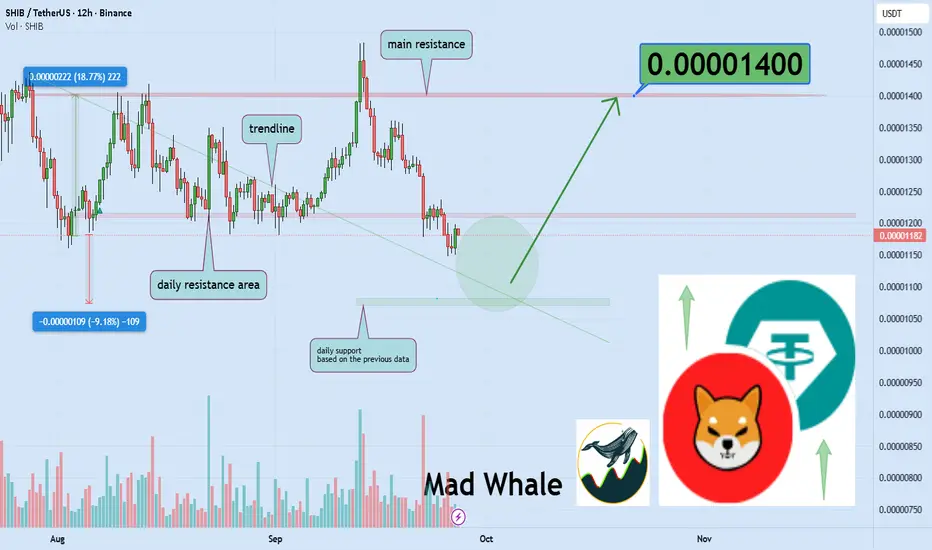
📊Technical analysis:
BINANCE:SHIBUSDT is approaching a critical daily support level along a solid trendline; if this zone holds, a potential upside of 18% toward $0.000014 could unfold. 📈🚀
📈Using My Analysis to Open Your Position:
You can use my fundamental and technical insights along with the chart. The red and green arrows on the left help you set entry, take-profit, and stop-loss levels, serving as clear signals for your trades.⚡️ Also, please review the TradingView disclaimer carefully.🛡
✨We put love into every post!
Your support inspires us 💛 Drop a comment we’d love to hear from you! Thanks, Mad Whale
ADA/USDT | ADA Testing $0.68–$0.78 Demand – Next Pump Ahead?By analyzing the Cardano (ADA) chart on the 3-day timeframe, we can see that the price started correcting as expected and has now reached $0.78, entering the key $0.68–$0.78 demand zone. Now we need to see whether this zone can stop ADA from dropping further.
If the price holds in this strong demand area, we could expect a big bullish move. The short-term targets are $0.85, $0.95, and $1.00, while the mid-term targets are $1.05, $1.17, and $1.33.
Please support me with your likes and comments to motivate me to share more analysis with you and share your opinion about the possible trend of this chart with me !
Best Regards , Arman Shaban
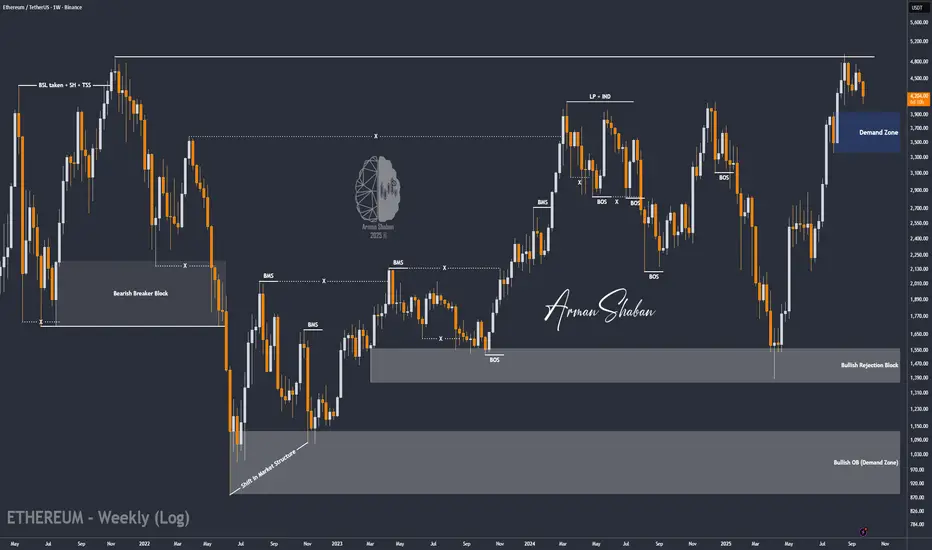
ETH/USDT | Correction Over? Big Rally Loading After Demand ZoneBy analyzing the Ethereum chart on the weekly timeframe, we can see that after Bitcoin’s heavy dump , ETH also corrected and is now trading around $4,200 .
Based on the previous analysis, the $3,300–$3,900 zone is still a key demand area. If the price enters this zone, I expect Ethereum to start its next bullish wave.
The possible upside targets for this rally are $5,100, $5,500, and $6,000.
Please support me with your likes and comments to motivate me to share more analysis with you and share your opinion about the possible trend of this chart with me !
Best Regards , Arman Shaban
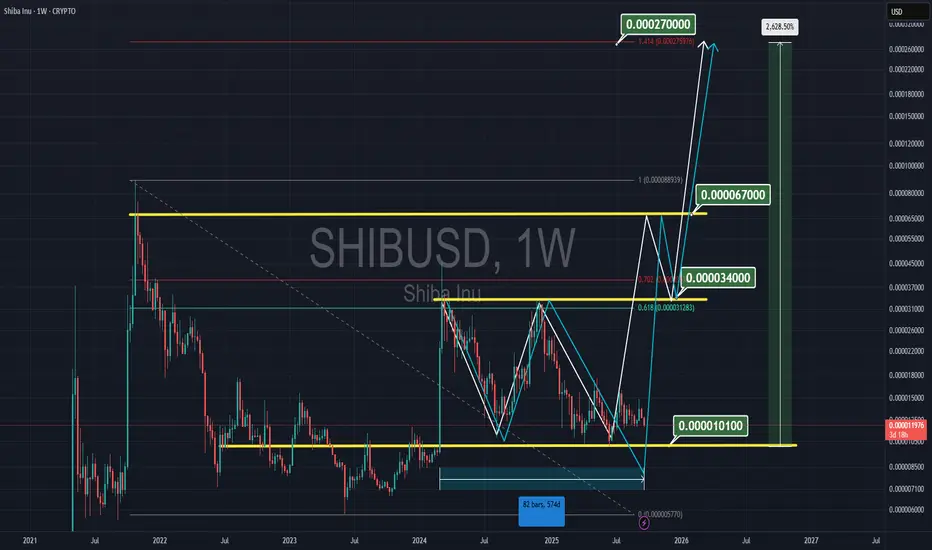
SHIBA TO $0.00027It's been 574 days; Shiba is trading between the 101 support and 34 resistance lines. I believe it's an accumulation zone, with a breakthrough imminent. My target is approximately 0.00027, at 1.4 of the Fibonacci.
SHIB Swing Long Idea - MemecoinSHIB Swing Long Idea
📊 Market Sentiment
Market sentiment remains strongly bullish as the FED is expected to deliver a 0.25% rate cut, with speculation building for a possible 0.5% cut in September. Monetary policy shifts are being driven by both inflation trends and weakening labor market data. The latest August and September job reports were soft, signaling that the economy is cooling rapidly. This environment continues to fuel expectations for a major bullish run in the weeks ahead.
📈 Technical Analysis
Price ran the HTF liquidity and got rejection from there.
Price created the Daily Demand after the run which confirms the price wants to seek higher liquidity.
Price made its first retest to Daily Demand and got rejection there, indicating that Daily Demand is valid and likely to send price higher.
Price is also supported by the Weekly Demand zone.
📌 Game Plan
1. Price to come back and retest the Weekly Demand zone at 0.0125$
2. Price to come back and retest the Daily Demand zone at 0.0117$
3. Price to run Equal Lows (purple line – 0.0117$) and close back above
4. Price to hit the 0.75 most discounted range level
🎯 Setup Trigger
I will be looking for a 4H break of structure before entering any position.
📋 Trade Management
Stoploss: Below the 4H swing low responsible for BOS
Targets:
• TP1: 0.0149$
• TP2: 0.016$
• TP3: 0.0175$
💬 Like, follow, and comment if you find this setup valuable!
⚠️ Disclaimer: This content is for informational and educational purposes only and does not constitute financial, investment, or trading advice. Always do your own research before making any financial decisions.

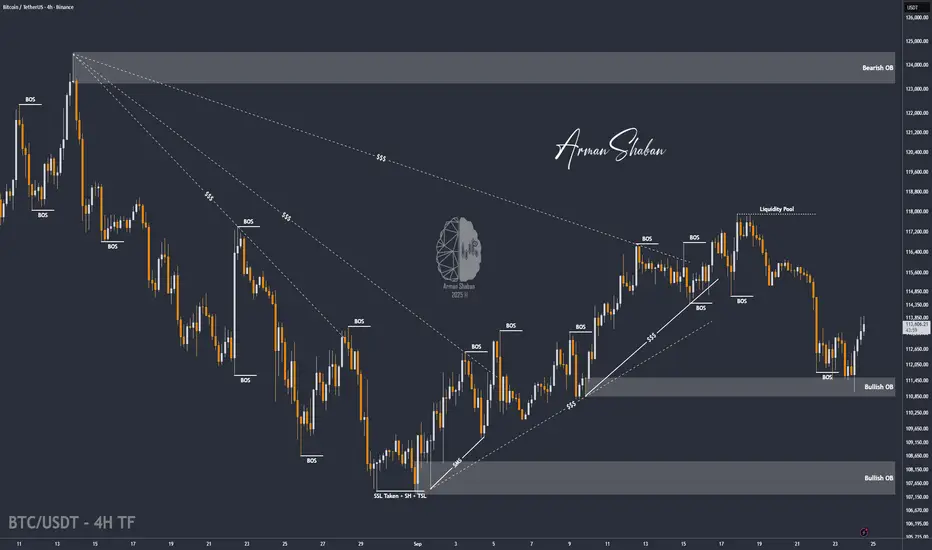
BTC/USDT | BTC Correction Done? Next Pump Loading…By analyzing the Bitcoin chart on the 4-hour timeframe, we can see that the price moved higher as expected, reaching around $118,000. After that, Bitcoin corrected down to the $115,000 demand zone. Once it touched this level, demand stepped in again and the price bounced back.
Currently, Bitcoin is trading around $116,000. If the price holds above the $114,400–$115,000 support zone, we can expect the start of another bullish wave.
Please support me with your likes and comments to motivate me to share more analysis with you and share your opinion about the possible trend of this chart with me !
Best Regards , Arman Shaban

SHIB Sell to BUYBINANCE:SHIBUSDT Market Update:
After a significant downtrend and following a descending trendline on the daily timeframe, SHIB finally broke out and saw an impressive pump.
However, I now anticipate a potential correction from the current level (the red box) down towards the green box. I expect to see strong support in that area, which could then lead to the next bullish leg higher.

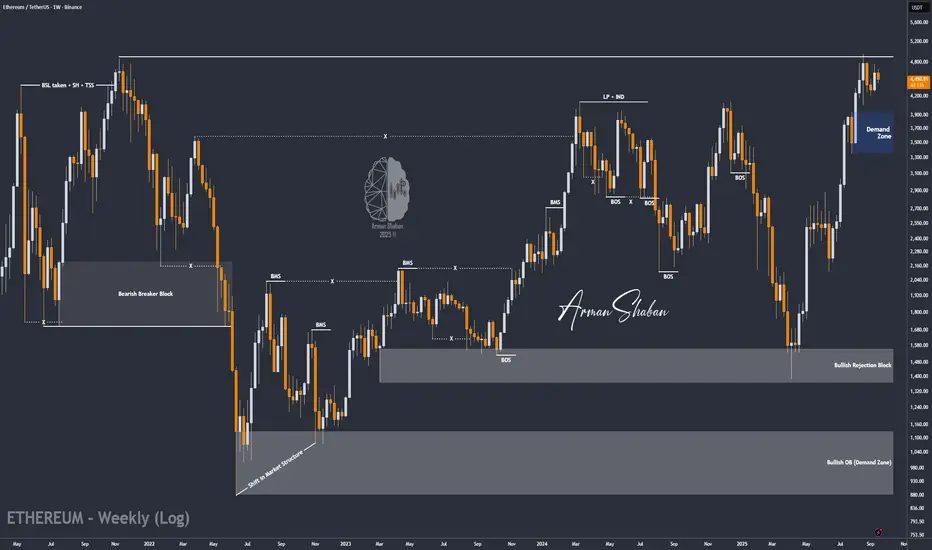
ETH/USDT | Ethereum Pullback Over? Next Stop New Highs! (READ)By analyzing the Ethereum chart on the weekly timeframe, we can see that after climbing to $4,700, the price pulled back and is now trading around $4,500. If ETH can hold above the $4,480 level, we can expect more upside.
However, today the market will be very volatile due to the Fed interest rate decision. With that condition in mind, the next possible bullish targets for Ethereum are $5,100, $5,500, and $6,000.
Please support me with your likes and comments to motivate me to share more analysis with you and share your opinion about the possible trend of this chart with me !
Best Regards , Arman Shaban
SHIB Breakout Incoming or Another Trap?Yello Paradisers, have you noticed how #SHIBUSDT has been quietly coiling at its demand zone while retail traders are completely distracted elsewhere? What looks like silence right now could easily turn into a violent move, and the next few candles will decide everything.
💎Price has been stuck inside a descending channel, repeatedly testing both support and resistance levels. Most recently, we’ve seen a classic double bottom formation at the demand zone, a structure that often signals the beginning of a larger bullish reversal if momentum follows through. As long as SHIB holds above this critical green zone, bulls have the upper hand.
💎The first confirmation would come with a clean breakout above the descending resistance, opening the road toward the minor resistance around $0.00001345. But the real target that could bring back FOMO is the resistance zone between $0.00001428 – $0.00001445. This area is packed with liquidity, and if taken out with strength, SHIB could trigger a sharp rally that leaves latecomers chasing.
💎On the flip side, the risk remains clear: if a daily close slips below the major demand zone, the bullish scenario gets invalidated, and SHIB could tumble toward fresh lows inside the channel. This is where inexperienced traders usually get trapped, overleveraged, and liquidated, while disciplined players quietly wait for the highest probability setups.
Stick to your plan, manage your risk, and don’t let emotions guide your entries. The market is designed to shake out the weak before rewarding the patient and prepared.
MyCryptoParadise
iFeel the success🌴

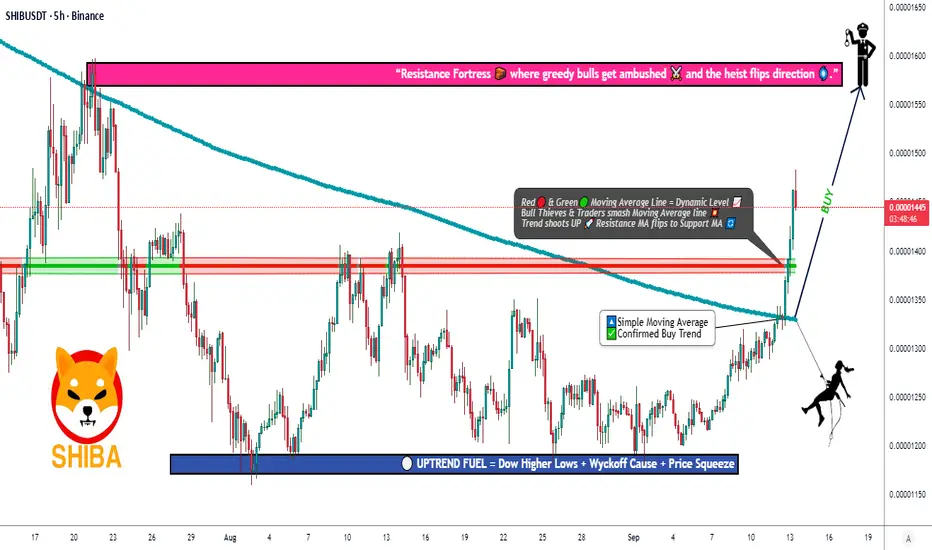
SHIB/USDT – Scaling Into a Bullish Breakout with Layered Entries🚀 SHIB/USDT (Shiba Inu) – Day Trade Setup 🐕🔥
📊 Trade Plan: Bullish Momentum
We’re spotting a Simple Moving Average breakout + Ichimoku Kijun confirmation, signaling that Shiba Inu might be gearing up for a bullish push. Momentum traders, this is where the action gets exciting. ⚡
🛠 Entry Plan
Using a layered limit order strategy (stacked entries), which allows better scaling in. Suggested layers below 👇:
0.00001400
0.00001420
0.00001440
0.00001460
(💡 You can increase or adjust the layers based on your own strategy.)
🛡 Stop Loss (Risk Guard)
A potential SL can be placed around 0.00001350, right after the breakout zone.
⚠️ Note: Adjust your SL according to your risk tolerance and personal trading style.
🎯 Target (Exit Strategy)
Upside target is placed at 0.00001580, where strong resistance and possible overbought conditions may appear. This is the "take profit & step out gracefully" zone.
⚠️ Reminder: This is not a fixed TP suggestion—manage your exits based on your own plan.
🔗 Related Pairs to Watch
Shiba Inu often correlates with other meme coins and ETH-related flows:
BINANCE:DOGEUSDT 🐶 (moves in tandem with SHIB sentiment)
BINANCE:PEPEUSDT 🐸 (new-gen meme coin hype correlations)
BINANCE:ETHUSDT 🔑 (Ethereum gas activity impacts SHIB ecosystem)
BINANCE:BTCUSDT 💰 (macro driver of overall crypto risk-on/off)
Watching these pairs together can give more conviction on momentum shifts.
✨ “If you find value in my analysis, a 👍 and 🚀 boost is much appreciated — it helps me share more setups with the community!”
#SHIB #SHIBA #CryptoTrading #Altcoins #MemeCoins #DayTrading #TradingView #Ichimoku #MovingAverage #SHIBUSDT
SHIBUSDTThe BINANCE:SHIBUSDT is moving in a trading range, but it could break either 0.00001300 or 0.00001190 and continue the trend after the breakout. I think it will be bullish because the larger time frame shows an uptrend.

Shiba Inu Sees Heavy Selling at 3-Week Price PeakShiba Inu is up 6.69% in the past week, with the token trading at $0.00001291. The meme coin is attempting to establish $0.00001285 as a support level, holding near its recent peak.
However, maintaining this momentum appears difficult without strong investor conviction. If selling continues, SHIB could drop toward $0.00001252 or even lower to $0.00001182, erasing recent gains.
On the flip side, if Shiba Inu price successfully defends the $0.00001285 support, a rebound may follow. In that case, SHIB could push toward $0.00001391, which would invalidate the bearish outlook and signal renewed strength.

SHIB Swing Long IdeaSHIB Swing Long Idea
📊 Market Sentiment
Market sentiment remains constructive, backed by the potential of a 0.25% rate cut at the upcoming FOMC meeting. With the USD weakening and global risk appetite improving, conditions continue to support upside momentum across crypto markets.
📈 Technical Analysis
Price has broken the LTF bullish trendline and is retracing lower.
However, the broader HTF trend remains strongly bullish, so I’m focused only on long setups.
I expect price to test the daily demand zone and sweep liquidity within it before initiating a move higher.
📌 Game Plan
1)Price to reach the daily demand zone at 0.00001177
2)Price to run the 0.00001164 daily swing liquidity level (major liquidity pool)
3)Price to retrace into the 0.75 max discount zone for confluence
🎯 Setup Trigger
I will look for a confirmed 4H break of structure before entering.
📋 Trade Management
Stoploss: Below the 4H swing low responsible for the BOS
Targets:
• TP1: $0.00001350
• TP2: $0.00001420
• TP3: $0.00001595
💬 Like, follow, and comment if you find this setup valuable!
⚠️ Disclaimer: This content is for informational and educational purposes only and does not constitute financial, investment, or trading advice. Always do your own research before making any financial decisions.

SOL/USDT | Is the Next Bullish Wave Coming? (READ THE CAPTION)By analyzing the Solana (SOL) chart on the daily timeframe, we can see that the bullish momentum is still intact, with the price currently trading around $207. I expect that after a short-term correction, we’ll likely see another bullish wave from Solana.
If the price resumes its upward move, the next potential targets are $218, $245, and $260.
Key demand zones to watch are $197–$204 and $173–$187.
Stay alert for reactions around these levels!
Please support me with your likes and comments to motivate me to share more analysis with you and share your opinion about the possible trend of this chart with me !
Best Regards , Arman Shaban

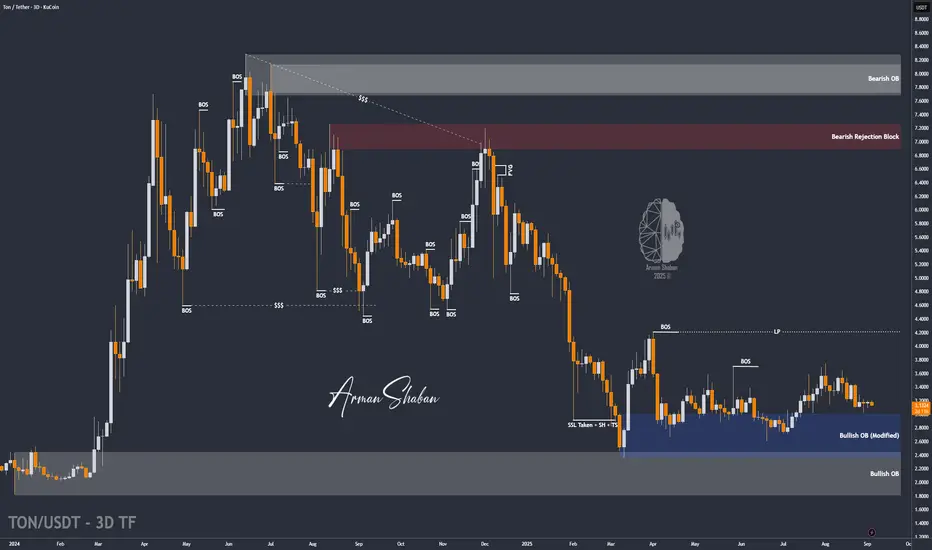
TON/USDT | TON Gearing Up for a Bullish Wave – Key Targets AheadBy analyzing the TON Coin chart on the 3-day timeframe, we can see that the price is currently consolidating around the key level of $3.13. This stabilization suggests that a strong bullish wave may be on the horizon.
The potential upside targets for this move are $3.63, $3.75, $4.20, and $4.68.
Keep an eye on this zone — momentum could kick in soon!
Please support me with your likes and comments to motivate me to share more analysis with you and share your opinion about the possible trend of this chart with me !
Best Regards , Arman Shaban
SHIBA +100%?? | BEST Buy OPPORTUNITYSHIBA has been in a downtrend for many weeks.
From here, upside is likely - especially if we look at the consecutive amount of "red" weekly candles (blue on this chart).
A 40% bounce zone is easily possible from this zone. Even at modest, 20% would be ideal:
____________
BYBIT:SHIBUSDT
