GBPNZD My Opinion! SELL!
My dear friends,
GBPNZD looks like it will make a good move, and here are the details:
The market is trading on 2.3415 pivot level.
Bias - Bearish
Technical Indicators: Supper Trend generates a clear short signal while Pivot Point HL is currently determining the overall Bearish trend of the market.
Goal - 2.3361
Recommended Stop Loss - 2.3445
About Used Indicators:
Pivot points are a great way to identify areas of support and resistance, but they work best when combined with other kinds of technical analysis
Disclosure: I am part of Trade Nation's Influencer program and receive a monthly fee for using their TradingView charts in my analysis.
———————————
WISH YOU ALL LUCK
Short!!!!

EURUSD: Bearish Continuation
Balance of buyers and sellers on the EURUSD pair, that is best felt when all the timeframes are analyzed properly is shifting in favor of the sellers, therefore is it only natural that we go short on the pair.
Disclosure: I am part of Trade Nation's Influencer program and receive a monthly fee for using their TradingView charts in my analysis.
❤️ Please, support our work with like & comment! ❤️

EURUSD Short: Trend Continuation After BreakdownHello, traders! The prior market structure for EURUSD has shifted to a bearish bias following a major reversal from the supply 2 level near 1.1835. The failure of a prior ascending channel initiated a new downtrend, which has been guiding the price auction lower through a series of complex breakdowns and consolidations.
Currently, the price action has shown significant weakness by breaking below the key horizontal support at the 1.1580 level. After multiple failed attempts by buyers to hold this level, sellers have successfully pushed the price below this critical area. The auction is now in a corrective pullback, approaching this broken support level from below for a classic retest.
My scenario for the development of events is a continuation of the downtrend. I believe this rally is a corrective retest that will fail upon reaching the 1.1580 level, which should now act as strong resistance. In my opinion, a confirmed rejection from this area will validate the bearish control and trigger the next impulsive move down. The take-profit is therefore set at 1.1510. Manage your risk.

GBPCAD: Short Signal Explained
GBPCAD
- Classic bearish pattern
- Our team expects retracement
SUGGESTED TRADE:
Swing Trade
Sell GBPCAD
Entry - 1.8766
Stop - 1.8787
Take - 1.8730
Our Risk - 1%
Start protection of your profits from lower levels
Disclosure: I am part of Trade Nation's Influencer program and receive a monthly fee for using their TradingView charts in my analysis.
❤️ Please, support our work with like & comment! ❤️

EURUSD: Down Trend will Continue in ChannelHello everyone, here is my breakdown of the current Euro setup.
Market Analysis
EURUSD has shifted to a bearish structure. This happened after a 'fake breakout' to a new All-Time High was aggressively sold off, leading to a sharp reversal. This sell-off has since been contained within a well-defined Downward Channel, creating a series of lower highs and lower lows.
Currently, the price is in a corrective rally phase. After finding support near the 1.1550 level, the price has bounced and is now directly testing the descending resistance line of this channel. This is a critical area where the dominant downtrend could resume.
My Scenario & Strategy
I'm looking for the price to complete this corrective rally, possibly with one small final push higher, and then show a clear sign of rejection from the resistance line. This failure to break out would be the key signal that sellers are stepping back in.
Therefore, the strategy is to watch for this rejection. A confirmed reversal would validate the short scenario. The primary target for the subsequent decline is 1.1525, aiming for a new low within the channel's structure, near the Support zone.
That's the setup I'm tracking. Thank you for your attention, and always manage your risk.

EURUSD: Downtrend will Continue in ChannelHello everyone, here is my breakdown of the current Euro setup.
Market Analysis
The price action has been clearly bearish, with the market being guided lower by a well-defined Downward Channel. This structure has been in place for some time, creating a series of lower highs and lower lows after a failed breakout above the 1.1775 Resistance.
Currently, the price is in a corrective rally after a 'fake breakout' below the major 1.1575 Support. This bounce from the lows is now carrying the price back up towards the upper boundary of the Downward Channel, which is a key area to watch for seller activity.
My Scenario & Strategy
My scenario is based on the expectation that the dominant downtrend will continue. I'm looking for this corrective rally to complete as it reaches the descending resistance line of the channel. The key signal would be a clear and strong rejection from this dynamic resistance, indicating that sellers are stepping back in to defend the trend.
Therefore, the strategy is to watch for this rejection. A confirmed failure to break higher would validate the short scenario. The primary target for the subsequent decline is 1.1550, which is located within the major Support zone.
That's the setup I'm tracking. Thank you for your attention, and always manage your risk.

GOLD Set To Fall! SELL!
My dear subscribers,
This is my opinion on the GOLD next move:
The instrument tests an important psychological level 4196.3
Bias - Bearish
Technical Indicators: Supper Trend gives a precise Bearish signal, while Pivot Point HL predicts price changes and potential reversals in the market.
Target - 4171.1
My Stop Loss - 4210.0
About Used Indicators:
On the subsequent day, trading above the pivot point is thought to indicate ongoing bullish sentiment, while trading below the pivot point indicates bearish sentiment.
Disclosure: I am part of Trade Nation's Influencer program and receive a monthly fee for using their TradingView charts in my analysis.
———————————
WISH YOU ALL LUCK

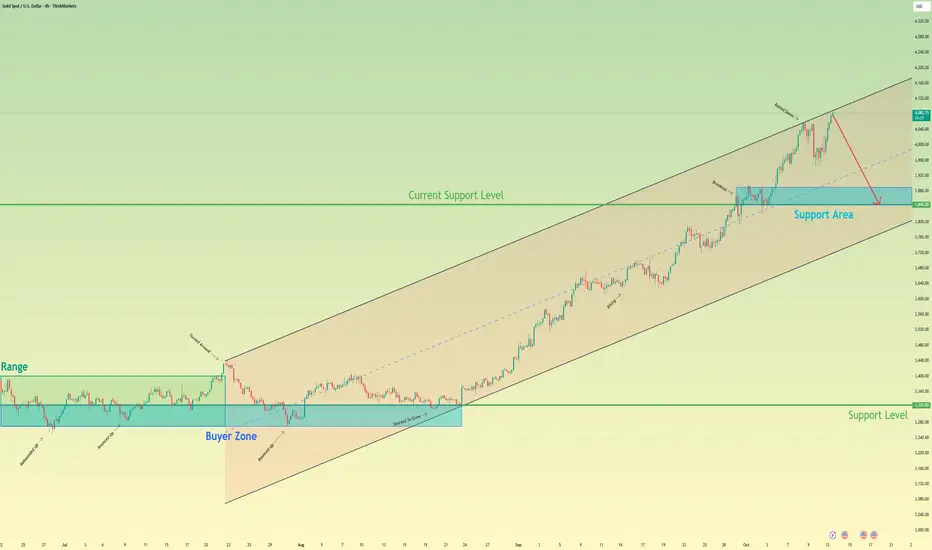
Gold can be Rejected from Channel ResistanceHello traders, I want share with you my opinion about Bitcoin. The market context for Gold has been strongly bullish since the price action broke out of a prolonged consolidation range that was based in the 3325 buyer zone. This structural shift initiated a new uptrend, with the price action for XAU having been guided higher within a well-defined upward channel. The asset has shown significant strength, breaking through multiple levels, including the current support level at 3845. Currently, after completing a strong impulsive wave, the price is trading very close to the resistance line of this upward channel, consolidating near the highs. In my mind, this is a logical area for the bullish momentum to pause and for a correction to begin. I expect the price to soon be rejected from this channel's upper boundary and initiate a new corrective swing to the downside. I think a confirmed reversal from this area would validate the short scenario. Therefore, I have placed my TP at the 3845 level, targeting the recent breakout area, which should now act as the first major support. Please share this idea with your friends and click Boost 🚀
Disclaimer: As part of ThinkMarkets’ Influencer Program, I am sponsored to share and publish their charts in my analysis.
EURUSD Is Very Bearish! Sell!
Take a look at our analysis for EURUSD.
Time Frame: 4h
Current Trend: Bearish
Sentiment: Overbought (based on 7-period RSI)
Forecast: Bearish
The market is approaching a key horizontal level 1.162.
Considering the today's price action, probabilities will be high to see a movement to 1.158.
P.S
Overbought describes a period of time where there has been a significant and consistent upward move in price over a period of time without much pullback.
Like and subscribe and comment my ideas if you enjoy them!

USDJPY Is Very Bearish! Sell!
Take a look at our analysis for USDJPY.
Time Frame: 1h
Current Trend: Bearish
Sentiment: Overbought (based on 7-period RSI)
Forecast: Bearish
The price is testing a key resistance 152.178.
Taking into consideration the current market trend & overbought RSI, chances will be high to see a bearish movement to the downside at least to 151.305 level.
P.S
Please, note that an oversold/overbought condition can last for a long time, and therefore being oversold/overbought doesn't mean a price rally will come soon, or at all.
Like and subscribe and comment my ideas if you enjoy them!

GOLD SELLERS WILL DOMINATE THE MARKET|SHORT
GOLD SIGNAL
Trade Direction: short
Entry Level: 4,193.33
Target Level: 4,093.81
Stop Loss: 4,259.20
RISK PROFILE
Risk level: medium
Suggested risk: 1%
Timeframe: 1h
Disclosure: I am part of Trade Nation's Influencer program and receive a monthly fee for using their TradingView charts in my analysis.
✅LIKE AND COMMENT MY IDEAS✅

GBP/USD BEST PLACE TO SELL FROM|SHORT
Hello, Friends!
It makes sense for us to go short on GBP/USD right now from the resistance line above with the target of 1.324 because of the confluence of the two strong factors which are the general downtrend on the previous 1W candle and the overbought situation on the lower TF determined by it’s proximity to the upper BB band.
Disclosure: I am part of Trade Nation's Influencer program and receive a monthly fee for using their TradingView charts in my analysis.
✅LIKE AND COMMENT MY IDEAS✅

EUR/USD BEARS ARE STRONG HERE|SHORT
Hello, Friends!
Previous week’s green candle means that for us the EUR/USD pair is in the uptrend. And the current movement leg was also up but the resistance line will be hit soon and upper BB band proximity will signal an overbought condition so we will go for a counter-trend short trade with the target being at 1.157.
Disclosure: I am part of Trade Nation's Influencer program and receive a monthly fee for using their TradingView charts in my analysis.
✅LIKE AND COMMENT MY IDEAS✅

SELL XAUUSDIn todays session and next few days we are monitoring gold for sell set ups. Our entry at current price 4070 and stops above 4120. Target is 3870. Tight stops just incase. Use proper risk management.

Crude Oil Long 5 Stacks Fundamental & 5 Stacks Technical. I am trading Short Crude oil as we have 5 stacks fundamental bearish and 5 stacks technical bearish. We are trading with some extreme confluence here and it appears to be a perfect trade. We know know there is no such thing as a perfect trade however when all the starts align we don't think twice. Many things can happen but when you stack fundamentals and technical to such a strong degree we take action. Short crude oil with 1.00 Stop Loss and 3.00 take profit.

SI1! - Dancing on the SILVER Tracks🔱 I like risk. Specially when it's skewed to my favor 🔱
WL1 has been reached, and the market is wildly overextended.
Is it crazy to stand in front of this speeding train?
Absolutely — if you don’t know when to jump.
I’ve done my warm-up, and I’m ready to leap off the rails the moment it gets too close, too fast.
My move is with options — that means my risk is defined, my escape route mapped.
I would never short the underlying — not in a million years.
Now let’s see if this setup earns me that Steak & Lobster target.

EURGBP: Bearish Continuation & Short Signal
EURGBP
- Classic bearish formation
- Our team expects pullback
SUGGESTED TRADE:
Swing Trade
Short EURGBP
Entry - 0.8708
Sl - 0.8716
Tp - 0.8692
Our Risk - 1%
Start protection of your profits from lower levels
Disclosure: I am part of Trade Nation's Influencer program and receive a monthly fee for using their TradingView charts in my analysis.
❤️ Please, support our work with like & comment! ❤️

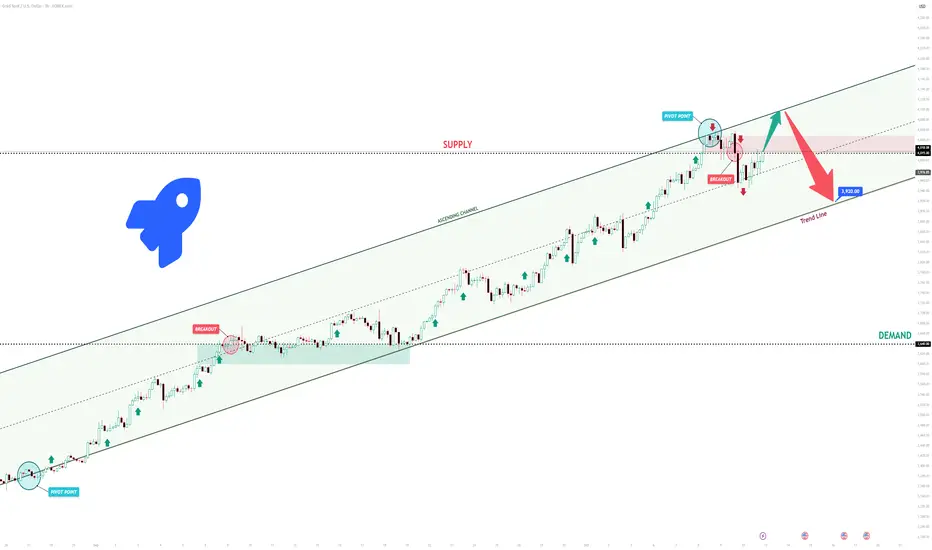
XAUUSD Short: Correction to 3920 Expected from the HighsHello, traders! The price auction for XAUUSD has been dominated by a strong bullish trend, which has been clearly defined by a large ascending channel. The market has consistently made higher highs and higher lows, breaking through key resistance levels like 3640 and showing that the buyer initiative has been in firm control of the trend.
Currently, the auction has reached a major point of contention at the 4015 supply level. The price is consolidating here, right below the upper resistance line of the ascending channel, after a failed initial attempt to break higher. This area represents a significant test for the continuation of the uptrend.
My scenario for the development of events is a 'blow-off top' followed by a correction. I believe the price will make one final push, breaking the 4015 level to touch the channel's upper resistance line. In my opinion, this move will be exhaustive, and a sharp reversal will occur from that line. The take-profit is therefore set at 3920, targeting a retest of the nearby trend line. Manage your risk!
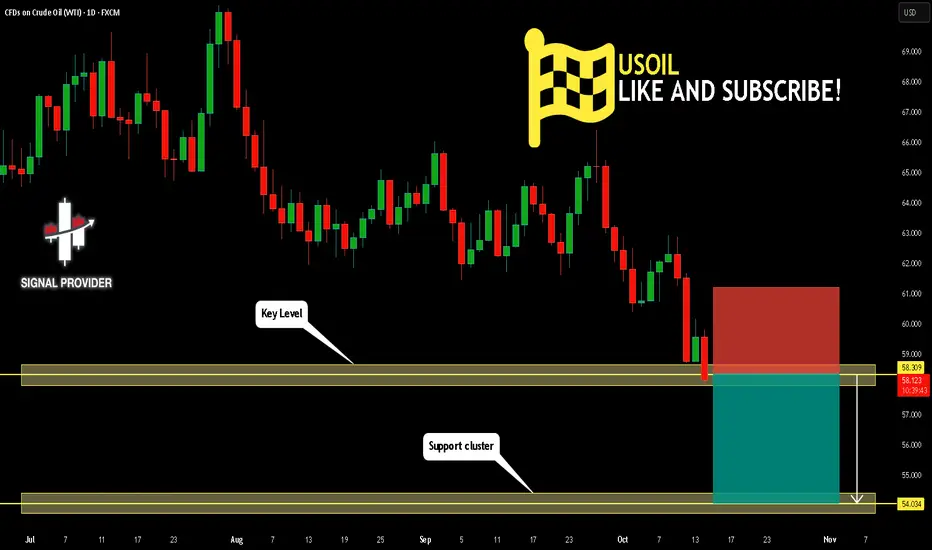
USOIL Will Go Lower From Resistance! Short!
Take a look at our analysis for USOIL.
Time Frame: 1D
Current Trend: Bearish
Sentiment: Overbought (based on 7-period RSI)
Forecast: Bearish
The price is testing a key resistance 58.309.
Taking into consideration the current market trend & overbought RSI, chances will be high to see a bearish movement to the downside at least to 54.034 level.
P.S
We determine oversold/overbought condition with RSI indicator.
When it drops below 30 - the market is considered to be oversold.
When it bounces above 70 - the market is considered to be overbought.
Like and subscribe and comment my ideas if you enjoy them!
EURUSD The Target Is DOWN! SELL!
My dear subscribers,
My technical analysis for EURUSD is below:
The price is coiling around a solid key level - 1.1618
Bias - Bearish
Technical Indicators: Pivot Points Low anticipates a potential price reversal.
Super trend shows a cler sell, giving a perfect indicators' convergence.
Goal - 1.1584
My Stop Loss - 1.1637
About Used Indicators:
By the very nature of the supertrend indicator, it offers firm support and resistance levels for traders to enter and exit trades. Additionally, it also provides signals for setting stop losses
Disclosure: I am part of Trade Nation's Influencer program and receive a monthly fee for using their TradingView charts in my analysis.
———————————
WISH YOU ALL LUCK

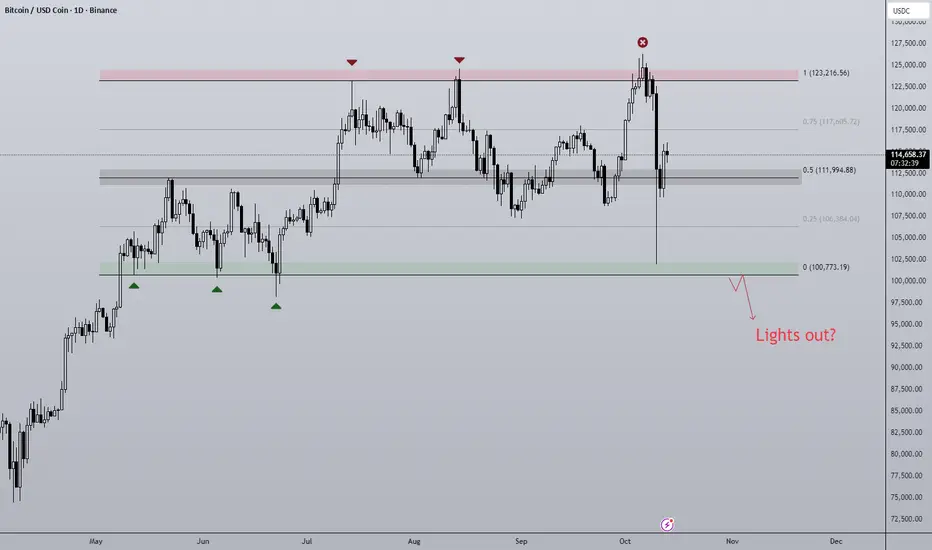
Post Flash-Crash BTC Despite such a large sell-off event, has the outlook on BTC actually changed? Structurally BTC remains very much rangebound with two clearly definable halves of the range. That is until Fridays move off the back of a Tariff Tweet from President Trump causing a liquidation event similar to that of April earlier this year and the Covid crash of 2020.
Bitcoin was less effected when compared to altcoins as is usually the case, some majors dropping as much as 80% in a single 1h candle! An entire bear market in an afternoon. Bitcoin on most exchanges fell roughly 20% on the news and eventually found support at range lows ($100,000), a significant amount of this drop got bought up and so BTC finds itself hovering around range midpoint.
To me this is a no trade zone initially, there is no clear directional bias that is actionable at this time but I am looking for clues as to where price may be going next:
- Should BTC stay above midpoint the next clear resistance level is 0.75 ($117,605). On the lower time frames the trend is bearish, 0.75 would be a good place for the bears to defend.
- A loss of the midpoint would open the door to backfilling the wick, this could get ugly as on the higher time frames a new lower low and price acceptance lower would signal a bearish shift in structure. Calls for "the top is in" will get much louder and so will the 4 year cycle theory comparisons.
- A V-shaped recovery and move straight to the highs would be max pain after such a brutal move down. Although IMO it's the least likely I would not rule it out.
EURAUD: Bearish Continuation is Highly Probable! Here is Why:
The charts are full of distraction, disturbance and are a graveyard of fear and greed which shall not cloud our judgement on the current state of affairs in the EURAUD pair price action which suggests a high likelihood of a coming move down.
Disclosure: I am part of Trade Nation's Influencer program and receive a monthly fee for using their TradingView charts in my analysis.
❤️ Please, support our work with like & comment! ❤️

GBPNZD Under Pressure! SELL!
My dear friends,
Please, find my technical outlook for GBPNZD below:
The instrument tests an important psychological level 2.3302
Bias - Bearish
Technical Indicators: Supper Trend gives a precise Bearish signal, while Pivot Point HL predicts price changes and potential reversals in the market.
Target - 2.3210
About Used Indicators:
Super-trend indicator is more useful in trending markets where there are clear uptrends and downtrends in price.
Disclosure: I am part of Trade Nation's Influencer program and receive a monthly fee for using their TradingView charts in my analysis.
———————————
WISH YOU ALL LUCK
