JTO-USDT FULL TARGET BOOOOOOMHello friends 😍
💁♂️ This time let's go to the JTO-USDT cryptocurrency
✅ And again a great analysis and a precise area
💁♂️ We introduced the apple cryptocurrency from the area marked with a red circle and were monitoring
👉 We expected the price to reach the lower purple area
👉 After a little price fluctuation, the price reached the area with a Sharpe movement and crossed that area too
✅The total drop rate from the marked area was about 85%, which was very amazing 🔥🔥🔥
✅The drop rate to the lower purple area was also 60% 🔥🔥🔥
What's better than this? 😍
Yes, this was a great analysis with great results 💖⭐
💁♂️ Has anyone used this analysis?
🤔Let me know your thoughts
⚠️ None of the analysis is a recommendation to buy or sell, but simply my personal opinions on the charts. You can use the charts and choose any that interest you and take a position if you wish.
To support me, I would appreciate it if you boost the analysis and share it with your friends so that I can analyze it with more energy for you, my dears. Thank you all. 💖
Short!!!!

HYPE-USDT SHORT FULLTARGET BOOOOMHello friends 😍
💁♂️ This time let's go to the Hype-USDT cryptocurrency
✅ A great analysis and a precise area
The HYPE-USDT supply area was clearly identified for you
The price reached the QM-LEVEL area with an upward movement and then touched the targets one after the other
Almost all three targets were touched and the price fell by about 46.5% 🔥🔥🔥🔥
Yes, this was a great analysis with a great result
🤔Has anyone used this analysis?
👉Share your thoughts with me
⚠️ None of the analysis is a recommendation to buy or sell, but simply my personal opinions on the charts. You can use the charts and choose any that interest you and take a position if you wish.
To support me, I would appreciate it if you boost the analysis and share it with your friends so that I can analyze it with more energy for you, my dears. Thank you all. 💖

GBPJPY Will Move Lower! Short!
Here is our detailed technical review for GBPJPY.
Time Frame: 8h
Current Trend: Bearish
Sentiment: Overbought (based on 7-period RSI)
Forecast: Bearish
The market is testing a major horizontal structure 204.181.
Taking into consideration the structure & trend analysis, I believe that the market will reach 202.632 level soon.
P.S
We determine oversold/overbought condition with RSI indicator.
When it drops below 30 - the market is considered to be oversold.
When it bounces above 70 - the market is considered to be overbought.
Like and subscribe and comment my ideas if you enjoy them!

Q-USDT SHORT FULL TARGET BOOOOOOM Hello friends 😍😍
💁♂️ Another great analysis
Let's see together a great update of the Q-USDT cryptocurrency that touched all the targets
🔥🔥🔥It fell from a little above the blue area that I specified and then touched all three targets with a 73.5% drop. What's better than this? 🔥🔥🔥
Has anyone used this analysis?
⚠️ None of the analysis is a recommendation to buy or sell, but simply my personal opinions on the charts. You can use the charts and choose any that interest you and take a position if you wish.
To support me, I would appreciate it if you boost the analysis and share it with your friends so that I can analyze it with more energy for you, my dears. Thank you all. 💖

GBP/CAD BEARS ARE GAINING STRENGTH|SHORT
Hello, Friends!
The BB upper band is nearby so GBP-CAD is in the overbought territory. Thus, despite the uptrend on the 1W timeframe I think that we will see a bearish reaction from the resistance line above and a move down towards the target at around 1.864.
Disclosure: I am part of Trade Nation's Influencer program and receive a monthly fee for using their TradingView charts in my analysis.
✅LIKE AND COMMENT MY IDEAS✅

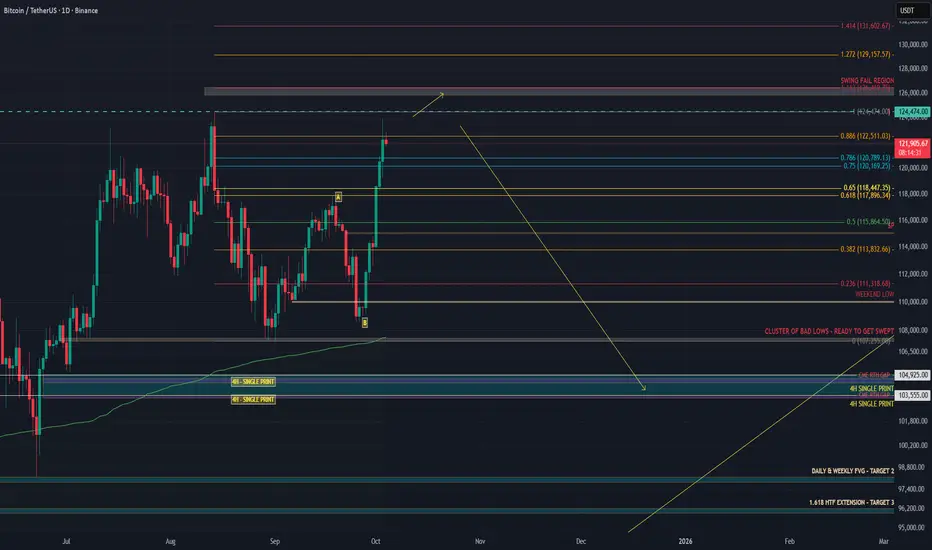
BITCOIN’S FINAL TRAP – THE SENTIMENT SWITCH IS COMING FASTIn my last BTC post I said a dump was likely based on data, and that thesis still stands. If anything, it’s even stronger now. .
On 13 August, CME made a high at 123,590.
That high was weak, no excess, flat TPO top, unfinished auction.
Binance topped at 124,474, Coinbase at 124,522.
CME opened with a gap down, leaving that poor high unrepaired with unfinished business and clean liquidity sitting above.
From 26 September, BTC started grinding up.
I expected a run of the 18 September high and a reversal around 118–119K, but price extended the move to the 1.618 extension. See my last analysis.
Structure was weak, spot CVD flat, futures CVD ripping, open interest climbing.
That shows perps were driving it, not real spot demand.
This week CME finally cleaned it up.
CME ripped through 125,025, taking out the August high at 123,590.
That level matched the old highs on Binance and Coinbase almost perfectly.
CME swept the old poor high left behind by spot and perps, completing the auction.
This is typical CME behavior, it hunts untested reference points during RTH and often reverses right after.
Flow data confirms the setup:
Spot CVD down means real buyers not following.
Stablecoin CVD pushing up means overleveraged longs chasing.
Coin-margined CVD rolling means profit taking or hedge flow.
Open interest flat at the top means trapped longs with no squeeze left.
The move looks like a leveraged markup driven by perps, cleaned up by CME liquidity, and now hanging on air.
CME repaired the August inefficiency, swept the prior spot high, and left another weak high with no excess, a textbook sign of distribution.
There’s still a chance we see one more SFP around 126K before momentum flips, but unless spot demand picks up aggressively, that should be the final liquidity grab.
My targets are 104K and 99K if 104K fails to hold, with potential for an even deeper drop beyond that level.
COAI — the most manipulated coin on the market
Pair: COAIUSDT.P (perps)
Bias: Short (tactical)
Thesis TL;DR: Timeline is flashing classic manipulation tells—crowded leverage, public pleas to delist, an “unknown wallet” repeatedly selling into rips, and whipsaw liquidations both sides. I’m fading spikes into prior ATH supply with tight invalidation and scale-out targets.
Why this is a “manipulation” setup (from social timeline)
Open manipulation meme: “PAWNZI” label and multiple posts calling COAI a casino-like gamble.
Crowded leverage: Repeated notes of huge liquidations on both sides and a callout that a mass liquidation triggers near $5.83 if price nukes.
Smart seller behavior: “Unknown wallet” reportedly sells repeatedly into strength, trapping late buyers.
Public escalation: Users tagging @CZ_Binance and demanding review/delist for “price manipulation.”
Behavioral fuel: Screenshots of 292x PnL and regret posts (airdrops sold “too early” → FOMO) stoke late momentum buyers—perfect exit liquidity.
Failed short triggers: Traders trying to frontrun the short got chopped/stopped BE multiple times—signals engineered liquidity hunts before the real move.
Levels I care about
Short interest zone: $6.90–$7.20 (prior ATH pocket / squeeze fuel). Expect wicks.
Momentum pivot: $6.50 — loss/reclaim flips intraday bias.
Liquidation magnet: $5.83 (widely-circulated “mass liq” level = honey pot).
Deeper shelves: $5.60 and $5.20 — prior reaction zones where trapped longs may puke.
Trade plan (short bias)
Entry: Scale $6.90 → $7.20 on spikes; add on 15–60m structure breakdown below $6.50.
Invalidation: 4H close > $7.50 (acceptance above prior high = out, no debate).
Targets:
T1: $6.10 (first shelf; take partials, pay yourself)
T2: $5.83 (liquidation cluster—expect violent reaction)
T3: $5.60 → stretch to $5.20 if momentum accelerates
Risk: Size so that full-stop loss = ~1% account risk. If we wick >$7.35 and snap back in-range, I’ll re-engage with smaller size.
Execution notes:
Expect engineered squeezes before any trend. Let price tag your zone—don’t chase.
If $6.90 is reclaimed after a breakdown, reduce risk—possible bear trap/reset.
Watch perp funding/OI — extreme positive funding into resistance = better fade.
Narrative context (why fade)
The public narrative is doing the heavy lifting: casino vibes, “unknown wallet” selling into pumps, and open calls for Binance action.
Retail euphoria (292x screenshots, airdrop regret posts) provides late long fuel.
If the crowd is staring at $5.83 as the “big liq,” market often hunts it—either as a clean flush or a spoofed front-run to trap shorts. I’ll manage partials proactively there.

Euro may Break the 1.1550 Support LevelHello traders, I want share with you my opinion about Euro. The dominant market pressure for the Euro has been bearish since the price failed to sustain its rally to the 1.1920 high. This reversal initiated a significant downward trend for EURUSD, characterised by the breakdown of several key market structures, including the prior upward channel and the major 1.1740 resistance level. Currently, this bearish impulse has brought the price down to the major horizontal support level at 1.1550, an area which also coincides with a historical buyer zone. The price is now in a consolidation phase, attempting a minor corrective bounce from this support. In my mind, this bounce appears weak and lacks the momentum to signal a true reversal. I expect that this small upward movement will fail to attract significant buying interest and will soon be overcome by the prevailing selling pressure. I think a failure of this bounce will lead to a decisive breakdown below the 1.1550 support level. Therefore, I have placed my TP at 1.1510, targeting a new structural low in what I believe is a continuation of the primary downward trend. Please share this idea with your friends and click Boost 🚀
Disclaimer: As part of ThinkMarkets’ Influencer Program, I am sponsored to share and publish their charts in my analysis.

EURGBP: Weak Market & Bearish Continuation
Our strategy, polished by years of trial and error has helped us identify what seems to be a great trading opportunity and we are here to share it with you as the time is ripe for us to sell EURGBP.
Disclosure: I am part of Trade Nation's Influencer program and receive a monthly fee for using their TradingView charts in my analysis.
❤️ Please, support our work with like & comment! ❤️

AUDNZD Under Pressure! SELL!
My dear friends,
My technical analysis for AUDNZD is below:
The market is trading on 1.1421 pivot level.
Bias - Bearish
Technical Indicators: Both Super Trend & Pivot HL indicate a highly probable Bearish continuation.
Target - 1.1391
Recommended Stop Loss - 1.1436
About Used Indicators:
A pivot point is a technical analysis indicator, or calculations, used to determine the overall trend of the market over different time frames.
Disclosure: I am part of Trade Nation's Influencer program and receive a monthly fee for using their TradingView charts in my analysis.
———————————
WISH YOU ALL LUCK

GOLD: Short Signal Explained
GOLD
- Classic bearish setup
- Our team expects bearish continuation
SUGGESTED TRADE:
Swing Trade
Short GOLD
Entry Point - 3998.8
Stop Loss - 4008.4
Take Profit - 3977.7
Our Risk - 1%
Start protection of your profits from lower levels
Disclosure: I am part of Trade Nation's Influencer program and receive a monthly fee for using their TradingView charts in my analysis.
❤️ Please, support our work with like & comment! ❤️
EURAUD Massive Short! SELL!
My dear friends,
Please, find my technical outlook for EURAUD below:
The price is coiling around a solid key level - 1.7666
Bias - Bearish
Technical Indicators: Pivot Points Low anticipates a potential price reversal.
Super trend shows a clear sell, giving a perfect indicators' convergence.
Goal - 1.7631
Safe Stop Loss - 1.7684
About Used Indicators:
The pivot point itself is simply the average of the high, low and closing prices from the previous trading day.
Disclosure: I am part of Trade Nation's Influencer program and receive a monthly fee for using their TradingView charts in my analysis.
———————————
WISH YOU ALL LUCK

EURGBP Is Going Down! Short!
Take a look at our analysis for EURGBP.
Time Frame: 1D
Current Trend: Bearish
Sentiment: Overbought (based on 7-period RSI)
Forecast: Bearish
The market is approaching a key horizontal level 0.869.
Considering the today's price action, probabilities will be high to see a movement to 0.864.
P.S
The term oversold refers to a condition where an asset has traded lower in price and has the potential for a price bounce.
Overbought refers to market scenarios where the instrument is traded considerably higher than its fair value. Overvaluation is caused by market sentiments when there is positive news.
Like and subscribe and comment my ideas if you enjoy them!

EURUSD Will Fall! Short!
Take a look at our analysis for EURUSD.
Time Frame: 1D
Current Trend: Bearish
Sentiment: Overbought (based on 7-period RSI)
Forecast: Bearish
The market is approaching a key horizontal level 1.174.
Considering the today's price action, probabilities will be high to see a movement to 1.158.
P.S
Overbought describes a period of time where there has been a significant and consistent upward move in price over a period of time without much pullback.
Like and subscribe and comment my ideas if you enjoy them!

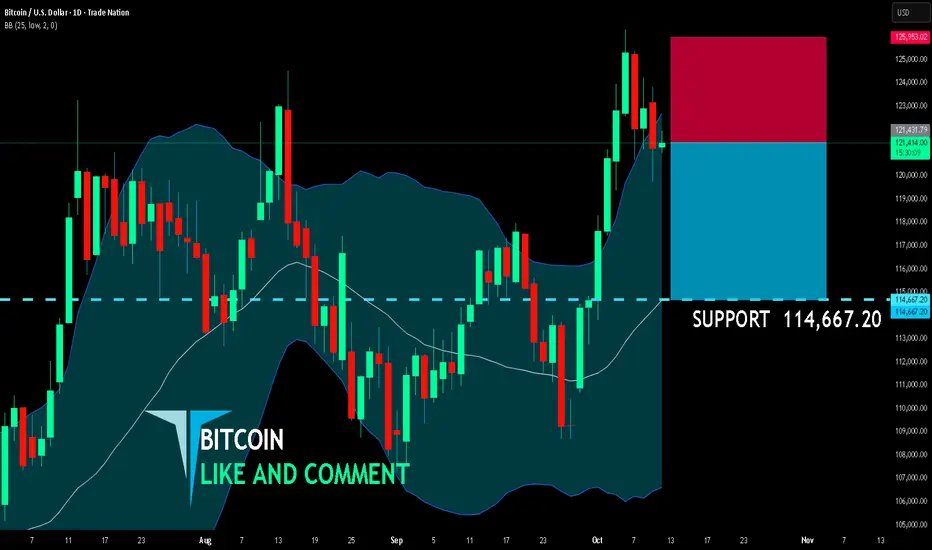
BITCOIN SENDS CLEAR BEARISH SIGNALS|SHORT
BITCOIN SIGNAL
Trade Direction: short
Entry Level: 121,431.79
Target Level: 114,667.20
Stop Loss: 125,953.02
RISK PROFILE
Risk level: medium
Suggested risk: 1%
Timeframe: 1D
Disclosure: I am part of Trade Nation's Influencer program and receive a monthly fee for using their TradingView charts in my analysis.
✅LIKE AND COMMENT MY IDEAS✅
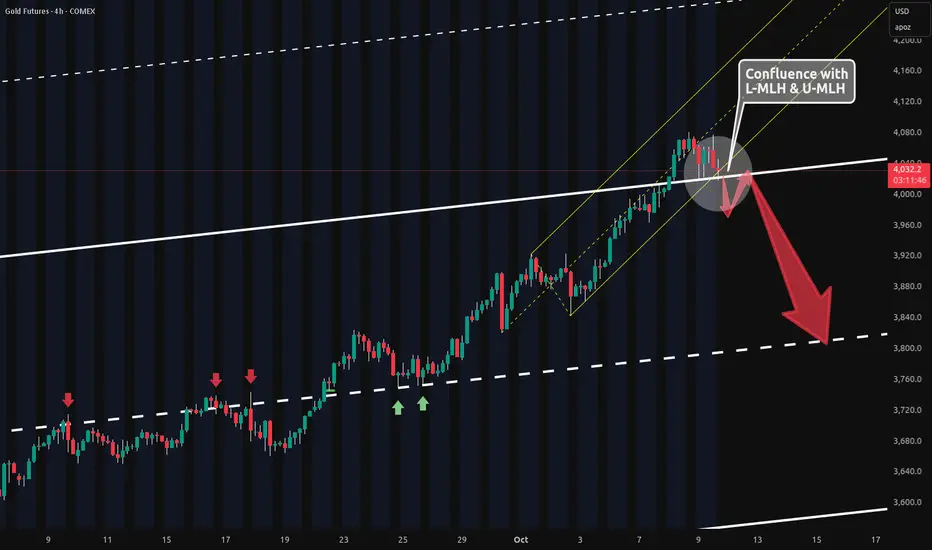
Gold 4h Potential Short Confluence🔱 Just wanted to highlight this confluence 🔱
The yellow L-MLH and white U-MLH are lining up to form a potential short setup.
Today’s selling pressure is also giving an early warning signal.
If we open and close below the white U-MLH, we’ll likely retest it before any major drop.
Shorting this move will require a decent stop, given the inherent volatility. So maybe a play with an Options Strategy would be a more secure way.
Let’s see if the party finally takes a breather.
GOLD Technical Analysis! SELL!
My dear subscribers,
GOLD looks like it will make a good move, and here are the details:
The market is trading on 4039.4 pivot level.
Bias - Bearish
My Stop Loss - 4047.6
Technical Indicators: Both Super Trend & Pivot HL indicate a highly probable Bearish continuation.
Target - 4026.3
About Used Indicators:
The average true range (ATR) plays an important role in 'Supertrend' as the indicator uses ATR to calculate its value. The ATR indicator signals the degree of price volatility.
Disclosure: I am part of Trade Nation's Influencer program and receive a monthly fee for using their TradingView charts in my analysis.
———————————
WISH YOU ALL LUCK

SILVER Will Go Lower From Resistance! Sell!
Here is our detailed technical review for SILVER.
Time Frame: 4h
Current Trend: Bearish
Sentiment: Overbought (based on 7-period RSI)
Forecast: Bearish
The market is on a crucial zone of supply 4,932.1.
The above-mentioned technicals clearly indicate the dominance of sellers on the market. I recommend shorting the instrument, aiming at 4,773.8 level.
P.S
Overbought describes a period of time where there has been a significant and consistent upward move in price over a period of time without much pullback.
Like and subscribe and comment my ideas if you enjoy them!

GOLD BEST PLACE TO SELL FROM|SHORT
GOLD SIGNAL
Trade Direction: short
Entry Level: 4,035.38
Target Level: 3,914.49
Stop Loss: 4,115.72
RISK PROFILE
Risk level: medium
Suggested risk: 1%
Timeframe: 6h
Disclosure: I am part of Trade Nation's Influencer program and receive a monthly fee for using their TradingView charts in my analysis.
✅LIKE AND COMMENT MY IDEAS✅

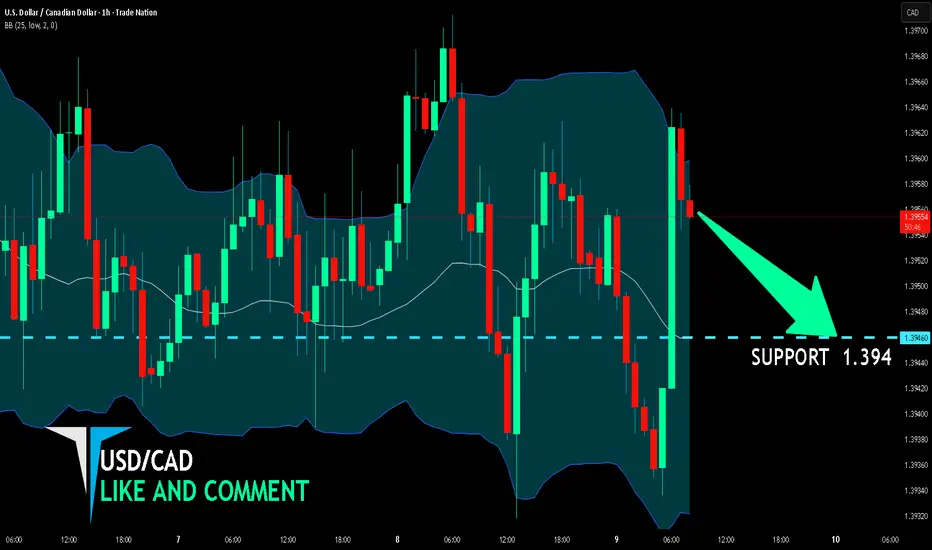
USD/CAD BEARS WILL DOMINATE THE MARKET|SHORT
Hello, Friends!
We are going short on the USD/CAD with the target of 1.394 level, because the pair is overbought and will soon hit the resistance line above. We deduced the overbought condition from the price being near to the upper BB band. However, we should use low risk here because the 1W TF is green and gives us a counter-signal.
Disclosure: I am part of Trade Nation's Influencer program and receive a monthly fee for using their TradingView charts in my analysis.
✅LIKE AND COMMENT MY IDEAS✅
GBP/AUD BEARS ARE STRONG HERE|SHORT
Hello, Friends!
We are going short on the GBP/AUD with the target of 2.029 level, because the pair is overbought and will soon hit the resistance line above. We deduced the overbought condition from the price being near to the upper BB band. However, we should use low risk here because the 1W TF is green and gives us a counter-signal.
Disclosure: I am part of Trade Nation's Influencer program and receive a monthly fee for using their TradingView charts in my analysis.
✅LIKE AND COMMENT MY IDEAS✅

GBP/CAD SELLERS WILL DOMINATE THE MARKET|SHORT
Hello, Friends!
GBP/CAD pair is in the uptrend because previous week’s candle is green, while the price is obviously rising on the 12H timeframe. And after the retest of the resistance line above I believe we will see a move down towards the target below at 1.867 because the pair overbought due to its proximity to the upper BB band and a bearish correction is likely.
Disclosure: I am part of Trade Nation's Influencer program and receive a monthly fee for using their TradingView charts in my analysis.
✅LIKE AND COMMENT MY IDEAS✅

USD/JPY - Multi timeframe Analysis🔥 USD/JPY — Bit More In-Depth, Still Punchy
🧭 Weekly (HTF Bias)
Trend up. We just tagged 153–154 weekly supply (prior rejection zone).
Two paths:
Clean break & hold above 154 → 156–157 magnet 🎯
Wick/reject here → corrective dip toward 149–150 (old highs + demand).
📆 Daily (Structure Check)
Clear BOS up; daily 50-EMA + structure stack around 149.2–150.2 = prime buy-the-dip area.
Expect a liquidity sweep under 150, then reclaim → rerun 153.5–154.
Daily close <147.8–147.5 = momentum shift ⚠️
⏰ 8H (Execution Map)
Rising liquidity trendline guiding pullbacks.
Buy Zone 1: 149.2–150.2 (trendline + demand + prior high).
Buy Zone 2 (deep discount): 144.8–145.6 if we get a full flush.
Above 151.5–152 and holding? Bulls may skip the deep dip and rocket straight back into 153–154 🚀
🧩 Trade Plan (rules-ish)
Primary idea (pro-trend):
Wait for sweep/reclaim of 150 on LTF (H1/H4 close back above).
Entry : 149.8–150.2 retest.
TPs: 152.2 → 153.5 → 154.8–155.2.
Invalidation : H4 close <149.0 (safer: <147.8).
Alt (only if strong breakout):
H4 close >154.2 + retest holds → ride to 156.0–157.0.
Counter-trend scalp (advanced): bearish wick rejection inside 153.5–154.2 → tag 151.6–150.8 “snack stop,” then look to flip long.
Summary : Bias bullish, hunting a dip to 150 for continuation. Lose 147.8 and the script changes.
