NZDJPY Trading Opportunity! SELL!
My dear friends,
Please, find my technical outlook for NZDJPY below:
The instrument tests an important psychological level 88.173
Bias - Bearish
Technical Indicators: Supper Trend gives a precise Bearish signal, while Pivot Point HL predicts price changes and potential reversals in the market.
Target - 87.931
Recommended Stop Loss - 88.340
About Used Indicators:
Super-trend indicator is more useful in trending markets where there are clear uptrends and downtrends in price.
Disclosure: I am part of Trade Nation's Influencer program and receive a monthly fee for using their TradingView charts in my analysis.
———————————
WISH YOU ALL LUCK
Short!!!!

NZDUSD Is Going Down! Sell!
Here is our detailed technical review for NZDUSD.
Time Frame: 1D
Current Trend: Bearish
Sentiment: Overbought (based on 7-period RSI)
Forecast: Bearish
The market is on a crucial zone of supply 0.577.
The above-mentioned technicals clearly indicate the dominance of sellers on the market. I recommend shorting the instrument, aiming at 0.563 level.
P.S
The term oversold refers to a condition where an asset has traded lower in price and has the potential for a price bounce.
Overbought refers to market scenarios where the instrument is traded considerably higher than its fair value. Overvaluation is caused by market sentiments when there is positive news.
Like and subscribe and comment my ideas if you enjoy them!

USOIL SENDS CLEAR BEARISH SIGNALS|SHORT
USOIL SIGNAL
Trade Direction: short
Entry Level: 62.52
Target Level: 60.15
Stop Loss: 64.10
RISK PROFILE
Risk level: medium
Suggested risk: 1%
Timeframe: 7h
Disclosure: I am part of Trade Nation's Influencer program and receive a monthly fee for using their TradingView charts in my analysis.
✅LIKE AND COMMENT MY IDEAS✅

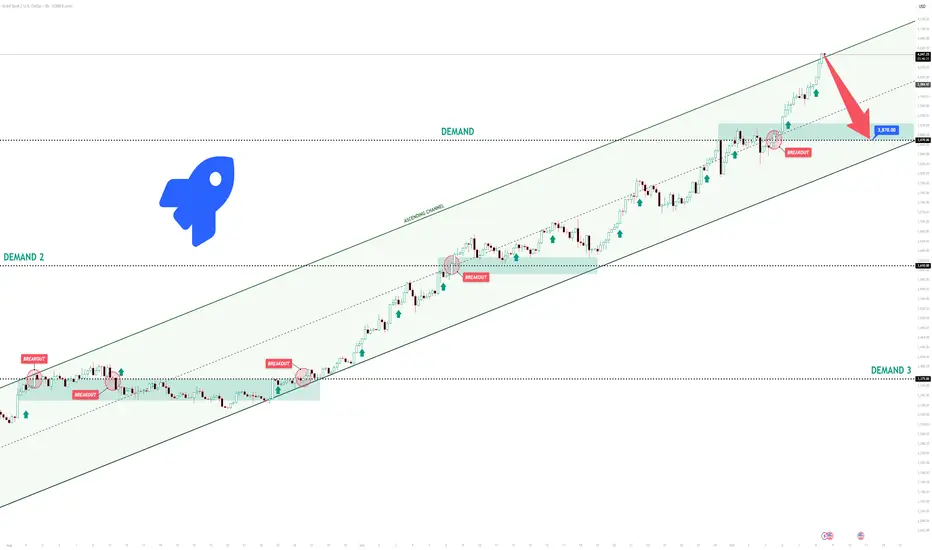
XAUUSD Short: Targeting 3870 on a Corrective MoveHello, traders! The price auction for XAUUSD has been moving within a clearly defined ascending channel, reflecting a persistent and well-structured bullish trend. This pattern has effectively guided the market upward, with buyers maintaining firm control and driving the price through several significant resistance levels, including 3375 and 3610. Such momentum highlights the continued dominance of bullish sentiment in recent sessions.
At the moment, the price is approaching a critical inflection point near the upper boundary of this channel. Following an aggressive rally, XAUUSD is now testing the channel’s ascending supply line, an area that often acts as a strong resistance zone. This is typically where selling pressure begins to surface, as traders look to capitalize on overextended bullish moves.
My short-term expectation is a corrective phase. I anticipate that the price may attempt a brief breakout above the channel’s resistance, forming a potential “fake breakout” trap for late buyers, before reversing lower. A confirmed rejection from this region would likely trigger a pullback toward the 3870 area, which aligns with prior structural support. Accordingly, I have placed my take-profit target at 3870. Manage your risk!
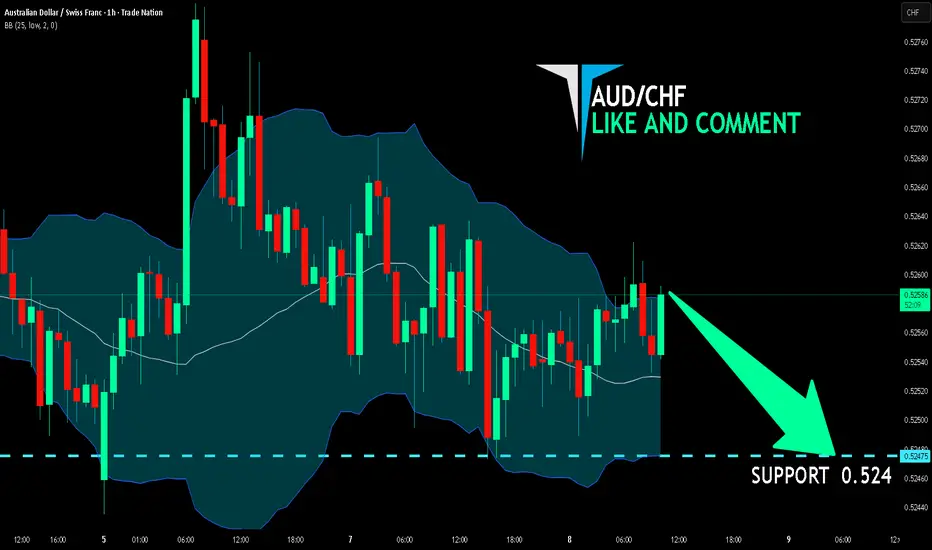
AUD/CHF BEARISH BIAS RIGHT NOW| SHORT
Hello, Friends!
It makes sense for us to go short on AUD/CHF right now from the resistance line above with the target of 0.524 because of the confluence of the two strong factors which are the general downtrend on the previous 1W candle and the overbought situation on the lower TF determined by it’s proximity to the upper BB band.
Disclosure: I am part of Trade Nation's Influencer program and receive a monthly fee for using their TradingView charts in my analysis.
✅LIKE AND COMMENT MY IDEAS✅
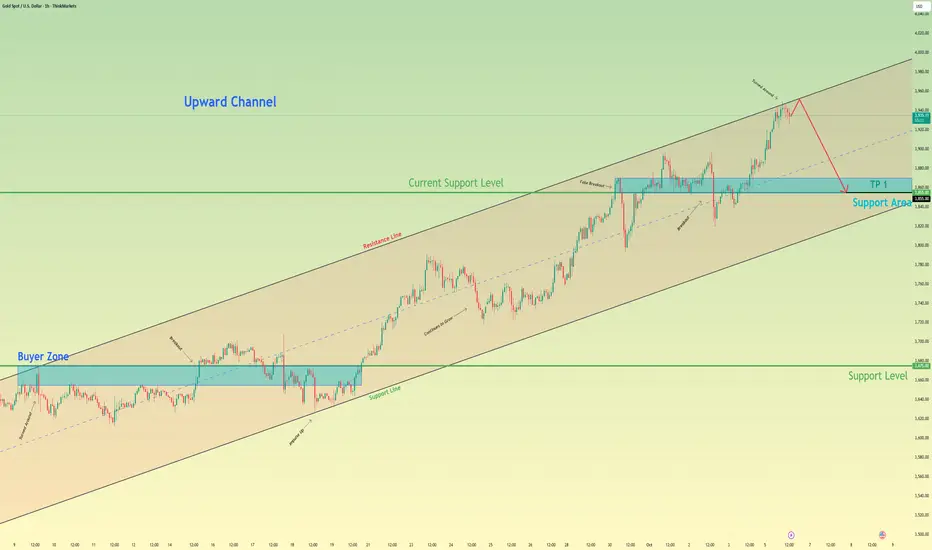
Gold can Start a Correction Towards 3855 SupportHello traders, I want share with you my opinion about Gold. The broader market context for Gold has been decidedly bullish since the price reversed and broke out from a prior descending channel. This structural shift established a new uptrend, which has since been neatly contained within a well-defined ascending channel. The price action for XAU has been creating a clear sequence of higher highs and higher lows. Currently, the asset is trading very close to the resistance line of this ascending channel, an area where sellers may re-emerge. My strategy is based on the expectation that the price will reach this line, be rejected, and then begin a corrective decline. I think after such a strong run, a pullback is a probable scenario. A confirmed reversal from this upper boundary would validate the short idea. Therefore, I have placed my TP at the 3855 current support level. Please share this idea with your friends and click Boost 🚀
Disclaimer: As part of ThinkMarkets’ Influencer Program, I am sponsored to share and publish their charts in my analysis.
Bitcoin Hodlers are happy campers - BUT🕷️ 🌕 🦇 In Switzerland it’s now 11:50 PM 🕷️ 🌕 🦇
I’m tired from a long day in the markets, but I feel I have to get this one out because it’s important for many of you holding Bitcoin.
In my last post, I said we’d run upward to reach the Hagopian Line, and here we are, even higher.
We’ve just tagged the U-MLH for the third time.
There’s an old pattern from the futures markets that farmers once noticed. It’s called the “Three Drives” pattern.
The old farmers knew that when this pattern appeared, it was time to hedge their crops, or add to their hedge.
When I was a student at MarketGeometry, Tim Morge explained this pattern, and ever since it’s served me well as a signal for a trend reversal.
I don’t know exactly how this will help each of you, but I’m sure it’s worth a heads-up. Whether you decide to hedge, close your positions, or just HODL until the sun burns out, it’s something to keep in mind.
Meanwhile, the Harvest Moon is shining into my office tonight, twinkling with a strange grin... 🌕
Time for me to rest.
Good night, everyone.
🌾 🌾 🌾 🌾 🌾 🌾 🌾

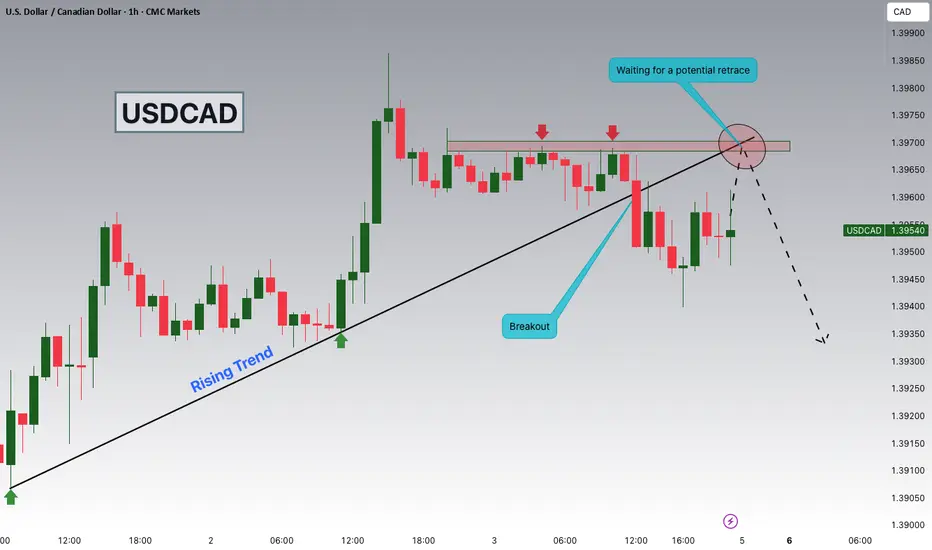
USDCAD Breakout and Potential RetraceHey Traders, in tomorrow's trading session we are monitoring USDCAD for a selling opportunity around 1.39700 zone, USDCAD was trading in an uptrend and successfully managed to break it out. Currently is in a correction phase in which it is approaching the retrace area at 1.39700 support and resistance area.
Trade safe, Joe.
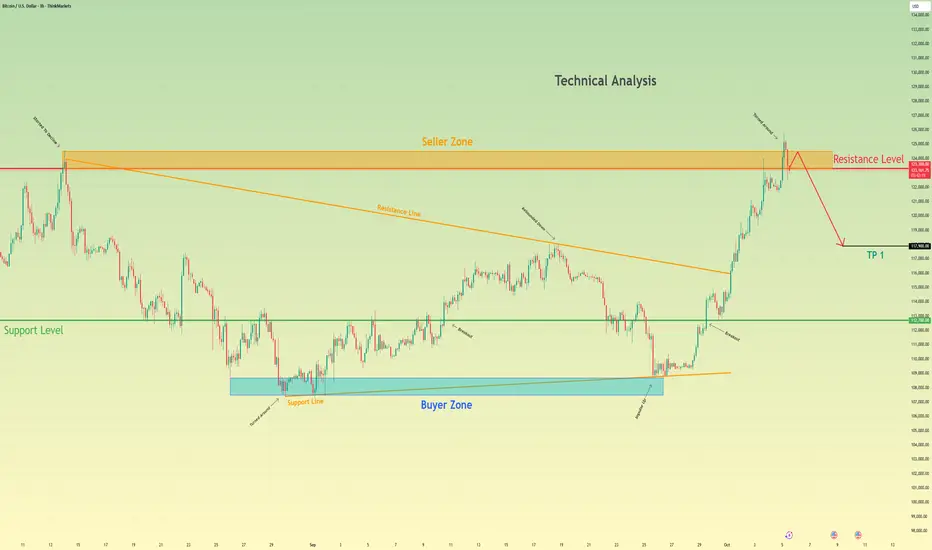
Bitcoin can Fail its Retest and Fall to 117900 pointsHello traders, I want share with you my opinion about Bitcoin. The market for Bitcoin has shown a significant sign of exhaustion and reversal after establishing a new all-time high at the 126000 level. Although this peak was preceded by a strong breakout from a prior downward wedge, the rally failed to sustain, leading to a sharp sell-off. This has shifted the market structure to a bearish bias, confirmed by a decisive breakdown below the key 123300 level. Currently, the price of BTC is in a minor corrective phase, rallying back towards this broken structure. This price action is setting up a classic retest of former support as new resistance. In my mind, this retest presents a high-probability opportunity for sellers. I expect that the price will make a small upward movement into the seller zone near 123300. I think a confirmed rejection from this area will validate the bearish reversal and trigger the next impulsive move downwards. Therefore, I have placed my TP at 117900, targeting a significant area of prior price action and liquidity. Please share this idea with your friends and click Boost 🚀
Disclaimer: As part of ThinkMarkets’ Influencer Program, I am sponsored to share and publish their charts in my analysis.
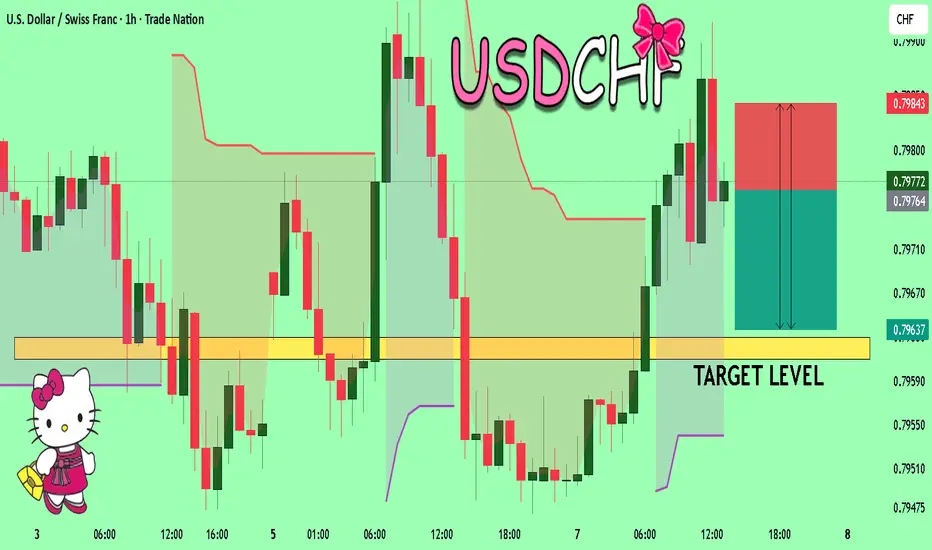
USDCHF What Next? SELL!
My dear subscribers,
My technical analysis for USDCHF is below:
The price is coiling around a solid key level - 0.7976
Bias - Bearish
Technical Indicators: Pivot Points Low) anticipates a potential price reversal.
Super trend shows a clear sell, giving a perfect indicators' convergence.
Goal - 0.7963
My Stop Loss - 0.7984
About Used Indicators:
By the very nature of the supertrend indicator, it offers firm support and resistance levels for traders to enter and exit trades. Additionally, it also provides signals for setting stop losses
Disclosure: I am part of Trade Nation's Influencer program and receive a monthly fee for using their TradingView charts in my analysis.
———————————
WISH YOU ALL LUCK
Gold settles near record high on support of China's purchases Gold prices are hovering around $3,960 an ounce, near a record high reached earlier in the session, supported by economic uncertainty and China's central bank's growing gold holdings for the eleventh consecutive month in September. Gold is up 51% so far this year , supported by resilient safe-haven demand, and expectations of #Federal_Reserve_easing.
Technically, the metal fell slightly in a downward corrective movement at the beginning of today's trading, after holding above the $3940 levels, so we expect the downward correction to stop around the $3940 per ounce level, and then rebound again and target the resistance levels of $3996.75 per ounce

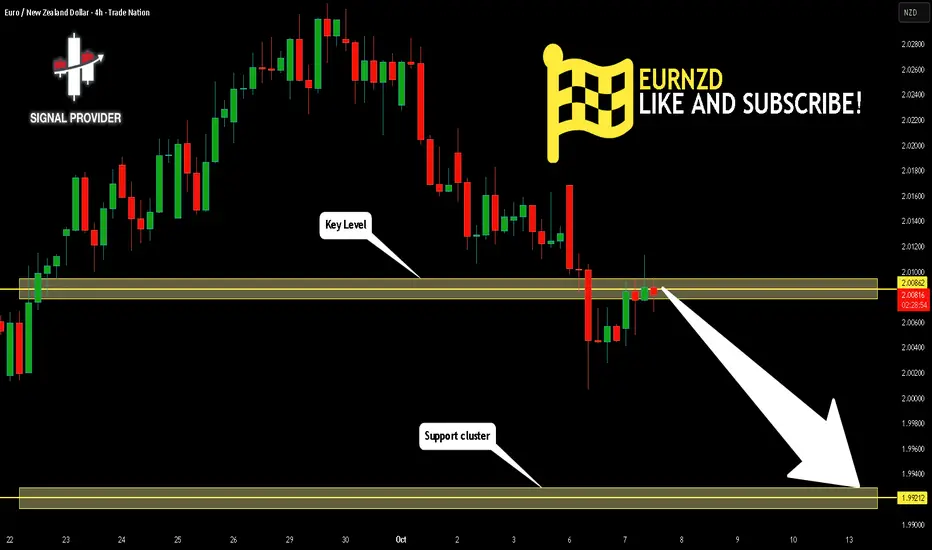
EURNZD Will Go Lower! Short!
Take a look at our analysis for EURNZD.
Time Frame: 4h
Current Trend: Bearish
Sentiment: Overbought (based on 7-period RSI)
Forecast: Bearish
The market is approaching a key horizontal level 2.008.
Considering the today's price action, probabilities will be high to see a movement to 1.992.
P.S
The term oversold refers to a condition where an asset has traded lower in price and has the potential for a price bounce.
Overbought refers to market scenarios where the instrument is traded considerably higher than its fair value. Overvaluation is caused by market sentiments when there is positive news.
Like and subscribe and comment my ideas if you enjoy them!
AUDCHF My Opinion! SELL!
My dear friends,
AUDCHF looks like it will make a good move, and here are the details:
The market is trading on 0.5268 pivot level.
Bias - Bearish
Technical Indicators: Supper Trend generates a clear short signal while Pivot Point HL is currently determining the overall Bearish trend of the market.
Goal - 0.5260
Recommended Stop Loss - 0.5273
About Used Indicators:
Pivot points are a great way to identify areas of support and resistance, but they work best when combined with other kinds of technical analysis
Disclosure: I am part of Trade Nation's Influencer program and receive a monthly fee for using their TradingView charts in my analysis.
———————————
WISH YOU ALL LUCK

SILVER BEST PLACE TO SELL FROM|SHORT
SILVER SIGNAL
Trade Direction: short
Entry Level: 4,834.9
Target Level: 4,657.5
Stop Loss: 4,952.1
RISK PROFILE
Risk level: medium
Suggested risk: 1%
Timeframe: 9h
Disclosure: I am part of Trade Nation's Influencer program and receive a monthly fee for using their TradingView charts in my analysis.
✅LIKE AND COMMENT MY IDEAS✅

AUD/NZD BEARS ARE STRONG HERE|SHORT
AUD/NZD SIGNAL
Trade Direction: short
Entry Level: 1.134
Target Level: 1.133
Stop Loss: 1.135
RISK PROFILE
Risk level: medium
Suggested risk: 1%
Timeframe: 1h
Disclosure: I am part of Trade Nation's Influencer program and receive a monthly fee for using their TradingView charts in my analysis.
✅LIKE AND COMMENT MY IDEAS✅

CAD/CHF SHORT FROM RESISTANCE
Hello, Friends!
Bearish trend on CAD/CHF, defined by the red colour of the last week candle combined with the fact the pair is overbought based on the BB upper band proximity, makes me expect a bearish rebound from the resistance line above and a retest of the local target below at 0.570.
Disclosure: I am part of Trade Nation's Influencer program and receive a monthly fee for using their TradingView charts in my analysis.
✅LIKE AND COMMENT MY IDEAS✅

EUR/USD - 4H Forecast (Full Breakdown Linked)🔥 EUR/USD – 4H Forecast 🔥
Alright traders, here’s the 4H play for the Fiber 👇
🧠 Bias:
Short-term bearish, baby. Price just printed a Break of Structure (BOS) after a clean shift in momentum from the upside. The bulls are losing steam, and sellers are creeping back into the driver’s seat.
🧩 Technical Breakdown:
Price rejected beautifully from a 4H supply zone around 1.1750–1.1770, confirming bearish intent.
We’ve got a solid BOS and shift, setting the tone for a potential continuation leg down.
A minor pullback into the 4H zone could act as the sniper’s entry area.
Below sits a juicy imbalance and SSL (sell-side liquidity) near 1.1530–1.1560, waiting to get cleared.
🎯 Trade Idea:
Entry Zone: 1.1700–1.1740 (4H supply retest)
Target 1: 1.1580 (mid-range demand)
Target 2: 1.1440 (major liquidity pocket)
Invalidation: Above 1.1780 (if price reclaims the 4H supply, bias flips)
⚙️ Risk Management:
Stick to your plan — 1–2% risk max. Wait for confirmation candles or lower-TF rejection before diving in. No FOMO entries.
💬 Summary :
EUR/USD looks primed for a bearish continuation unless the bulls pull off a miracle reclaim. Eyes on that 4H zone — rejection there could kickstart the next drop.

DXY Watching 98.800 Resistance as Shutdown Risks Weigh on DollarHey Traders, in today’s trading session we are monitoring DXY for a potential selling opportunity around the 98.800 zone. The Dollar Index remains in a broader downtrend and is currently in a correction phase, with price approaching a key daily resistance area.
Structure: The market has been forming lower highs, consistent with bearish momentum. The 98.800 level aligns with both structural resistance and trendline rejection zones.
Fundamentals: The ongoing US government shutdown continues to pressure sentiment around the Dollar. The longer the impasse persists, the higher the risk of fiscal strain and downside pressure on the USD.
Next move: Watching how price reacts around 98.800 — a rejection here could confirm further downside continuation in line with the prevailing trend.
Trade safe,
Joe.

BTCUSD Setup You Can’t MissHey everyone, Kilian here!
The Bitcoin market keeps showing positive signals as the uptrend holds steady. On the technical chart, a double bottom pattern is gradually taking shape, with the first low followed by a higher low, a clear sign that buying pressure is building. At the moment, price is trading just above the neckline, a critical level that many analysts see as the key decision point for the next move.
If price holds above the neckline and confirms the breakout, the bullish scenario aiming toward 124,625 becomes stronger. But if the market slips back below this level, it could signal buyer weakness and raise the risk of a reversal.
As always, traders should wait for clear confirmation before entering, and stick to strict risk management rules in this volatile environment.
Trade safe and stay disciplined.

EURUSD: Price Bounce Down from Triangle ResistanceHello everyone, here is my breakdown of the current Euro setup.
Market Analysis
From a broader perspective, the key event that has defined the current market structure was a 'fake breakout' above the 1.1785 Resistance. After briefly trading above this level, the price was aggressively sold off, signaling strong seller presence and shifting the market into a corrective phase.
Currently, this corrective phase has taken the form of a large symmetrical triangle.
My Scenario & Strategy
The current rally to the triangle's resistance is, in my view, a corrective move that is likely to fail as it runs into an area of seller interest.
I'm looking for the price to complete its move and test the Triangle Resistance Line. The key signal would be a clear rejection from this line, confirming that sellers are still in control and that the consolidation is likely to resolve to the downside.
Therefore, the strategy is to watch for this rejection. A confirmed failure would validate the short scenario, potentially leading to a breakdown from the triangle. The primary target for this move is the 1.1695 Support.
That's the setup I'm tracking. Thank you for your attention, and always manage your risk.

06/10/25 Weekly OutlookLast weeks high: $125,735.08
Last weeks low: $111,559.20
Midpoint: $118,6547.14
New All Time High for Bitcoin in the first week of "Uptober", really impressive strength since flipping $117,500.
BTC still finds itself within a range between ATH and $108,000 but with such strength on the bounce from range lows, could we see price discovery going into the last leg of the year?
From a macro perspective month/quarter end is now over and done with, banks have completed their window dressing/de-risking and we can expect liquidity to flow back into the risk markets. Rate cut cycle continues, M2 Global money supply at ATH with seemingly no plans to stop in the near future.
For now I am still treating trading BTC as it is in a range until we get price acceptance above $125,000. If there is a breakout above and a rally altcoins should follow. In terms of news releases this week because of the US Government shutdown there is a disruption on data releases but overall nothing of great importance is disrupted.
Good luck this week everybody!

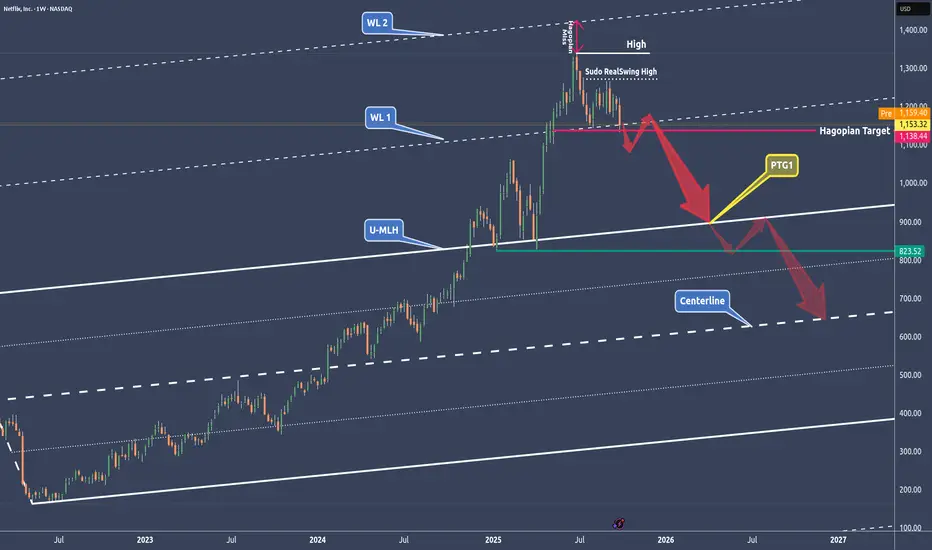
NFLX - NetFlix done after the run?🔱 A break of the WL1 could be the technical short signal 🔱
NetFlix had a monster run.
✅ Here’s a grounded fundamental breakdown of risks that could push Netflix downward. None of these are certainties, instead think of them as warning signs, not predictions.
👉 Slowing subscriber growth – growth in mature markets may plateau, and churn could rise if hit shows underperform.
👉 Rising competition and costs – rivals like Disney+ and Amazon force Netflix to spend more on content, squeezing profit margins.
👉 High valuation risk – expectations are lofty, so even a small earnings miss could trigger a sharp sell-off.
✅ Chart analysis
After missing WL2, we’ve got a Hagopian in play, which I’d say still hasn’t been fulfilled. The line was touched by a few ticks, but usually these lines break more decisively.
🔨 If we open and close below WL1, I’m stalking a pullback to it, just to hit the market on the head. If this break really happens, we’ll also have a clean structure for our stop, placed above the last RealSwing high.
🎯 The target is set in stone for me: It's the U-MLH and beyond, down to the Centerline.
Let’s stay focused and keep our cool.
Happy new week!
GOLD: Bearish Continuation & Short Signal
GOLD
- Classic bearish pattern
- Our team expects retracement
SUGGESTED TRADE:
Swing Trade
Sell GOLD
Entry - 3940.7
Stop - 3954.8
Take - 3915.7
Our Risk - 1%
Start protection of your profits from lower levels
Disclosure: I am part of Trade Nation's Influencer program and receive a monthly fee for using their TradingView charts in my analysis.
❤️ Please, support our work with like & comment! ❤️
