BTC/USD – Targeting the Next Accumulation ZoneBYBIT:BTCUSDT.P BTC has broken below its long-term rising structure and is now forming lower highs and lower lows on the daily chart. Losing the major trendline and trading under both the 50MA and 200MA suggests the correction isn’t finished yet.
Price is now retesting previous support as resistance, which often leads to continuation lower.
Key Levels
Support: $75K → $70K
Main Accumulation Zone: $65K → $58K (high confluence support)
Resistance: $100K (trend reversal only above here)
Outlook
As long as BTC remains below $100K, the chart favors a deeper move into the $70K–$60K zone before forming a stronger base. This area aligns with long-term channel support and is where I expect the next major accumulation phase.
Short!!!!

AUDUSD Will Move Lower! Short!
Please, check our technical outlook for AUDUSD.
Time Frame: 1h
Current Trend: Bearish
Sentiment: Overbought (based on 7-period RSI)
Forecast: Bearish
The market is on a crucial zone of supply 0.657.
Taking into consideration the current market trend & overbought RSI, chances will be high to see a bearish movement to the downside at least to 0.656 level.
P.S
We determine oversold/overbought condition with RSI indicator.
When it drops below 30 - the market is considered to be oversold.
When it bounces above 70 - the market is considered to be overbought.
Like and subscribe and comment my ideas if you enjoy them!

EUR/JPY BEARS ARE GAINING STRENGTH|SHORT
Hello, Friends!
The BB upper band is nearby so EUR-JPY is in the overbought territory. Thus, despite the uptrend on the 1W timeframe I think that we will see a bearish reaction from the resistance line above and a move down towards the target at around 180.104.
Disclosure: I am part of Trade Nation's Influencer program and receive a monthly fee for using their TradingView charts in my analysis.
✅LIKE AND COMMENT MY IDEAS✅

NZD/USD SELLERS WILL DOMINATE THE MARKET|SHORT
NZD/USD SIGNAL
Trade Direction: short
Entry Level: 0.574
Target Level: 0.573
Stop Loss: 0.575
RISK PROFILE
Risk level: medium
Suggested risk: 1%
Timeframe: 1h
Disclosure: I am part of Trade Nation's Influencer program and receive a monthly fee for using their TradingView charts in my analysis.
✅LIKE AND COMMENT MY IDEAS✅

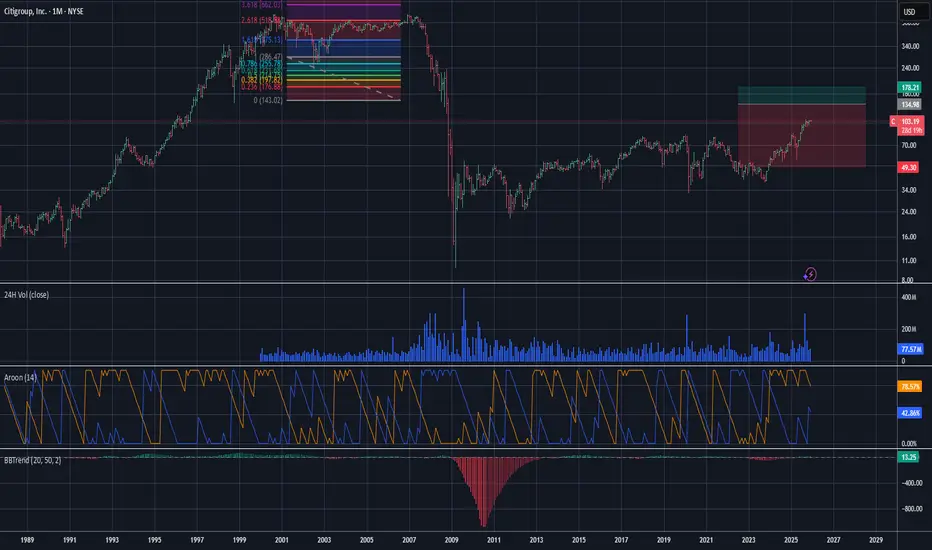
Citigroup Short - $88 TargetThe support curve seems to be breaking again for Citigroup in similar pattern as it has had for nearly 14 years. If the curve doesn't allow for a continued uptrend, in which volume seems to be low, then it could end up retracing back down to $88. As always, none of this is investment or financial advice. Please do your own due diligence and research.
EURUSD: Will Keep Falling! Here is Why:
The recent price action on the EURUSD pair was keeping me on the fence, however, my bias is slowly but surely changing into the bearish one and I think we will see the price go down.
Disclosure: I am part of Trade Nation's Influencer program and receive a monthly fee for using their TradingView charts in my analysis.
❤️ Please, support our work with like & comment! ❤️

USOIL Is Bearish! Sell!
Here is our detailed technical review for USOIL.
Time Frame: 4h
Current Trend: Bearish
Sentiment: Overbought (based on 7-period RSI)
Forecast: Bearish
The price is testing a key resistance 59.116.
Taking into consideration the current market trend & overbought RSI, chances will be high to see a bearish movement to the downside at least to 58.630 level.
P.S
Overbought describes a period of time where there has been a significant and consistent upward move in price over a period of time without much pullback.
Like and subscribe and comment my ideas if you enjoy them!

NZDUSD Under Pressure! SELL!
My dear subscribers,
NZDUSD looks like it will make a good move, and here are the details:
The market is trading on 0.5745 pivot level.
Bias - Bearish
My Stop Loss - 0.5751
Technical Indicators: Both Super Trend & Pivot HL indicate a highly probable Bearish continuation.
Target - 0.5733
About Used Indicators:
The average true range (ATR) plays an important role in 'Supertrend' as the indicator uses ATR to calculate its value. The ATR indicator signals the degree of price volatility.
Disclosure: I am part of Trade Nation's Influencer program and receive a monthly fee for using their TradingView charts in my analysis.
———————————
WISH YOU ALL LUCK

EURCHF: Bears Will Push
It is essential that we apply multitimeframe technical analysis and there is no better example of why that is the case than the current EURCHF chart which, if analyzed properly, clearly points in the downward direction.
Disclosure: I am part of Trade Nation's Influencer program and receive a monthly fee for using their TradingView charts in my analysis.
❤️ Please, support our work with like & comment! ❤️

USDJPY: Short Trading Opportunity
USDJPY
- Classic bearish setup
- Our team expects bearish continuation
SUGGESTED TRADE:
Swing Trade
Short USDJPY
Entry Point - 156.06
Stop Loss - 156.38
Take Profit - 155.51
Our Risk - 1%
Start protection of your profits from lower levels
Disclosure: I am part of Trade Nation's Influencer program and receive a monthly fee for using their TradingView charts in my analysis.
❤️ Please, support our work with like & comment! ❤️

Gold Slows at Channel Top — Market Targets 4,150 Before Move UpHello traders! Here’s my technical outlook on XAU/USD based on the current market structure. After breaking out of the broader consolidation phase, gold continued to move within a rising channel, forming consistent higher highs and higher lows along the Support Line. Buyers maintained strong momentum as the price pushed toward the Resistance Line, which aligns with the major Resistance Level near 4,240. However, after reaching this upper boundary, the market showed clear signs of exhaustion, indicating that buyers are struggling to push further into the resistance zone. This reaction suggests that the price may soon initiate a corrective move. At the moment, XAU/USD is trading inside a narrowing rising structure, with the Support and Resistance Lines converging, creating compression. As long as the price holds above the local Support Level around 4,150, the bullish structure remains intact. A pullback from the Resistance Line toward this area is the most likely short-term scenario before buyers attempt another push. This zone aligns with the first target TP1, which also acts as a key reaction zone from previous price behavior. A successful rebound from support could allow bulls to regain strength and attempt another test of the 4,240 resistance. If a breakout occurs, it would open the door for further bullish continuation. However, if the price fails to hold the Support Line or breaks back below the 4,150 zone, the structure may shift to a deeper correction, exposing gold to lower support areas. Please share this idea with your friends and click Boost 🚀

GBPCAD Will Fall! Short!
Here is our detailed technical review for GBPCAD.
Time Frame: 1h
Current Trend: Bearish
Sentiment: Overbought (based on 7-period RSI)
Forecast: Bearish
The market is testing a major horizontal structure 1.849.
Taking into consideration the structure & trend analysis, I believe that the market will reach 1.847 level soon.
P.S
We determine oversold/overbought condition with RSI indicator.
When it drops below 30 - the market is considered to be oversold.
When it bounces above 70 - the market is considered to be overbought.
Like and subscribe and comment my ideas if you enjoy them!

CAD/CHF BEARS ARE STRONG HERE|SHORT
Hello, Friends!
CAD-CHF uptrend evident from the last 1W green candle makes short trades more risky, but the current set-up targeting 0.571 area still presents a good opportunity for us to sell the pair because the resistance line is nearby and the BB upper band is close which indicates the overbought state of the CAD/CHF pair.
Disclosure: I am part of Trade Nation's Influencer program and receive a monthly fee for using their TradingView charts in my analysis.
✅LIKE AND COMMENT MY IDEAS✅

NZD/CAD SHORT FROM RESISTANCE
NZD/CAD SIGNAL
Trade Direction: short
Entry Level: 0.801
Target Level: 0.800
Stop Loss: 0.802
RISK PROFILE
Risk level: medium
Suggested risk: 1%
Timeframe: 1h
Disclosure: I am part of Trade Nation's Influencer program and receive a monthly fee for using their TradingView charts in my analysis.
✅LIKE AND COMMENT MY IDEAS✅

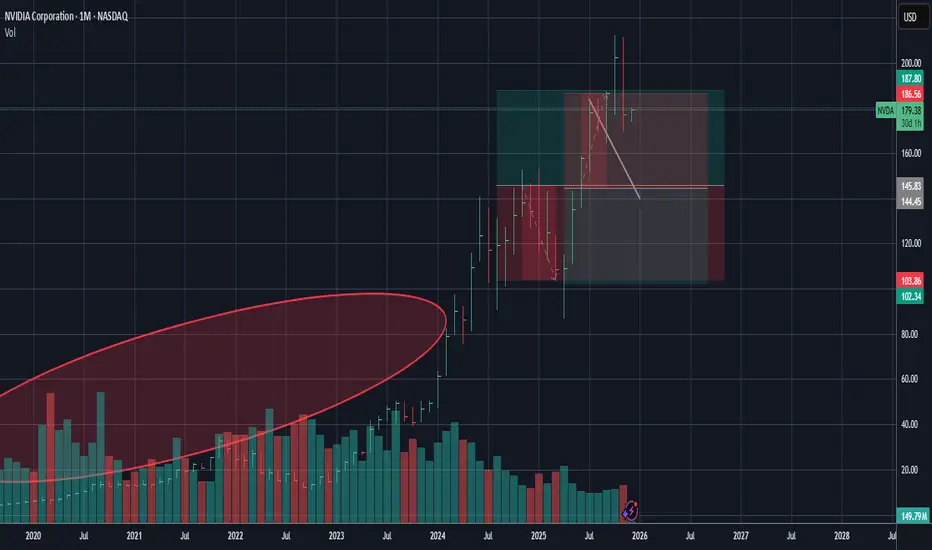
$NVDA - $140 Target - Short Position - AI Bubble About to BurstIn my opinion, Nvidia does not have much to continue the next needed support for a pro-longed bull run, at least in terms of sentiment. The AI bubble has gone on for too long and the actual multiples of valuations in comparison to revenue and profit generations do not seem to have strong support when considering traditional investing strategies. Also, the next wave seems getting closer and closer to a red trend. Retracement potential is possible after hitting $140, but Nvidia needs to do far more benefit for the public good and have a differentiation that doesn't rely on trends such as crypto mining and the boost of LLMs. As always, none of this is investment or financial advice. Please do your own due diligence and research.
GBPUSD: Short Trade Explained
GBPUSD
- Classic bearish formation
- Our team expects fall
SUGGESTED TRADE:
Swing Trade
Sell GBPUSD
Entry Level - 1.3272
Sl - 1.3284
Tp - 1.3245
Our Risk - 1%
Start protection of your profits from lower levels
Disclosure: I am part of Trade Nation's Influencer program and receive a monthly fee for using their TradingView charts in my analysis.
❤️ Please, support our work with like & comment! ❤️

USOIL BEARS WILL DOMINATE THE MARKET|SHORT
Hello, Friends!
USOIL pair is in the uptrend because previous week’s candle is green, while the price is obviously rising on the 4H timeframe. And after the retest of the resistance line above I believe we will see a move down towards the target below at 58.36 because the pair overbought due to its proximity to the upper BB band and a bearish correction is likely.
Disclosure: I am part of Trade Nation's Influencer program and receive a monthly fee for using their TradingView charts in my analysis.
✅LIKE AND COMMENT MY IDEAS✅

Welcome to BEAR SEASONAs the timeline clearly indicates, we've entered bear season. Good luck to everyone. I've opened my Short, lit a cigarette, and sipped my cappuccino, watching with pleasure as the stoves go out.

XAUUSD Short: Rejection Pattern Points Toward 4,110 SupportHello, traders! XAUUSD continues to move within a broader ascending channel, where the price is forming higher pivot points along the Demand Line while consistently reacting to the descending Supply Line above. This structure indicates ongoing compression between buyers and sellers. Recently, Gold approached the upper Supply Line, where the price once again failed to break through, forming another lower high. This confirms that sellers are still defending the supply zone around $4,190–$4,200, keeping upward momentum limited. Before that, the price made several breakout attempts above the mid-range resistance, but many of them turned into fake breakouts, indicating liquidity grabs. Each rejection pushed Gold back toward the Demand Line, where buyers repeatedly created strong pivot points and revived the bullish momentum.
Currently, XAUUSD is trading close to the resistance area, and the chart suggests a potential pullback. If sellers maintain their pressure, the price may decline toward the $4,110 demand level, which aligns with both historical support and the upward Demand Line.
My scenario, if the price respects the Supply Line and fails to break higher, a bearish correction toward the $4,110 support zone becomes likely. However, if buyers manage to break above the descending Supply Line with strong momentum, the bearish idea becomes invalid, and Gold may continue its bullish expansion. Manage your risk!

EURUSD: Sellers Target Move Toward 1.15200 SupportHello everyone, here is my breakdown of the current EURUSD setup.
Market Analysis
EURUSD continues to trade within a corrective market structure after a strong bullish impulse that formed an Upward Channel earlier in the month. Once price broke below that channel, the pair shifted into a broader consolidation, forming a descending Triangle pattern defined by a Triangle Resistance Line above and a Triangle Support Line below. After dropping from the 1.16000 Resistance Zone, the market produced a clear fake breakout above this level, signaling strong seller presence. This rejection aligned with the Triangle Resistance Line, confirming it as a firm boundary preventing further upside. On the downside, EURUSD also created a fake breakout at the Triangle Support Line, showing that buyers remain active around the 1.15200 Support Zone.
Currently, price is trading in the middle of this triangle structure, moving away from resistance and showing early signs of bearish momentum building toward the lower boundary. The broader picture reflects a balanced but weakening market, where sellers still hold the advantage as long as price remains under the 1.16000 Resistance.
My Scenario & Strategy
My scenario is bearish, based on the repeated rejections from the 1.16000 Resistance and the overall pressure along the Triangle Resistance Line. As long as EURUSD stays below this key zone, the probability favors further downside movement inside the triangle. My expectation is for price to make another minor pullback toward the 1.15850–1.15900 area, where short-term liquidity may form, before resuming the decline toward the 1.15200 Support Zone. This level aligns with the Triangle Support Line and represents the main downside target for the current move.
Therefore, a clean breakout below 1.15200 would signal stronger bearish continuation and open the path for deeper declines. However, if price rejects the support again and forms higher lows, we may see another corrective bounce back into the triangle — but the bearish bias holds as long as the 1.16000 Resistance remains intact. For now, the market supports a short scenario with a focus on a move toward the 1.15200 support area.
That's the setup I'm tracking. Thank you for your attention, and always manage your risk.

GOLD: Bearish Continuation & Short Trade
GOLD
- Classic bearish formation
- Our team expects pullback
SUGGESTED TRADE:
Swing Trade
Short GOLD
Entry - 4247.1
Sl - 4360.6
Tp - 4222.0
Our Risk - 1%
Start protection of your profits from lower levels
Disclosure: I am part of Trade Nation's Influencer program and receive a monthly fee for using their TradingView charts in my analysis.
❤️ Please, support our work with like & comment! ❤️

EURUSD Will Collapse! SELL!
My dear subscribers,
My technical analysis for EURUSD is below:
The price is coiling around a solid key level - 1.1619
Bias - Bearish
Technical Indicators: Pivot Points Low anticipates a potential price reversal.
Super trend shows a clear sell, giving a perfect indicators' convergence.
Goal - 1.1602
My Stop Loss - 1.1628
About Used Indicators:
By the very nature of the supertrend indicator, it offers firm support and resistance levels for traders to enter and exit trades. Additionally, it also provides signals for setting stop losses
Disclosure: I am part of Trade Nation's Influencer program and receive a monthly fee for using their TradingView charts in my analysis.
———————————
WISH YOU ALL LUCK

USDJPY Potential DownsidesHey Traders, in today's trading session we are monitoring USDJPY for a selling opportunity around 155.900 zone, USDJPY is trading in a downtrend and currently is in a correction phase in which it is approaching the trend at 155.900 support and resistance area.
Trade safe, Joe.
