USDJPY Will Move Lower! Short!
Take a look at our analysis for USDJPY.
Time Frame: 1D
Current Trend: Bearish
Sentiment: Overbought (based on 7-period RSI)
Forecast: Bearish
The market is approaching a key horizontal level 154.543.
Considering the today's price action, probabilities will be high to see a movement to 151.281.
P.S
The term oversold refers to a condition where an asset has traded lower in price and has the potential for a price bounce.
Overbought refers to market scenarios where the instrument is traded considerably higher than its fair value. Overvaluation is caused by market sentiments when there is positive news.
Like and subscribe and comment my ideas if you enjoy them!
Short!!!!

AUD/JPY BEST PLACE TO SELL FROM|SHORT
Hello, Friends!
AUD/JPY pair is trading in a local uptrend which we know by looking at the previous 1W candle which is green. On the 1D timeframe the pair is going up too. The pair is overbought because the price is close to the upper band of the BB indicator. So we are looking to sell the pair with the upper BB line acting as resistance. The next target is 99.105 area.
Disclosure: I am part of Trade Nation's Influencer program and receive a monthly fee for using their TradingView charts in my analysis.
✅LIKE AND COMMENT MY IDEAS✅

GBP/USD - Multi Timeframe Analysis GBP/USD – Top-Down Breakdown 🏦💷
WEEKLY 📆 (Big Boss View)
Price is chilling inside a large ascending channel, still respecting the long-term bullish structure.
We’ve tapped into that external sell-side liquidity (the grey zone) and reacted.
Structure still looks corrective, not impulsive.
As long as we hold that monthly demand support, GBP/USD looks like it wants a bigger upside swing toward the 1.3800+ zone 🏹.
Expectation: Sweep → Reversal → Push to the top of the range.
Weekly Bias :
🔻 Short-term weakness
🔺 Long-term bullish continuation (big swing wave 3 incoming)
DAILY 📅 (The Supervisor)
The daily structure is walking itself down in a corrective pullback, respecting the trendline from below.
We’re heading into the daily demand zone + lower swing range boundary.
Liquidity below has been taken previously but not fully mitigated — one more sweep is likely.
After that?
Big rocket-launch potential to form the next higher-timeframe leg up 🚀.
Daily Expectation:
➡️ Dip into daily demand
➡️ One more sweep
➡️ Then reversal toward 1.38
8H / 4H / Intraday (The Workers)
Inside a falling channel, clean bearish flow.
Price is tapping into small demand pockets, causing bounces — but not enough to break structure yet.
Clear BH (bearish high) + SH (swing high) levels show liquidity resting above.
Expect either:
A) Retrace to premium zone → Sell continuation
B) Flush into demand → Hard reversal
Intraday Bias:
Bearish until that higher-timeframe daily/weekly zone hits.
Overall Summary ⚡
GBP/USD is basically doing the classic play:
“Short-term bearish snack → Long-term bullish main meal.”
🍫➡️🥩
HTF (Weekly/Daily): Preparing for a major bullish leg
STF (8H/4H): Still bearish, likely to sweep lows before reversing
Key target on reversal: 1.3700 → 1.3800+

GBPUSD Is Going Down! Sell!
Take a look at our analysis for GBPUSD.
Time Frame: 4h
Current Trend: Bearish
Sentiment: Overbought (based on 7-period RSI)
Forecast: Bearish
The price is testing a key resistance 1.317.
Taking into consideration the current market trend & overbought RSI, chances will be high to see a bearish movement to the downside at least to 1.308 level.
P.S
Please, note that an oversold/overbought condition can last for a long time, and therefore being oversold/overbought doesn't mean a price rally will come soon, or at all.
Like and subscribe and comment my ideas if you enjoy them!

GBP/CAD SHORT FROM RESISTANCE
Hello, Friends!
We are targeting the 1.832 level area with our short trade on GBP/CAD which is based on the fact that the pair is overbought on the BB band scale and is also approaching a resistance line above thus going us a good entry option.
Disclosure: I am part of Trade Nation's Influencer program and receive a monthly fee for using their TradingView charts in my analysis.
✅LIKE AND COMMENT MY IDEAS✅

GBP/JPY BEARS WILL DOMINATE THE MARKET|SHORT
Hello, Friends!
GBP/JPY is making a bullish rebound on the 12H TF and is nearing the resistance line above while we are generally bearish biased on the pair due to our previous 1W candle analysis, thus making a trend-following short a good option for us with the target being the 201.580 level.
Disclosure: I am part of Trade Nation's Influencer program and receive a monthly fee for using their TradingView charts in my analysis.
✅LIKE AND COMMENT MY IDEAS✅

US30 BEST PLACE TO SELL FROM|SHORT
US30 SIGNAL
Trade Direction: short
Entry Level: 48,294.2
Target Level: 47,472.1
Stop Loss: 48,842.3
RISK PROFILE
Risk level: medium
Suggested risk: 1%
Timeframe: 4h
Disclosure: I am part of Trade Nation's Influencer program and receive a monthly fee for using their TradingView charts in my analysis.
✅LIKE AND COMMENT MY IDEAS✅

BTC - Fear & GreedAs Bitcoin falls below $100,000, now is a good time to check the Fear & Greed index to map out the sentiment around the move, and to compare similar scores at other places in this bull run move.
As painful as it may be, buying the fear and selling the green is an effective strategy. Every local bottom since the start of 2023 has had a F&G score below 50:
Jan 26th 2023 - 26
March 10th 2023 - 34
June 14th 2023 - 46
Sept 11th 2023 - 40
July 7th 2024 - 29
Aug 5th 2024 - 26
Sept 6th 2024 - 22
Feb 26th 2025 - 21
March 10th 2025 - 20
April 8th 2025 - 24
Today - 16
As of writing the current fear and greed score is lower than it has been for nearly three years!
What is important to note is that bullish momentum has faded but structure remains (higher lows + higher highs). IF the pattern continues then this is a good place to buy historically, obviously that does not guarantee the same pattern will continue to play out but if the bull market is still alive then this level usually gets a bullish reaction.
The timing also adds another layer of complexity as the US Government shutdown is ending. Bitcoin is super reactive to liquidity, once the shut down began it is clear liquidity did drop resulting in price falling. This correlation implies an expected rise in liquidity and Bitcoins price along with it.
For the bears the target area is $89,000-$92,000. In my opinion this will cap the downside at least temporarily.

EURUSD Set To Fall! SELL!
My dear subscribers,
EURUSD looks like it will make a good move, and here are the details:
The market is trading on 1.1629 pivot level.
Bias - Bearish
My Stop Loss - 1.1642
Technical Indicators: Both Super Trend & Pivot HL indicate a highly probable Bearish continuation.
Target - 1.1607
About Used Indicators:
The average true range (ATR) plays an important role in 'Supertrend' as the indicator uses ATR to calculate its value. The ATR indicator signals the degree of price volatility.
Disclosure: I am part of Trade Nation's Influencer program and receive a monthly fee for using their TradingView charts in my analysis.
———————————
WISH YOU ALL LUCK

EURUSD: Expecting Bearish Continuation! Here is Why:
Balance of buyers and sellers on the EURUSD pair, that is best felt when all the timeframes are analyzed properly is shifting in favor of the sellers, therefore is it only natural that we go short on the pair.
Disclosure: I am part of Trade Nation's Influencer program and receive a monthly fee for using their TradingView charts in my analysis.
❤️ Please, support our work with like & comment! ❤️

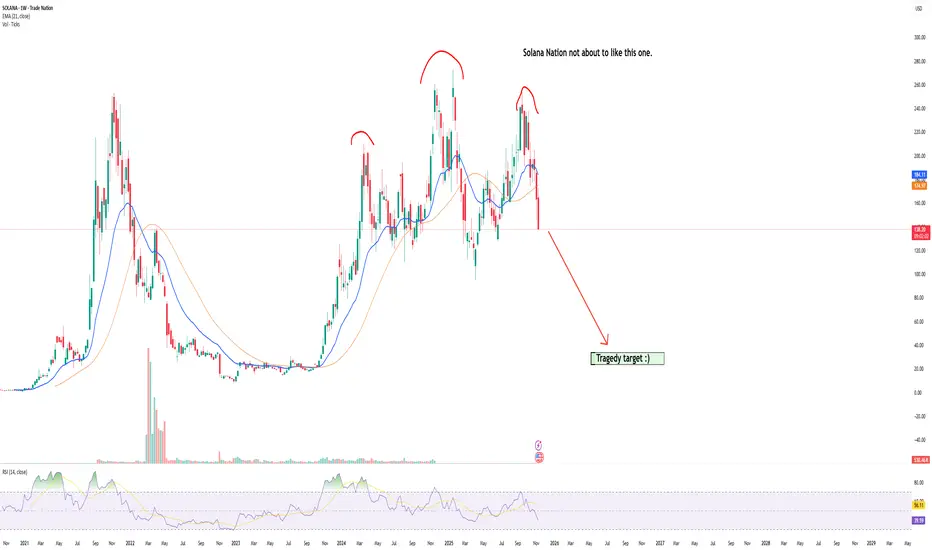
Solana tragedy incomingEvery downfall creates buy oportunities. :) Every tragedy is soil for another flower...
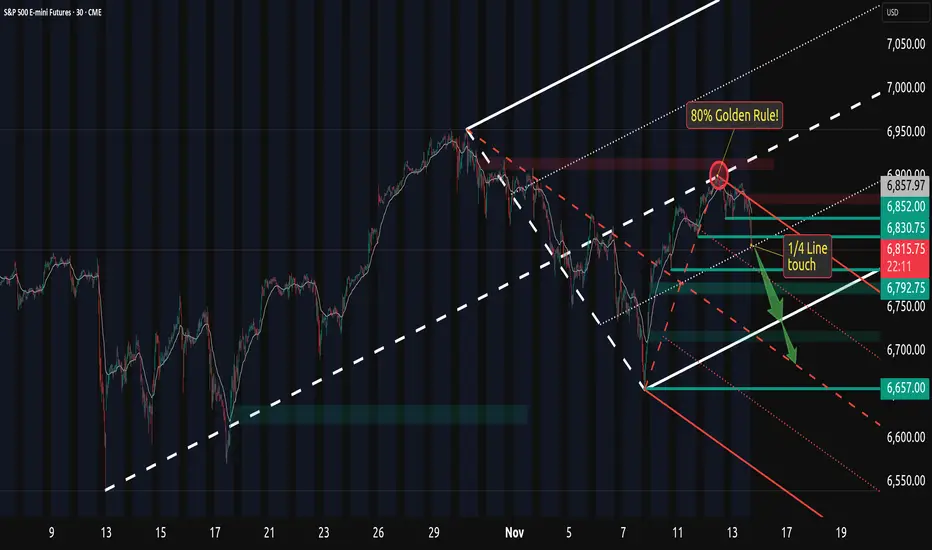
SP500 Santa Claus rally - just backwardsIt is time to short the waaaaay needed correction on the stock market.

EURAUD Will Go Lower! Short!
Please, check our technical outlook for EURAUD.
Time Frame: 2h
Current Trend: Bearish
Sentiment: Overbought (based on 7-period RSI)
Forecast: Bearish
The market is approaching a significant resistance area 1.781.
Due to the fact that we see a positive bearish reaction from the underlined area, I strongly believe that sellers will manage to push the price all the way down to 1.773 level.
P.S
Please, note that an oversold/overbought condition can last for a long time, and therefore being oversold/overbought doesn't mean a price rally will come soon, or at all.
Like and subscribe and comment my ideas if you enjoy them!

GOLD Will Move Lower! Sell!
Take a look at our analysis for GOLD.
Time Frame: 1h
Current Trend: Bearish
Sentiment: Overbought (based on 7-period RSI)
Forecast: Bearish
The price is testing a key resistance 4,235.87.
Taking into consideration the current market trend & overbought RSI, chances will be high to see a bearish movement to the downside at least to 4,172.53 level.
P.S
We determine oversold/overbought condition with RSI indicator.
When it drops below 30 - the market is considered to be oversold.
When it bounces above 70 - the market is considered to be overbought.
Like and subscribe and comment my ideas if you enjoy them!

GBP/AUD SELLERS WILL DOMINATE THE MARKET|SHORT
Hello, Friends!
It makes sense for us to go short on GBP/AUD right now from the resistance line above with the target of 2.006 because of the confluence of the two strong factors which are the general downtrend on the previous 1W candle and the overbought situation on the lower TF determined by it’s proximity to the upper BB band.
Disclosure: I am part of Trade Nation's Influencer program and receive a monthly fee for using their TradingView charts in my analysis.
✅LIKE AND COMMENT MY IDEAS✅

XAUUSD FOLLOW THROUGHFollowing the success of our intial setup on gold, which you will find attached
Gold Bought and filled our FVG zone, filling up all the inefficiency in that area,
We currently have slow movement in the FVG Zone and with the current taking out of the previous Higher Low, we formed a Change Of Character
Using our FVG Zone, we may expect price to sell to take out or even break with this sell ???
Lets monitor and react as the markets talk to us
DISCLAIMER : This is purely for motivational purposes and the infomation provided is not to be considered as investment advise, Risk Accordingly

XAUUSD Retests Resistance — Pullback Toward $4,060 SupportHello traders! Let’s take a look at XAUUSD (Gold). After a prolonged bullish movement within a well-defined ascending channel, price reached a significant Resistance Level near $4,200, where sellers stepped in to regain control. This resistance coincides with the upper boundary of a descending resistance line, confirming its importance as a reaction area. Following this rejection, Gold experienced a sharp correction, forming a Range structure near the top before breaking below it — marking a shift in short-term sentiment. The breakout from this range confirmed the beginning of a downward phase, where price continued to move inside a new descending pattern. Currently, XAUUSD is testing the resistance line once again after a breakout retest from below. This area aligns with a former pivot zone where several reversals occurred in the past. The overall structure suggests that buyers are losing momentum, while sellers are preparing to defend this key zone. As long as price remains below the $4,160–$4,200 resistance, a corrective pullback toward the $4,060 Support Level (TP1) looks likely. This area also aligns with the ascending support line, which may act as the next major decision point. A clean break below $4,060 could extend the decline toward the $3,950–$3,970 zone, while a confirmed breakout above $4,200 would invalidate the short scenario and potentially trigger another bullish continuation phase. Please share this idea with your friends and click Boost 🚀

BITCOIN SHORT (EXPERIMENTAL)In a bear market scenario, Bitcoin might see extended periods of stagnation or decline, which could challenge its perception as a store of value or its role in a diversified investment portfolio. However, bear markets can also present buying opportunities for long-term investors, as they may view the price declines as temporary setbacks in Bitcoin's overall growth trajectory.

Markets are flashing MAJOR warning signs…Markets are flashing MAJOR warning signs… NASDAQ:QQQ AMEX:SPY
In this video, we will look at the 21 ema on the Daily charts to review the move since April and where we could go from here.
If you have money in this market, you need to see this ASAP 👇

A Pitchfork For The LEAPI enjoy a good challenge.
Probably more than is strictly healthy.
That’s why I jumped into the LEAP.
This time I’ve actually got enough hours in the day to show up for the fight. I’m genuinely curious whether I can trade my way into the top 50, even though I’ve already committed a few strategic blunders that shaved off some perfectly good profit.
But that’s trading in the real world, isn’t it?
A comedy of precision errors.
My plan is simple: stick to the Andrews Pitchfork framework and nothing else. The goal isn’t just to place well; it’s to demonstrate how much of an edge this tool offers when you use its rules properly.
Don’t wish me luck - I’m aiming to get there by skill and stubbornness.
XAUUSD Short: Rejection From Supply Targets $4,070 Demand LineHello traders! Gold (XAUUSD) is showing signs of a potential corrective move after a strong bullish rally from the $3,950–$3,970 Demand Zone, where multiple fake breakouts confirmed the presence of strong buyers. This area coincides with the ascending Demand Line, which has provided consistent support for price growth. Each touch on this line has led to notable bullish impulses, signaling accumulation and strengthening buyer momentum.
Currently, the price approached the $4,140–$4,160 Supply Zone, which aligns with both a Supply Line and the neckline of a previous Double Top pattern. This confluence area represents a critical resistance zone where sellers have historically regained control. The current rejection from this level suggests that a short-term pullback could be underway as the market seeks to retest lower support.
I expect the first key area to watch is the $4,070 pivot level, which aligns with the Demand Line. This zone is expected to act as dynamic support for a potential rebound. If price holds above this level, the bullish structure remains valid, with a possible retest of the $4,150–$4,160 Supply Zone. However, a confirmed break below $4,070 could trigger a deeper correction toward the $3,950 Demand Zone, where fresh buying opportunities may emerge. Manage your risk!

NZDUSD: Bearish Forecast & Bearish Scenario
The charts are full of distraction, disturbance and are a graveyard of fear and greed which shall not cloud our judgement on the current state of affairs in the NZDUSD pair price action which suggests a high likelihood of a coming move down.
Disclosure: I am part of Trade Nation's Influencer program and receive a monthly fee for using their TradingView charts in my analysis.
❤️ Please, support our work with like & comment! ❤️

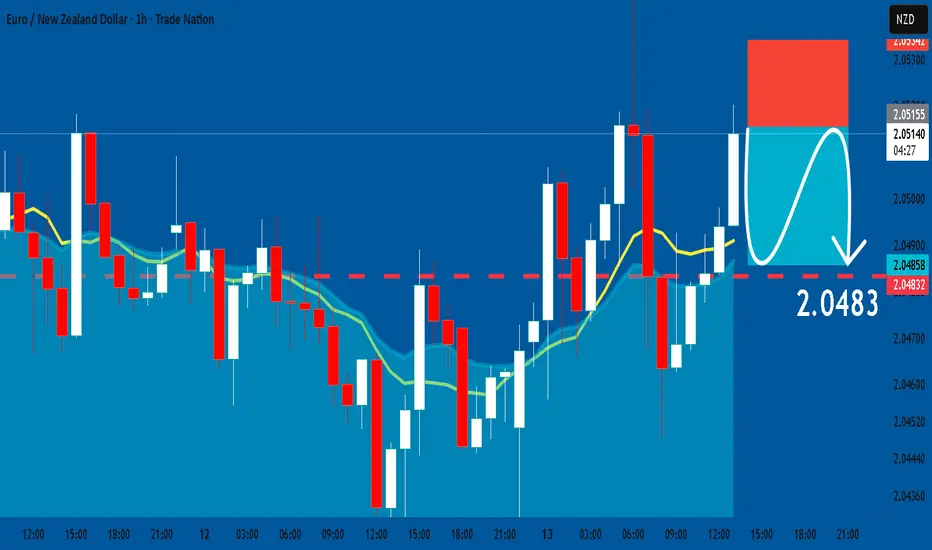
EURNZD: Short Trade with Entry/SL/TP
EURNZD
- Classic bearish formation
- Our team expects fall
SUGGESTED TRADE:
Swing Trade
Sell EURNZD
Entry Level - 2.0515
Sl - 2.0534
Tp -2.0483
Our Risk - 1%
Start protection of your profits from lower levels
Disclosure: I am part of Trade Nation's Influencer program and receive a monthly fee for using their TradingView charts in my analysis.
❤️ Please, support our work with like & comment! ❤️