GOLD SHORT FROM RESISTANCE
GOLD SIGNAL
Trade Direction: short
Entry Level: 4,337.65
Target Level: 4,266.90
Stop Loss: 4,384.71
RISK PROFILE
Risk level: medium
Suggested risk: 1%
Timeframe: 1h
Disclosure: I am part of Trade Nation's Influencer program and receive a monthly fee for using their TradingView charts in my analysis.
✅LIKE AND COMMENT MY IDEAS✅
Short!!!!

EURUSD Technical Analysis! SELL!
My dear subscribers,
My technical analysis for EURUSD is below:
The price is coiling around a solid key level - 1.1754
Bias - Bearish
Technical Indicators: Pivot Points Low anticipates a potential price reversal.
Super trend shows a clear sell, giving a perfect indicators' convergence.
Goal - 1.1743
My Stop Loss - 1.1760
About Used Indicators:
By the very nature of the supertrend indicator, it offers firm support and resistance levels for traders to enter and exit trades. Additionally, it also provides signals for setting stop losses
Disclosure: I am part of Trade Nation's Influencer program and receive a monthly fee for using their TradingView charts in my analysis.
———————————
WISH YOU ALL LUCK

Gold has been moving in a strong bullish channel, but it is now Technical View:
Resistance Zone: The price is climbing towards a significant supply area between 4540.00 and 4633.00 (marked in red).
Channel Top: This resistance zone aligns perfectly with the upper boundary of the ascending channel.
Expectation: As price hits this upper structure, there is a high probability of a rejection or a pullback. I am watching for bearish reactions from this level to potentially correct downwards (as shown by the arrows).
Trade with care and manage your risk.
OANDA:XAUUSD FOREXCOM:XAUUSD ICMARKETS:XAUUSD SAXO:XAUUSD TVC:GOLD FOREXCOM:GOLD

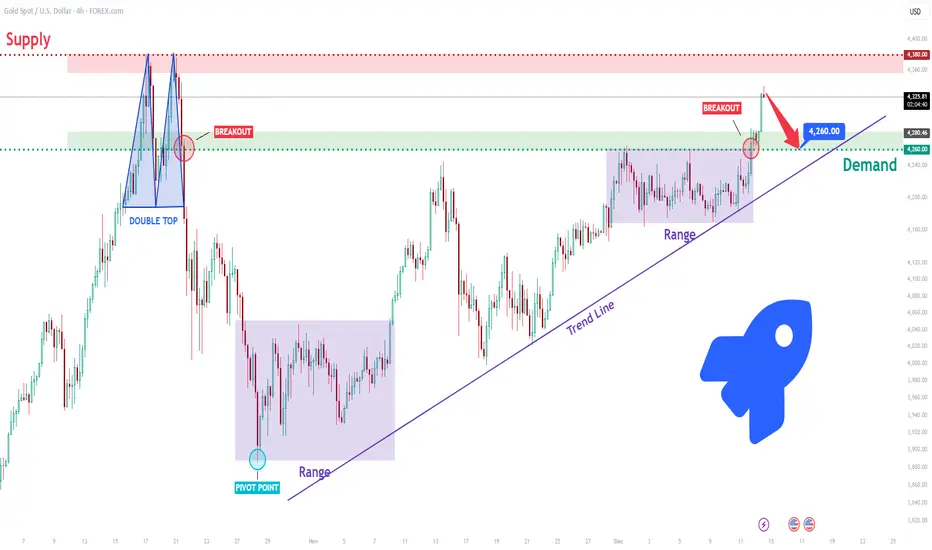
XAUUSD Short: Bears Aim for Pullback Into $4,260 Demand ZoneHello, traders! The current XAUUSD price action is showing early signs of bearish pressure after failing to sustain momentum above the upper resistance zones. Earlier, the market formed a strong Double Top inside the major Supply Zone, which triggered a sharp downside reversal and highlighted the presence of active sellers at the top of the structure. This rejection pushed gold back toward the mid-range levels, signaling a shift in market sentiment. After that decline, XAUUSD entered a prolonged Range phase, where price consolidated and accumulated liquidity for the next move. Although buyers attempted to regain control, the Trend Line breakout attempts showed weakening bullish strength, as each move higher was met with increased selling interest. The second consolidation Range formed near the upper supply boundary, confirming that the market was losing upward momentum.
Currently, gold broke out above the Range high but quickly faced resistance near $4,330, where sellers stepped in aggressively. Price is now pulling back and showing signs of returning toward the $4,260 level — a key decision zone that aligns with previous structure and where demand has recently weakened. As long as XAUUSD remains below the $4,330 resistance and fails to reclaim the local high, the bearish scenario becomes the primary outlook. A sustained move back into the Range and a breakdown below $4,260 would confirm stronger seller dominance and open the path toward deeper corrective movement.
My scenario is a continuation to the downside toward the $4,260 Demand Zone, especially if price breaks below $4,260 and loses the ascending structure. A clean breakdown of this level may trigger a broader bearish continuation. Manage your risk!
EURUSD: Sellers Drive Pullback - 1.1670 Support in FocusHello everyone, here is my breakdown of the current EURUSD setup.
Market Analysis
EURUSD remains in a broader bearish structure, and the recent price action is unfolding within a clear downward context. After moving through a prolonged range phase, the pair broke lower and continued to respect the descending trend line, confirming sustained selling pressure. Price later formed a Triangle Support Line, where buyers attempted to reverse the trend, leading to a breakout above the trend line and a retest of the Support Zone around 1.1670. However, after this retest, EURUSD quickly reached the major 1.1760 Resistance, which has repeatedly acted as a strong reaction zone. From this level, a sharp rejection occurred, showing that sellers are still firmly active and protecting this resistance area.
Currently, the market is pulling back from the Resistance Zone and heading back toward the Support Zone, where the ascending structure meets previous breakout levels.
My Scenario & Strategy
My scenario is bearish as long as EURUSD remains below the 1.1760 Resistance and continues to move away from this rejection zone. I expect the price to pull back toward the 1.1670 Support, where the next reaction will determine short-term direction.
Therefore, a clean breakdown below the 1.1670 Support Zone would confirm further bearish continuation and open the path toward lower levels. However, if the pair tests the support and shows a strong bounce, a short-term recovery toward the trend line may occur — but the bearish outlook remains valid while price stays under the 1.1760 Resistance. For now, the market favors sellers, with the key objective being a move back into the Support Zone around 1.1670.
That's the setup I'm tracking. Thank you for your attention, and always manage your risk.

EURNZD Will Go Down! Sell!
Take a look at our analysis for EURNZD.
Time Frame: 1h
Current Trend: Bearish
Sentiment: Overbought (based on 7-period RSI)
Forecast: Bearish
The market is on a crucial zone of supply 2.029.
The above-mentioned technicals clearly indicate the dominance of sellers on the market. I recommend shorting the instrument, aiming at 2.023 level.
P.S
Please, note that an oversold/overbought condition can last for a long time, and therefore being oversold/overbought doesn't mean a price rally will come soon, or at all.
Like and subscribe and comment my ideas if you enjoy them!

EURCAD Will Go Lower! Short!
Here is our detailed technical review for EURCAD.
Time Frame: 4h
Current Trend: Bearish
Sentiment: Overbought (based on 7-period RSI)
Forecast: Bearish
The market is approaching a significant resistance area 1.615.
Due to the fact that we see a positive bearish reaction from the underlined area, I strongly believe that sellers will manage to push the price all the way down to 1.607 level.
P.S
Overbought describes a period of time where there has been a significant and consistent upward move in price over a period of time without much pullback.
Like and subscribe and comment my ideas if you enjoy them!

EUR/GBP BEARS WILL DOMINATE THE MARKET|SHORT
Hello, Friends!
We are now examining the EUR/GBP pair and we can see that the pair is going up locally while also being in a uptrend on the 1W TF. But there is also a powerful signal from the BB upper band being nearby, indicating that the pair is overbought so we can go short from the resistance line above and a target at 0.874 level.
Disclosure: I am part of Trade Nation's Influencer program and receive a monthly fee for using their TradingView charts in my analysis.
✅LIKE AND COMMENT MY IDEAS✅

EURNZD: Market of Sellers
Remember that we can not, and should not impose our will on the market but rather listen to its whims and make profit by following it. And thus shall be done today on the EURNZD pair which is likely to be pushed down by the bears so we will sell!
Disclosure: I am part of Trade Nation's Influencer program and receive a monthly fee for using their TradingView charts in my analysis.
❤️ Please, support our work with like & comment! ❤️

GOLD: Bearish Continuation & Short Trade
GOLD
- Classic bearish pattern
- Our team expects retracement
SUGGESTED TRADE:
Swing Trade
Sell GOLD
Entry - 4347.9
Stop - 4363.6
Take - 4318.5
Our Risk - 1%
Start protection of your profits from lower levels
Disclosure: I am part of Trade Nation's Influencer program and receive a monthly fee for using their TradingView charts in my analysis.
❤️ Please, support our work with like & comment! ❤️

GOLD Set To Fall! SELL!
My dear followers,
This is my opinion on the GOLD next move:
The asset is approaching an important pivot point 4340.5
Bias - Bearish
Safe Stop Loss - 4355.7
Technical Indicators: Supper Trend generates a clear short signal while Pivot Point HL is currently determining the overall Bearish trend of the market.
Goal - 4315.6
About Used Indicators:
For more efficient signals, super-trend is used in combination with other indicators like Pivot Points.
Disclosure: I am part of Trade Nation's Influencer program and receive a monthly fee for using their TradingView charts in my analysis.
———————————
WISH YOU ALL LUCK

EURUSD What Next? SELL!
My dear friends,
EURUSD looks like it will make a good move, and here are the details:
The market is trading on 1.1739 pivot level.
Bias - Bearish
Technical Indicators: Supper Trend generates a clear short signal while Pivot Point HL is currently determining the overall Bearish trend of the market.
Goal - 1.1702
About Used Indicators:
Pivot points are a great way to identify areas of support and resistance, but they work best when combined with other kinds of technical analysis
Disclosure: I am part of Trade Nation's Influencer program and receive a monthly fee for using their TradingView charts in my analysis.
———————————
WISH YOU ALL LUCK

#044: SHORT Investment Opportunity on NZD/CHF
The exchange rate displays a typical pattern of distributional movements that institutions use to unload positions in areas of high liquidity. After an orderly bullish extension, the market executed a classic stop-gathering move above the most recent highs, leaving a trail of excess that lacks continuity in volume or directional direction.
The immediate reaction following the manipulation was characterized by indecision candles and a progressive loss of momentum, with lower highs signaling an exhaustion of buying pressure. This behavior is consistent with a market context in which the bullish momentum is not supported by institutional participation, but rather by late retail entries.
Sentiment, in fact, highlights a strong concentration of long positions by the public, a condition that historically predicts movements in the opposite direction. Institutions tend to exploit this dynamic to build bearish positions while the market remains anchored to unwarranted euphoria. In this case, the technical structure and psychological positioning of participants converge toward a well-defined bearish bias.
The upper zone, where the price has repeatedly reacted, represents a significant supply zone: each return to that range highlights effective selling and a lack of follow-through by buyers. The momentum that followed the manipulation failed to generate a true breakout, confirming that strong hands have no interest in sustaining a bullish continuation.
On the intermarket level, the relative strength of the Swiss franc and the cautious macro environment further reinforce the bearish scenario. The market tends to reward safe-haven currencies during periods of risk contraction, while more cyclical currencies exhibit structural weakness.

US30: Expecting Bearish Movement! Here is Why:
Balance of buyers and sellers on the US30 pair, that is best felt when all the timeframes are analyzed properly is shifting in favor of the sellers, therefore is it only natural that we go short on the pair.
Disclosure: I am part of Trade Nation's Influencer program and receive a monthly fee for using their TradingView charts in my analysis.
❤️ Please, support our work with like & comment! ❤️

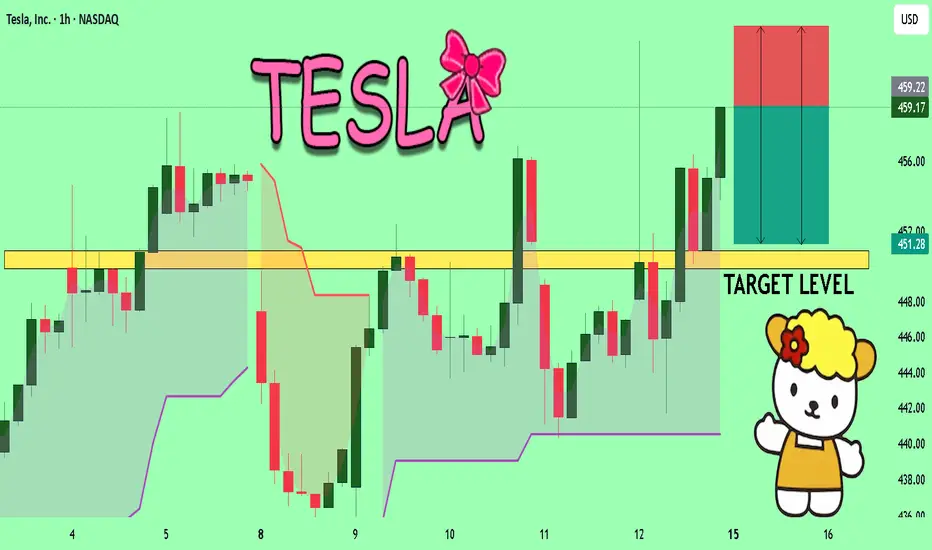
TESLA: Short Signal with Entry/SL/TP
TESLA
- Classic bearish setup
- Our team expects bearish continuation
SUGGESTED TRADE:
Swing Trade
Short TESLA
Entry Point - 459.19
Stop Loss - 463.87
Take Profit - 450.58
Our Risk - 1%
Start protection of your profits from lower levels
Disclosure: I am part of Trade Nation's Influencer program and receive a monthly fee for using their TradingView charts in my analysis.
❤️ Please, support our work with like & comment! ❤️

EURUSD: Bears Will Push
The charts are full of distraction, disturbance and are a graveyard of fear and greed which shall not cloud our judgement on the current state of affairs in the EURUSD pair price action which suggests a high likelihood of a coming move down.
Disclosure: I am part of Trade Nation's Influencer program and receive a monthly fee for using their TradingView charts in my analysis.
❤️ Please, support our work with like & comment! ❤️

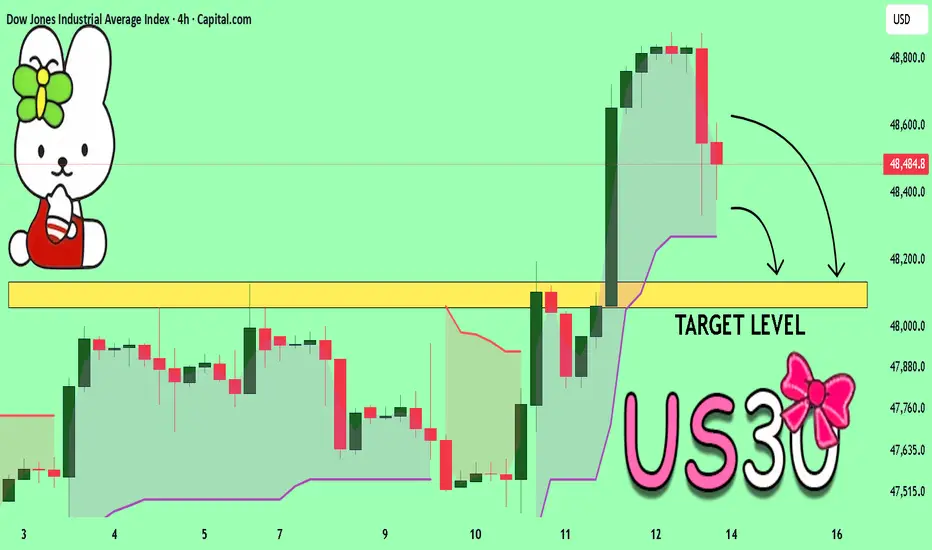
US30 Will Move Lower! Short!
Please, check our technical outlook for US30.
Time Frame: 9h
Current Trend: Bearish
Sentiment: Overbought (based on 7-period RSI)
Forecast: Bearish
The price is testing a key resistance 48,497.6.
Taking into consideration the current market trend & overbought RSI, chances will be high to see a bearish movement to the downside at least to 47,110.8 level.
P.S
The term oversold refers to a condition where an asset has traded lower in price and has the potential for a price bounce.
Overbought refers to market scenarios where the instrument is traded considerably higher than its fair value. Overvaluation is caused by market sentiments when there is positive news.
Like and subscribe and comment my ideas if you enjoy them!

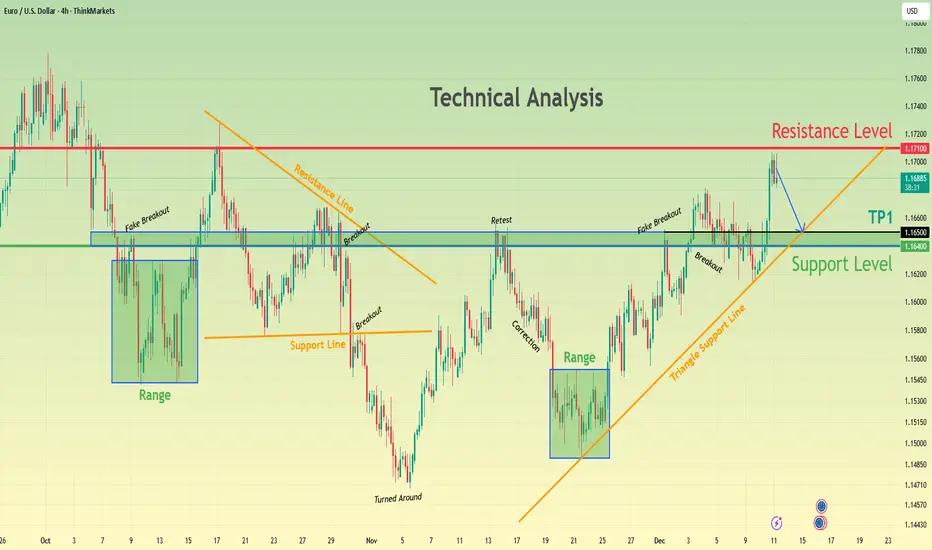
EURUSD Consolidates Below Resistance — Bears Aim for 1.1650Hello traders! Here’s my outlook on the current EURUSD setup. After a prolonged consolidation phase, the pair repeatedly respected the Support Level around 1.1640–1.1650, where buyers have consistently stepped in to defend the zone. This area has acted as a strong demand region, forming multiple ranges and triggering previous upward reversals. Each fake breakout below support confirmed that sellers failed to gain control, allowing price to rebound back into structure. Currently, EURUSD is trading within an ascending structure supported by the Triangle Support Line, which has guided price higher following the major turnaround. Along the way, several breakouts and retests validated bullish momentum as the pair pushed toward the key Resistance Level at 1.1710. This resistance remains the main barrier where price previously rejected and rotated lower. At this moment, EURUSD is approaching the Resistance Level again. If buyers maintain control and continue respecting the rising support line, the primary scenario is a pullback toward TP1 → 1.1650, where a major decision point awaits. This area has proven to be a reliable support level and aligns with previous retests, making it a critical zone for potential bullish continuation. A clean breakout above 1.1710 would open the door for a stronger upward move, signaling renewed bullish strength. However, if price breaks below the Triangle Support Line and falls under 1.1640, the bullish structure becomes invalid, and the market may return to deeper corrective levels. For now, the trend remains moderately bullish as long as price holds above support and stays within the rising structure. Please share this idea with your friends and click Boost 🚀
US30 A Fall Expected! SELL!
My dear followers,
I analysed this chart on US30 and concluded the following:
The market is trading on 48484 pivot level.
Bias - Bearish
Technical Indicators: Both Super Trend & Pivot HL indicate a highly probable Bearish continuation.
Target - 48132
About Used Indicators:
A super-trend indicator is plotted on either above or below the closing price to signal a buy or sell. The indicator changes color, based on whether or not you should be buying. If the super-trend indicator moves below the closing price, the indicator turns green, and it signals an entry point or points to buy.
Disclosure: I am part of Trade Nation's Influencer program and receive a monthly fee for using their TradingView charts in my analysis.
———————————
WISH YOU ALL LUCK
TESLA Trading Opportunity! SELL!
My dear friends,
Please, find my technical outlook for TESLA below:
The price is coiling around a solid key level - 458.17
Bias - Bearish
Technical Indicators: Pivot Points Low anticipates a potential price reversal.
Super trend shows a clear sell, giving a perfect indicators' convergence.
Goal - 450.88
Safe Stop Loss - 463.89
About Used Indicators:
The pivot point itself is simply the average of the high, low and closing prices from the previous trading day.
Disclosure: I am part of Trade Nation's Influencer program and receive a monthly fee for using their TradingView charts in my analysis.
———————————
WISH YOU ALL LUCK
NZDCAD Will Move Lower! Short!
Here is our detailed technical review for NZDCAD.
Time Frame: 1h
Current Trend: Bearish
Sentiment: Overbought (based on 7-period RSI)
Forecast: Bearish
The market is approaching a key horizontal level 0.805.
Considering the today's price action, probabilities will be high to see a movement to 0.803.
P.S
We determine oversold/overbought condition with RSI indicator.
When it drops below 30 - the market is considered to be oversold.
When it bounces above 70 - the market is considered to be overbought.
Like and subscribe and comment my ideas if you enjoy them!

USDJPY Is Going Down! Sell!
Please, check our technical outlook for USDJPY.
Time Frame: 1h
Current Trend: Bearish
Sentiment: Overbought (based on 7-period RSI)
Forecast: Bearish
The market is approaching a key horizontal level 155.844.
Considering the today's price action, probabilities will be high to see a movement to 155.434.
P.S
Please, note that an oversold/overbought condition can last for a long time, and therefore being oversold/overbought doesn't mean a price rally will come soon, or at all.
Like and subscribe and comment my ideas if you enjoy them!

AUDUSD Will Fall! Short!
Here is our detailed technical review for AUDUSD.
Time Frame: 1D
Current Trend: Bearish
Sentiment: Overbought (based on 7-period RSI)
Forecast: Bearish
The market is approaching a significant resistance area 0.665.
Due to the fact that we see a positive bearish reaction from the underlined area, I strongly believe that sellers will manage to push the price all the way down to 0.652 level.
P.S
The term oversold refers to a condition where an asset has traded lower in price and has the potential for a price bounce.
Overbought refers to market scenarios where the instrument is traded considerably higher than its fair value. Overvaluation is caused by market sentiments when there is positive news.
Like and subscribe and comment my ideas if you enjoy them!
