NZDJPY DAILY SHORTHi traders!
We have a good oppotunnity to Short NZDJPY !!
Hope you enjoy the video!
Good trading.
Xavi.
Short-trading

BITCOIN - Incredible Chart pattern formingHey Guys,
that was a exciting night wasn´t it? This is a further analysis to my last one. Check it out to have the full understanding.
In my opinion this is an amazing chart pattern what u can see here. My old analysis with the H&S was close to get retarded, but this night we had the expecting pump above the 6800 level.
This night we had some maintenances at the exchanges so they generated big spykes to different price levels. The chart on bitmex (provided by tradingview) shows the highest price at 7148. Directly on tradingview, watching the perpetual contract, we had a high at 6683. Kraken just went up to 6916.
In this chart analysis u can see a H&S continuation pattern in turquoise. And directly next to it, u can see a inverse H&S in blue, as a reversal signal. The amazing thing is, the same time we go up to set up the high for the right shoulder, we are finishing to form the left shoulder of our inverse H&S. The next incredible thing is, to finish the right shoulder of our H&S Bearish Continuation Pattern, we need to go to around 5700. And then the breakdown starts with cracking the neckline. That will build our inverse head. A regular fall down should be the same range, like the height of the head from the H&S continuation pattern. That would set a level at around 3600. That´s by the way the level where the big bull run from 21th September 2017 began.
I just drew the head till 4000. That would already be a very big price decreasing. Then we will go back up to the neckline and form the right shoulder. After breaking the neckline of our inverse H&S, everything is set up for the expected bull run, which could bring us to the 10k level.
Also there are some ETF news these days. It´s important to recognize the difference between these ETF applications. Tomorrow will be a decision, but that´s just a Future ETF and not the real one. The "real" one got postponed. I think the rejections/approvals will help the market to move in the right direction at the right moment, to form these perfect chart pattern.
Please don´t hesitate to write a comment if u agree or not. If u enjoy it, like it ;)
Good Time!

EURJPY testing previous breakdown. inside bar short opportunityEURJPY is testing previous level. good place to short the pullback. For confirmation, I might wait for the inside bar to break down.
Dan

US Dollar - DXY - Breakdown Expected US Dollar - Daily chart
Price is currently making a Rising Wedge pattern.
We are expecting to see a drop towards the support level before an upside move. A potential Inverse H&S is possible.

BTCUSD 29.06 Update New SLNew Stop Loss on break even 6276.3
What are your positions? Share with us in a comment!

BTC going lower short term - target 7200 and probably lowerLong term definately negative. Plenty of indicators showing continuation to down side. This is the perfect opportunity to sell. Sorry bulls :/

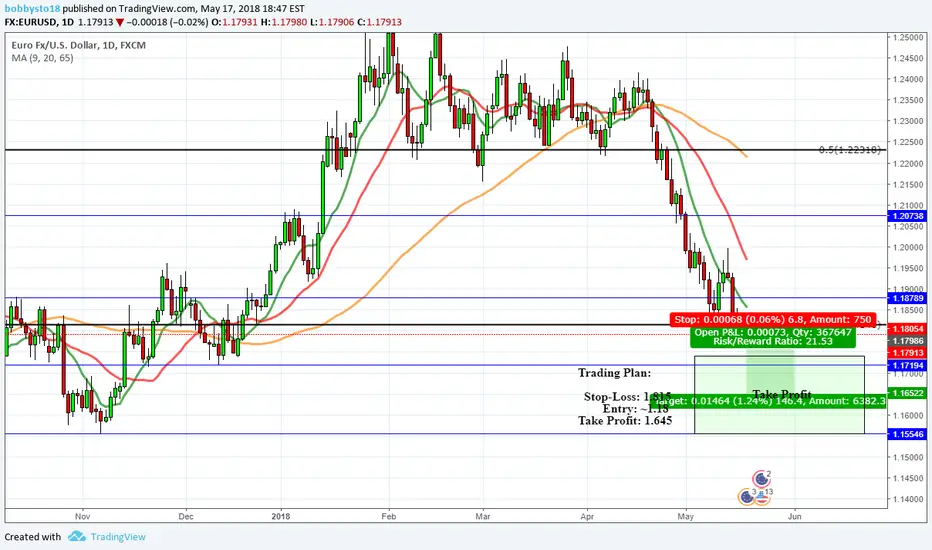
Keep it simpleEURUSD has been trending bearish now since April 19th. With only a slight fake out on the 10th of March before being stopped dead at resistance on the 9 day MA.
Its safe to say the overall trend is still looking bearish on the daily as price continues to make lower lows.
If we check out the monthly below we can see an inverse head and shoulders proceeded by the current bearish price action where we have stopped as of now on the .382 fib retracement.
Now checking out the EUR index (Essentially a weighted average of the EUR against counter pairs)
From a quick glance you can see what appear to be the formation of a reversal, giving us more reason to assume the EUR pairs will see a drop in the coming days.
Conversely looking at the USD index (weighted average once again) we see the opposite story.
Strong bullish trending since the 26th March and all 3 MA's (Sorry if you can't see I threw them all in pinescript, they are the 9,20 & 65) are starting to poit upwards ready to break out.
H&M warned 5 fays ago that a drop was happening...H&M was climbing for many days until it run out of fuel..and then a 4% drop came. The ones that prepared days ago did well today.


EURUSD Possible Move- Price broke the 4H trendline
- Expecting the price to retest the trendline
- White line is the first target, supported by EMA 800 (pink line)


EURUSD PULLBACK move200im expecting a downside move to the 1.11600 zone
First Target: 1.13200
Enjoy...

Don't Sleep..EURUSD Cypher Completed (1HR)It's funny how many can doubt the efficacy of the fibonacci tool when we see consistent reoccurences of such patterns in the marketplace. As I had charted a 4H cypher formation on the EURUSD, a mini cypher on the same pair (EURUSD) formed and completed right under our noses. Just goes to show you that you never know when the right opportunity may strike. Please use this as a study tool as need be, for I will be publishing this just for studying purposes as well. :) Cheers, and happy trading!
-John, J1TFX
**note** I accidentally labeled it as a 30 minute cypher. It was a cypher that I caught on both the 1hr and 30min, so it makes no difference.

Watch Breakout, Trend almost finishedNZDUSD ending the uptrend, wait the breakout and go short until trend line and see if break trend line and continue down or make another correction.
NZDUSD llegando al final de la tendencia alcista, espere la ruptura y entra en corto hasta la tendencia, este atent@ si rompe tendencia para seguir en largo o hace otra correccion.


GBP/AUD setting for lower levelsPrice found resistance at 1.67-ish level. Since then we saw a reversal and crossovers with many moving averages. I will short this position if price falls below 1.649 level. Stop will be at 1.6550 and profit target at 1.620. This gives me sufficient P:R ratio of 4.75.
From fundamental perspective one can favor the downside since China beated almost every analyst consensus number on todays news releases. (Strength for AUD)


NTNX high teens on the horizonCurrently trading at a 4 months low, Nautanix issued a weak Q3 guidance prompting the stock trade in an all time low territory. Fundamentals aside, trading over 10 times more than average volume on Friday and short float at 31%, I'd expect some sort of bounce early next week and would look for an entry around $24 or $25 if it can get up there to play on the short side. I'd expect NTNX to trade at high teens in next few weeks if it continues to trend downwards.
More details here : blog.buysellshortcover.com

Potential Short Opportunity. Upon breaking down EURAUD I was able to discover a advance pattern formation. Bullish Cypher.
Completion of the D leg has occurred and the first rejection so far has taken place. This pair can attempt the price of 1.41475 multiple times before committing to a reversal. So far, We have gotten exhausted candles illustrated in our H1 and H2 charts.
I am noticing a potential short opportunity to arise from this pattern. 1.41500 Being the utmost strength resistance.
Entry Conservative 1.41300)( Aggressive 1.41450-1.41500 (Current)
SL 1.41800 TP 1.41675 -30pips est TP-1.39950-140pips Est

NVDA - Head & shoulder formation short from $108.07 to $90 areaNVDA came up in our smart money course. It had a really long run, and now seems forming a Head & shoulder. Also seems forming a double top. We think it has very good down side potential & it can drop to $90 shortly.
* Trade Criteria *
Date First Found- February 13, 2017
Pattern/Why- Head & shoulder; Double top
Entry Target Criteria- Break of $108.07
Exit Target Criteria- $90
Stop Loss Criteria- $116.13
Please check back for Trade updates. (Note: Trade update is little delayed here.)
