NATGAS: Short Trading Opportunity
NATGAS
- Classic bearish formation
- Our team expects pullback
SUGGESTED TRADE:
Swing Trade
Short NATGAS
Entry - 3.000
Sl - 3.027
Tp - 2.949
Our Risk - 1%
Start protection of your profits from lower levels
Disclosure: I am part of Trade Nation's Influencer program and receive a monthly fee for using their TradingView charts in my analysis.
❤️ Please, support our work with like & comment! ❤️
Short

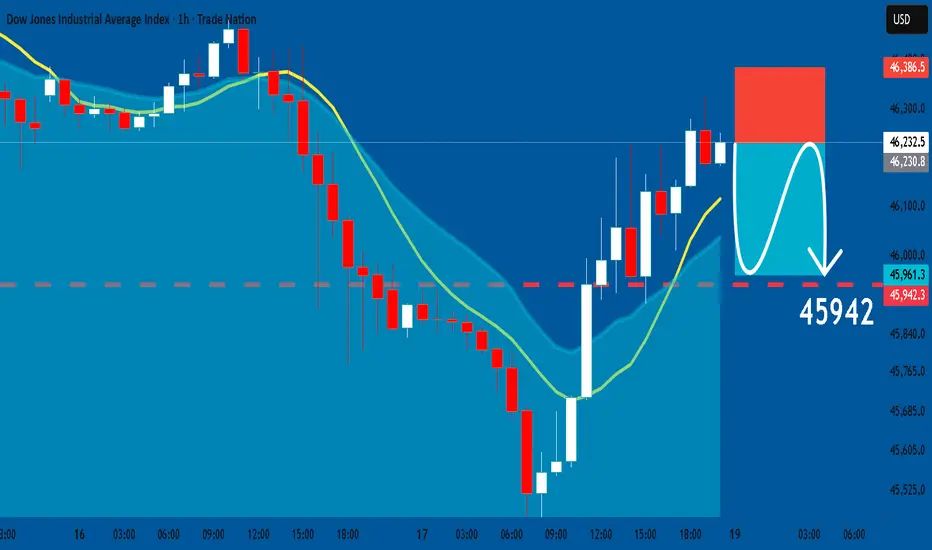
US30 Under Pressure! SELL!
My dear followers,
I analysed this chart on US30 and concluded the following:
The market is trading on 46.226 pivot level.
Bias - Bearish
Technical Indicators: Both Super Trend & Pivot HL indicate a highly probable Bearish continuation.
Target - 45.961
Safe Stop Loss - 46.378
About Used Indicators:
A super-trend indicator is plotted on either above or below the closing price to signal a buy or sell. The indicator changes color, based on whether or not you should be buying. If the super-trend indicator moves below the closing price, the indicator turns green, and it signals an entry point or points to buy.
Disclosure: I am part of Trade Nation's Influencer program and receive a monthly fee for using their TradingView charts in my analysis.
———————————
WISH YOU ALL LUCK

USDJPY Will Go Lower From Resistance! Sell!
Please, check our technical outlook for USDJPY.
Time Frame: 1h
Current Trend: Bearish
Sentiment: Overbought (based on 7-period RSI)
Forecast: Bearish
The market is trading around a solid horizontal structure 150.611.
The above observations make me that the market will inevitably achieve 150.126 level.
P.S
The term oversold refers to a condition where an asset has traded lower in price and has the potential for a price bounce.
Overbought refers to market scenarios where the instrument is traded considerably higher than its fair value. Overvaluation is caused by market sentiments when there is positive news.
Like and subscribe and comment my ideas if you enjoy them!

US30: Short Trade Explained
US30
- Classic bearish pattern
- Our team expects retracement
SUGGESTED TRADE:
Swing Trade
Sell US30
Entry - 46232
Stop - 46386
Take - 45943
Our Risk - 1%
Start protection of your profits from lower levels
Disclosure: I am part of Trade Nation's Influencer program and receive a monthly fee for using their TradingView charts in my analysis.
❤️ Please, support our work with like & comment! ❤️
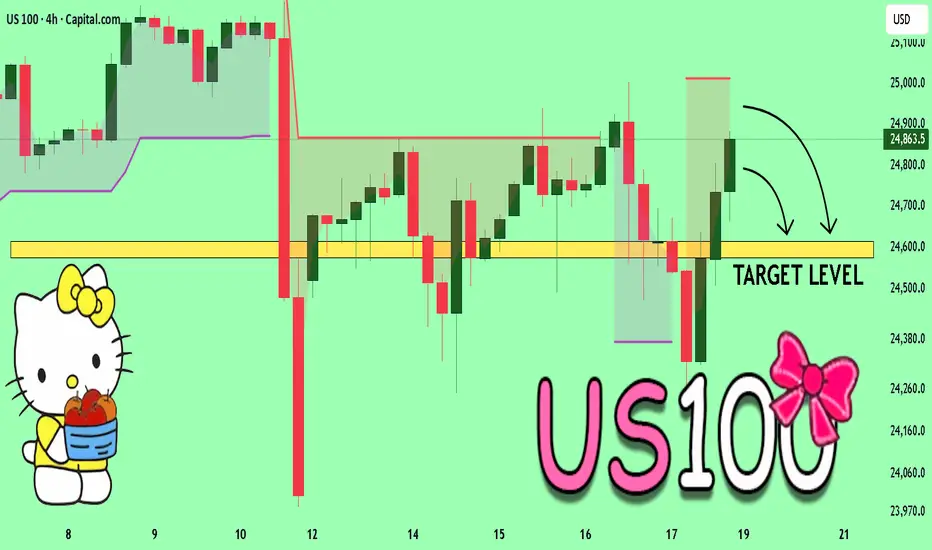
US100 A Fall Expected! SELL!
My dear friends,
Please, find my technical outlook for US100 below:
The instrument tests an important psychological level 24.863
Bias - Bearish
Technical Indicators: Supper Trend gives a precise Bearish signal, while Pivot Point HL predicts price changes and potential reversals in the market.
Target - 24.615
About Used Indicators:
Super-trend indicator is more useful in trending markets where there are clear uptrends and downtrends in price.
Disclosure: I am part of Trade Nation's Influencer program and receive a monthly fee for using their TradingView charts in my analysis.
———————————
WISH YOU ALL LUCK
Gold can Fail its Rally and Fall Towards 4125Hello traders, I want share with you my opinion about Gold. The market for Gold has been through a highly complex and volatile phase after breaking down from its prior upward channel. This led to a significant fall into the support zone, followed by a strong recovery that has since pushed the price of XAU above a major ascending trend line. Currently, the asset is undergoing a corrective pull-back towards this broken trend line, setting the stage for what I believe is a critical test. In my mind, the price action is setting up a potential 'bull trap'. I expect that the price will first make a correction to the trend line, find support, and then attempt another rally. I think this rally will be exhaustive and will fail upon reaching the 4280 mark. A confirmed rejection from that peak would signal a major reversal. The subsequent decline should have enough momentum to break the major ascending trend line. Therefore, I have placed my TP for this reversal scenario at 4125. Please share this idea with your friends and click Boost 🚀
Disclaimer: As part of ThinkMarkets’ Influencer Program, I am sponsored to share and publish their charts in my analysis.

BITCOIN Is Bearish! Short!
Here is our detailed technical review for BITCOIN.
Time Frame: 45m
Current Trend: Bearish
Sentiment: Overbought (based on 7-period RSI)
Forecast: Bearish
The market is testing a major horizontal structure 112,106.18.
Taking into consideration the structure & trend analysis, I believe that the market will reach 109,995.76 level soon.
P.S
We determine oversold/overbought condition with RSI indicator.
When it drops below 30 - the market is considered to be oversold.
When it bounces above 70 - the market is considered to be overbought.
Like and subscribe and comment my ideas if you enjoy them!

EURJPY Will Go Down! Sell!
Take a look at our analysis for EURJPY.
Time Frame: 2h
Current Trend: Bearish
Sentiment: Overbought (based on 7-period RSI)
Forecast: Bearish
The price is testing a key resistance 176.242.
Taking into consideration the current market trend & overbought RSI, chances will be high to see a bearish movement to the downside at least to 175.779 level.
P.S
Please, note that an oversold/overbought condition can last for a long time, and therefore being oversold/overbought doesn't mean a price rally will come soon, or at all.
Like and subscribe and comment my ideas if you enjoy them!

BITCOIN SHORT FROM RESISTANCE
BITCOIN SIGNAL
Trade Direction: short
Entry Level: 111,579.80
Target Level: 109,830.73
Stop Loss: 112,744.35
RISK PROFILE
Risk level: medium
Suggested risk: 1%
Timeframe: 1h
Disclosure: I am part of Trade Nation's Influencer program and receive a monthly fee for using their TradingView charts in my analysis.
✅LIKE AND COMMENT MY IDEAS✅

EUR/AUD BEST PLACE TO SELL FROM|SHORT
Hello, Friends!
EUR/AUD pair is in the downtrend because previous week’s candle is red, while the price is clearly rising on the 2H timeframe. And after the retest of the resistance line above I believe we will see a move down towards the target below at 1.794 because the pair is overbought due to its proximity to the upper BB band and a bearish correction is likely.
Disclosure: I am part of Trade Nation's Influencer program and receive a monthly fee for using their TradingView charts in my analysis.
✅LIKE AND COMMENT MY IDEAS✅

GOLD SELLERS WILL DOMINATE THE MARKET|SHORT
GOLD SIGNAL
Trade Direction: short
Entry Level: 4,341.28
Target Level: 4,245.41
Stop Loss: 4,404.72
RISK PROFILE
Risk level: medium
Suggested risk: 1%
Timeframe: 2h
Disclosure: I am part of Trade Nation's Influencer program and receive a monthly fee for using their TradingView charts in my analysis.
✅LIKE AND COMMENT MY IDEAS✅

Can USDJPY Hold Below 152.000? Sellers on WatchHey Traders,
In today’s session, we’re monitoring USDJPY for a selling opportunity around the 152.000 zone.
The pair remains within a broader downtrend, and current price action shows a corrective move approaching a key resistance area.
A rejection from this level could reaffirm the prevailing bearish momentum, while a breakout above may challenge the current trend structure.
Trade safe,
Joe.

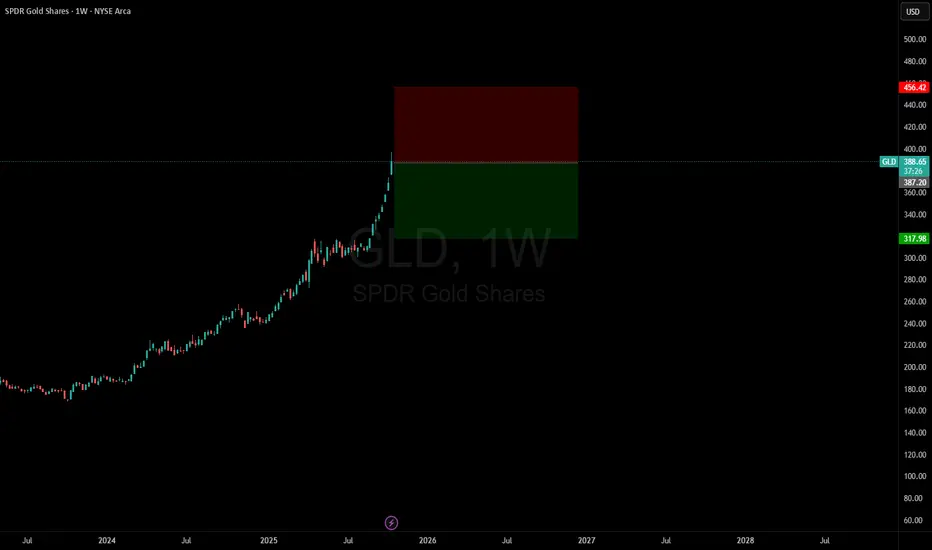
Short GLDGold is now over $4,200 and I believe there is a trade to the down-side.
Understand, it VERY hard to call a top in such a powerful bull market move. Most of the time, you WILL lose this trade.
Even when you do win these type of trades, the price action will usually go against you before it goes in the right direction.
It is a market. You WILL be tested.
That’s how price discovery works.
The truth is that if you're trying to outperform market-level returns, you MUST take risks.
CHFJPY Trading Opportunity! SELL!
My dear friends,
Please, find my technical outlook for CHFJPY below:
The instrument tests an important psychological level 189.87
Bias - Bearish
Technical Indicators: Supper Trend gives a precise Bearish signal, while Pivot Point HL predicts price changes and potential reversals in the market.
Target - 189.51
About Used Indicators:
Super-trend indicator is more useful in trending markets where there are clear uptrends and downtrends in price.
Disclosure: I am part of Trade Nation's Influencer program and receive a monthly fee for using their TradingView charts in my analysis.
———————————
WISH YOU ALL LUCK

ARKK — A “Short” Ranting🔱 ARKK isn’t a revolution - it’s a high-fee, high-drama lottery ticket dressed in a lab coat. 🔱
🏦 Here's my take on the Fundamentals 🏦
⚠️ Overpriced Dreams:
You’re paying luxury prices for companies that don’t make money—most can’t even spell “free cash flow.”
⚠️ Interest-Rate Kryptonite:
When rates rise, ARKK melts. Its “future profits” vanish faster than smoke in a wind tunnel.
⚠️Liquidity Trap:
It owns too much of too little; one wave of redemptions and it’s forced to dump stocks into a falling market.
⚠️ Weak Alpha, Big Fee:
For all the hype, it lags a plain NASDAQ ETF - you’re paying 0.75% to underperform.
⚠️ Factor Suicide:
It’s built from the worst statistical factors. Expensive, volatile, unprofitable stocks that hate inflation.
⚠️ Concentration Bomb:
Half the fund sits in a handful of “disruptors.” If one blows up, the whole thing shakes.
⚠️ Dumb Money Flow:
Retail investors chase this thing at highs and bail at lows. Every short seller’s dream.
⚠️ Copycats and Fee Drag:
Competitors now clone the “innovation” pitch cheaper and better, while ARKK drags its old fee chain.
📈 And finally, here's the Chart Analysis
This flying Pig is ready to be Barbequed.
It missed the pump up to the Warning Line and fell back into the Fork. Today it opened inside, and if nothing superstitious happens, it’ll close inside too.
So, I’m short - period.
As always, my first target is the Centerline.
Have a great weekend, everyone and grab some gas for the BBQ.

EURUSD: Expecting Bearish Continuation! Here is Why:
The analysis of the EURUSD chart clearly shows us that the pair is finally about to tank due to the rising pressure from the sellers.
Disclosure: I am part of Trade Nation's Influencer program and receive a monthly fee for using their TradingView charts in my analysis.
❤️ Please, support our work with like & comment! ❤️

EURJPY What Next? SELL!
My dear followers,
I analysed this chart on EURJPY and concluded the following:
The market is trading on 176.39 pivot level.
Bias - Bearish
Technical Indicators: Both Super Trend & Pivot HL indicate a highly probable Bearish continuation.
Target - 176.05
Safe Stop Loss - 176.59
About Used Indicators:
A super-trend indicator is plotted on either above or below the closing price to signal a buy or sell. The indicator changes color, based on whether or not you should be buying. If the super-trend indicator moves below the closing price, the indicator turns green, and it signals an entry point or points to buy.
Disclosure: I am part of Trade Nation's Influencer program and receive a monthly fee for using their TradingView charts in my analysis.
———————————
WISH YOU ALL LUCK

EURUSD Short: Targeting the 1.1560 Demand ZoneHello, traders! The prior market structure for EURUSD was a complex downward wedge, from which the price eventually broke out and entered the current consolidation range. This range has been established between the 1.1795 supply 2 level and a demand zone at the lows, with the price action rotating between these two key boundaries.
Currently, the auction is at a critical inflection point. After bouncing twice from the demand zone at the bottom of the range, the price has rallied back up to test the key horizontal supply at the 1.1670 level. After a brief test, the price has been rejected from this area, showing that sellers are in control here.
My scenario for the development of events is a continuation of this decline from the supply level. I believe this rejection confirms the range is still active and that the next logical move is a rotation back down to the lows. In my opinion, the bearish initiative from this rejection will be strong enough to push the price to the demand zone. The take-profit is therefore set at 1.1560. Manage your risk!

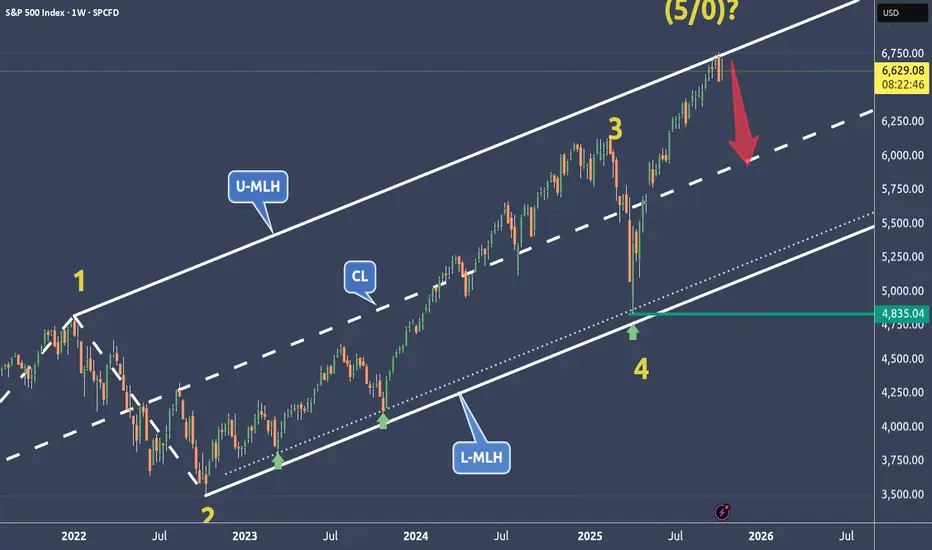
SPX is weakening at a very dangerous price level🔱 SPX is at a very dangerous price level ⚠️
...right at the Upper Median Line Parallel.
💰 If this market turns, the Centerline becomes the next target.
The 0-5 Count is also a good indication when prices start to turn at these extreme levels.
⚠️ Stay sharp — momentum is fading.
I wish you all a relaxing weekend.
GOLD Is Bearish! Short!
Take a look at our analysis for GOLD.
Time Frame: 4h
Current Trend: Bearish
Sentiment: Overbought (based on 7-period RSI)
Forecast: Bearish
The price is testing a key resistance 4,338.72.
Taking into consideration the current market trend & overbought RSI, chances will be high to see a bearish movement to the downside at least to 4,203.99 level.
P.S
We determine oversold/overbought condition with RSI indicator.
When it drops below 30 - the market is considered to be oversold.
When it bounces above 70 - the market is considered to be overbought.
Like and subscribe and comment my ideas if you enjoy them!

EURUSD Is Very Bearish! Sell!
Please, check our technical outlook for EURUSD.
Time Frame: 1D
Current Trend: Bearish
Sentiment: Overbought (based on 7-period RSI)
Forecast: Bearish
The market is trading around a solid horizontal structure 1.169.
The above observations make me that the market will inevitably achieve 1.146 level.
P.S
Overbought describes a period of time where there has been a significant and consistent upward move in price over a period of time without much pullback.
Like and subscribe and comment my ideas if you enjoy them!

GBPCAD Will Fall! Short!
Take a look at our analysis for GBPCAD.
Time Frame: 1D
Current Trend: Bearish
Sentiment: Overbought (based on 7-period RSI)
Forecast: Bearish
The market is approaching a key horizontal level 1.885.
Considering the today's price action, probabilities will be high to see a movement to 1.870.
P.S
The term oversold refers to a condition where an asset has traded lower in price and has the potential for a price bounce.
Overbought refers to market scenarios where the instrument is traded considerably higher than its fair value. Overvaluation is caused by market sentiments when there is positive news.
Like and subscribe and comment my ideas if you enjoy them!

EUR/NZD BEARISH BIAS RIGHT NOW| SHORT
EUR/NZD SIGNAL
Trade Direction: short
Entry Level: 2.042
Target Level: 2.007
Stop Loss: 2.066
RISK PROFILE
Risk level: medium
Suggested risk: 1%
Timeframe: 1D
Disclosure: I am part of Trade Nation's Influencer program and receive a monthly fee for using their TradingView charts in my analysis.
✅LIKE AND COMMENT MY IDEAS✅
