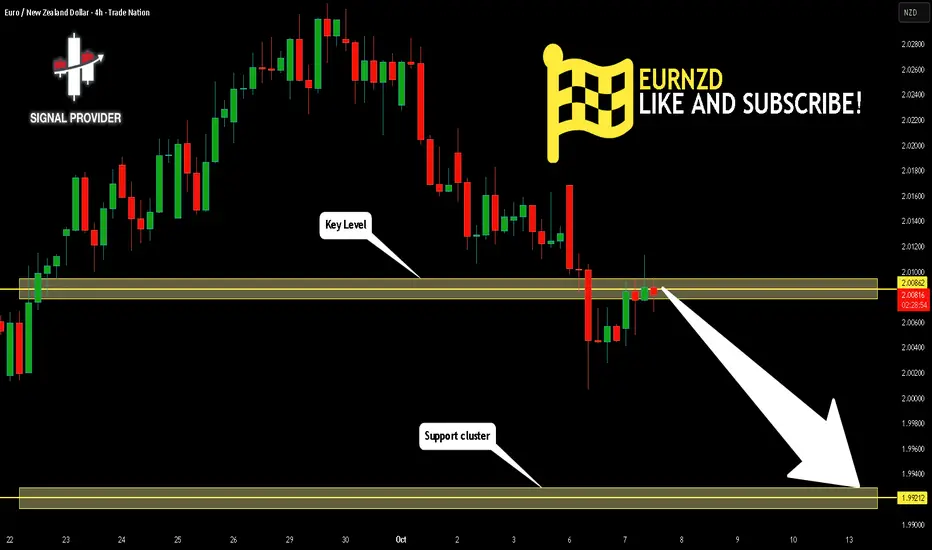
EURNZD Will Go Lower! Short!
Take a look at our analysis for EURNZD.
Time Frame: 4h
Current Trend: Bearish
Sentiment: Overbought (based on 7-period RSI)
Forecast: Bearish
The market is approaching a key horizontal level 2.008.
Considering the today's price action, probabilities will be high to see a movement to 1.992.
P.S
The term oversold refers to a condition where an asset has traded lower in price and has the potential for a price bounce.
Overbought refers to market scenarios where the instrument is traded considerably higher than its fair value. Overvaluation is caused by market sentiments when there is positive news.
Like and subscribe and comment my ideas if you enjoy them!
Short
AUDCHF My Opinion! SELL!
My dear friends,
AUDCHF looks like it will make a good move, and here are the details:
The market is trading on 0.5268 pivot level.
Bias - Bearish
Technical Indicators: Supper Trend generates a clear short signal while Pivot Point HL is currently determining the overall Bearish trend of the market.
Goal - 0.5260
Recommended Stop Loss - 0.5273
About Used Indicators:
Pivot points are a great way to identify areas of support and resistance, but they work best when combined with other kinds of technical analysis
Disclosure: I am part of Trade Nation's Influencer program and receive a monthly fee for using their TradingView charts in my analysis.
———————————
WISH YOU ALL LUCK

SILVER BEST PLACE TO SELL FROM|SHORT
SILVER SIGNAL
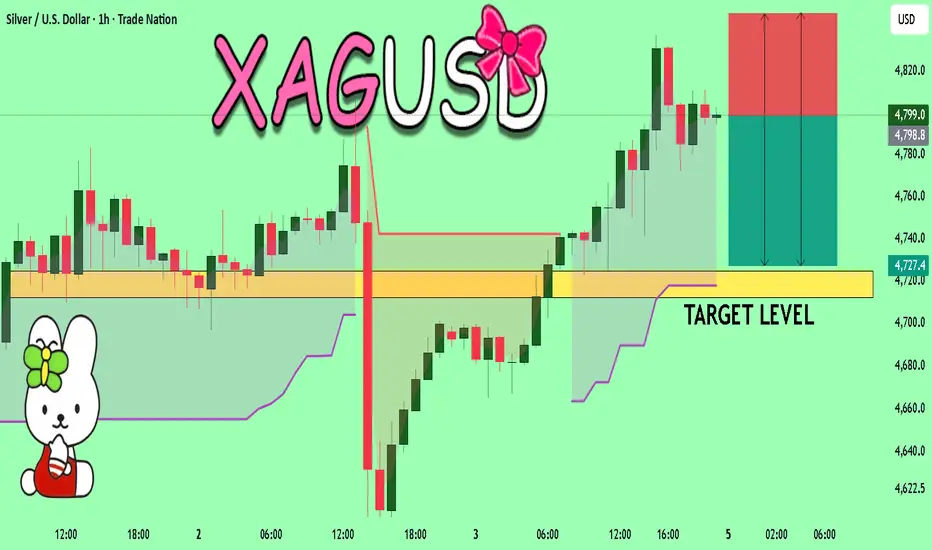
Trade Direction: short
Entry Level: 4,834.9
Target Level: 4,657.5
Stop Loss: 4,952.1
RISK PROFILE
Risk level: medium
Suggested risk: 1%
Timeframe: 9h
Disclosure: I am part of Trade Nation's Influencer program and receive a monthly fee for using their TradingView charts in my analysis.
✅LIKE AND COMMENT MY IDEAS✅

AUD/NZD BEARS ARE STRONG HERE|SHORT
AUD/NZD SIGNAL
Trade Direction: short
Entry Level: 1.134
Target Level: 1.133
Stop Loss: 1.135
RISK PROFILE
Risk level: medium
Suggested risk: 1%
Timeframe: 1h
Disclosure: I am part of Trade Nation's Influencer program and receive a monthly fee for using their TradingView charts in my analysis.
✅LIKE AND COMMENT MY IDEAS✅

CAD/CHF SHORT FROM RESISTANCE
Hello, Friends!
Bearish trend on CAD/CHF, defined by the red colour of the last week candle combined with the fact the pair is overbought based on the BB upper band proximity, makes me expect a bearish rebound from the resistance line above and a retest of the local target below at 0.570.
Disclosure: I am part of Trade Nation's Influencer program and receive a monthly fee for using their TradingView charts in my analysis.
✅LIKE AND COMMENT MY IDEAS✅

EUR/USD - 4H Forecast (Full Breakdown Linked)🔥 EUR/USD – 4H Forecast 🔥
Alright traders, here’s the 4H play for the Fiber 👇
🧠 Bias:
Short-term bearish, baby. Price just printed a Break of Structure (BOS) after a clean shift in momentum from the upside. The bulls are losing steam, and sellers are creeping back into the driver’s seat.
🧩 Technical Breakdown:
Price rejected beautifully from a 4H supply zone around 1.1750–1.1770, confirming bearish intent.
We’ve got a solid BOS and shift, setting the tone for a potential continuation leg down.
A minor pullback into the 4H zone could act as the sniper’s entry area.
Below sits a juicy imbalance and SSL (sell-side liquidity) near 1.1530–1.1560, waiting to get cleared.
🎯 Trade Idea:
Entry Zone: 1.1700–1.1740 (4H supply retest)
Target 1: 1.1580 (mid-range demand)
Target 2: 1.1440 (major liquidity pocket)
Invalidation: Above 1.1780 (if price reclaims the 4H supply, bias flips)
⚙️ Risk Management:
Stick to your plan — 1–2% risk max. Wait for confirmation candles or lower-TF rejection before diving in. No FOMO entries.
💬 Summary :
EUR/USD looks primed for a bearish continuation unless the bulls pull off a miracle reclaim. Eyes on that 4H zone — rejection there could kickstart the next drop.

DXY Watching 98.800 Resistance as Shutdown Risks Weigh on DollarHey Traders, in today’s trading session we are monitoring DXY for a potential selling opportunity around the 98.800 zone. The Dollar Index remains in a broader downtrend and is currently in a correction phase, with price approaching a key daily resistance area.
Structure: The market has been forming lower highs, consistent with bearish momentum. The 98.800 level aligns with both structural resistance and trendline rejection zones.
Fundamentals: The ongoing US government shutdown continues to pressure sentiment around the Dollar. The longer the impasse persists, the higher the risk of fiscal strain and downside pressure on the USD.
Next move: Watching how price reacts around 98.800 — a rejection here could confirm further downside continuation in line with the prevailing trend.
Trade safe,
Joe.

BTCUSD Setup You Can’t MissHey everyone, Kilian here!
The Bitcoin market keeps showing positive signals as the uptrend holds steady. On the technical chart, a double bottom pattern is gradually taking shape, with the first low followed by a higher low, a clear sign that buying pressure is building. At the moment, price is trading just above the neckline, a critical level that many analysts see as the key decision point for the next move.
If price holds above the neckline and confirms the breakout, the bullish scenario aiming toward 124,625 becomes stronger. But if the market slips back below this level, it could signal buyer weakness and raise the risk of a reversal.
As always, traders should wait for clear confirmation before entering, and stick to strict risk management rules in this volatile environment.
Trade safe and stay disciplined.

EURUSD: Price Bounce Down from Triangle ResistanceHello everyone, here is my breakdown of the current Euro setup.
Market Analysis
From a broader perspective, the key event that has defined the current market structure was a 'fake breakout' above the 1.1785 Resistance. After briefly trading above this level, the price was aggressively sold off, signaling strong seller presence and shifting the market into a corrective phase.
Currently, this corrective phase has taken the form of a large symmetrical triangle.
My Scenario & Strategy
The current rally to the triangle's resistance is, in my view, a corrective move that is likely to fail as it runs into an area of seller interest.
I'm looking for the price to complete its move and test the Triangle Resistance Line. The key signal would be a clear rejection from this line, confirming that sellers are still in control and that the consolidation is likely to resolve to the downside.
Therefore, the strategy is to watch for this rejection. A confirmed failure would validate the short scenario, potentially leading to a breakdown from the triangle. The primary target for this move is the 1.1695 Support.
That's the setup I'm tracking. Thank you for your attention, and always manage your risk.

06/10/25 Weekly OutlookLast weeks high: $125,735.08
Last weeks low: $111,559.20
Midpoint: $118,6547.14
New All Time High for Bitcoin in the first week of "Uptober", really impressive strength since flipping $117,500.
BTC still finds itself within a range between ATH and $108,000 but with such strength on the bounce from range lows, could we see price discovery going into the last leg of the year?
From a macro perspective month/quarter end is now over and done with, banks have completed their window dressing/de-risking and we can expect liquidity to flow back into the risk markets. Rate cut cycle continues, M2 Global money supply at ATH with seemingly no plans to stop in the near future.
For now I am still treating trading BTC as it is in a range until we get price acceptance above $125,000. If there is a breakout above and a rally altcoins should follow. In terms of news releases this week because of the US Government shutdown there is a disruption on data releases but overall nothing of great importance is disrupted.
Good luck this week everybody!

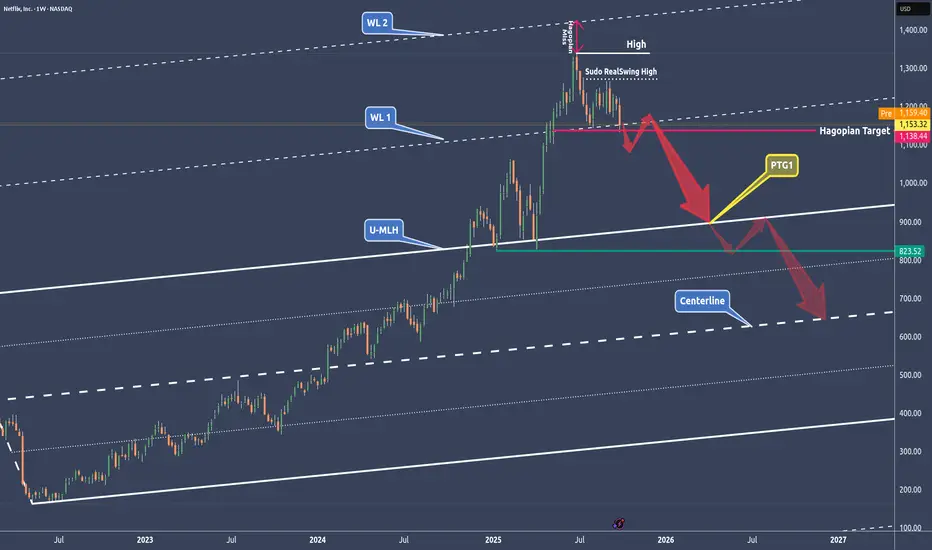
NFLX - NetFlix done after the run?🔱 A break of the WL1 could be the technical short signal 🔱
NetFlix had a monster run.
✅ Here’s a grounded fundamental breakdown of risks that could push Netflix downward. None of these are certainties, instead think of them as warning signs, not predictions.
👉 Slowing subscriber growth – growth in mature markets may plateau, and churn could rise if hit shows underperform.
👉 Rising competition and costs – rivals like Disney+ and Amazon force Netflix to spend more on content, squeezing profit margins.
👉 High valuation risk – expectations are lofty, so even a small earnings miss could trigger a sharp sell-off.
✅ Chart analysis
After missing WL2, we’ve got a Hagopian in play, which I’d say still hasn’t been fulfilled. The line was touched by a few ticks, but usually these lines break more decisively.
🔨 If we open and close below WL1, I’m stalking a pullback to it, just to hit the market on the head. If this break really happens, we’ll also have a clean structure for our stop, placed above the last RealSwing high.
🎯 The target is set in stone for me: It's the U-MLH and beyond, down to the Centerline.
Let’s stay focused and keep our cool.
Happy new week!
GOLD: Bearish Continuation & Short Signal
GOLD
- Classic bearish pattern
- Our team expects retracement
SUGGESTED TRADE:
Swing Trade
Sell GOLD
Entry - 3940.7
Stop - 3954.8
Take - 3915.7
Our Risk - 1%
Start protection of your profits from lower levels
Disclosure: I am part of Trade Nation's Influencer program and receive a monthly fee for using their TradingView charts in my analysis.
❤️ Please, support our work with like & comment! ❤️

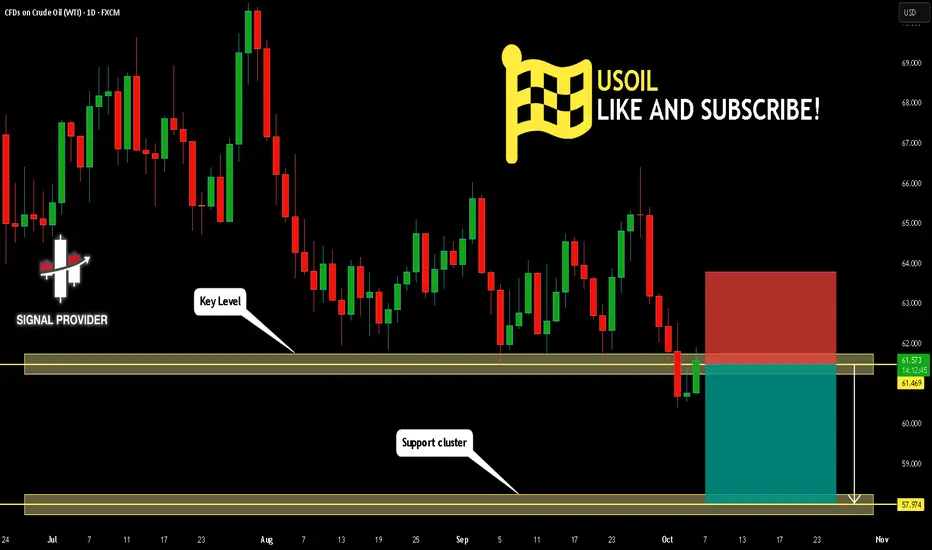
USOIL Will Move Lower! Sell!
Here is our detailed technical review for USOIL.
Time Frame: 1D
Current Trend: Bearish
Sentiment: Overbought (based on 7-period RSI)
Forecast: Bearish
The market is on a crucial zone of supply 61.469.
The above-mentioned technicals clearly indicate the dominance of sellers on the market. I recommend shorting the instrument, aiming at 57.974 level.
P.S
Overbought describes a period of time where there has been a significant and consistent upward move in price over a period of time without much pullback.
Like and subscribe and comment my ideas if you enjoy them!
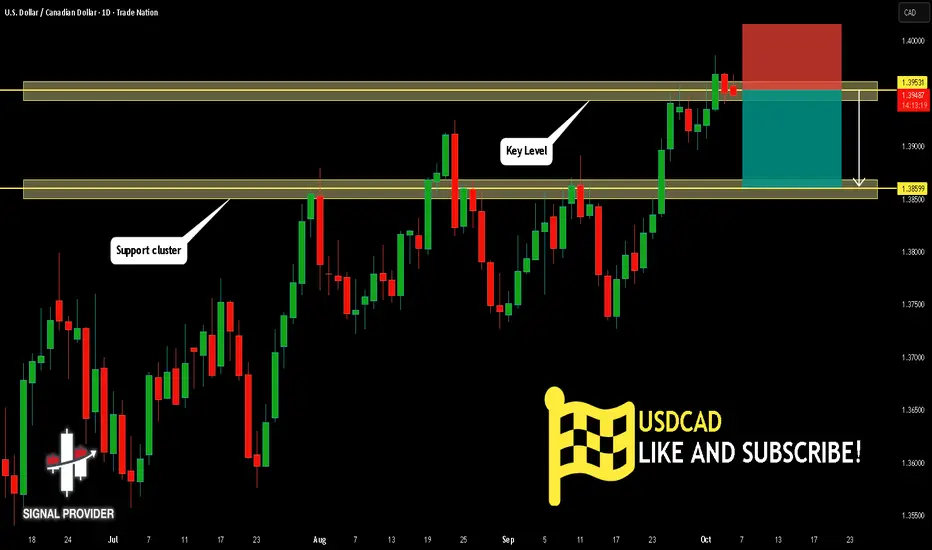
USDCAD Is Bearish! Short!
Take a look at our analysis for USDCAD.
Time Frame: 1D
Current Trend: Bearish
Sentiment: Overbought (based on 7-period RSI)
Forecast: Bearish
The price is testing a key resistance 1.395.
Taking into consideration the current market trend & overbought RSI, chances will be high to see a bearish movement to the downside at least to 1.385 level.
P.S
Please, note that an oversold/overbought condition can last for a long time, and therefore being oversold/overbought doesn't mean a price rally will come soon, or at all.
Like and subscribe and comment my ideas if you enjoy them!
AUDUSD Is Very Bearish! Sell!
Please, check our technical outlook for AUDUSD.
Time Frame: 2h
Current Trend: Bearish
Sentiment: Overbought (based on 7-period RSI)
Forecast: Bearish
The market is trading around a solid horizontal structure 0.660.
The above observations make me that the market will inevitably achieve 0.658 level.
P.S
The term oversold refers to a condition where an asset has traded lower in price and has the potential for a price bounce.
Overbought refers to market scenarios where the instrument is traded considerably higher than its fair value. Overvaluation is caused by market sentiments when there is positive news.
Like and subscribe and comment my ideas if you enjoy them!

GOLD SENDS CLEAR BEARISH SIGNALS|SHORT
GOLD SIGNAL
Trade Direction: short
Entry Level: 3,930.90
Target Level: 3,882.75
Stop Loss: 3,962.92
RISK PROFILE
Risk level: medium
Suggested risk: 1%
Timeframe: 1h
Disclosure: I am part of Trade Nation's Influencer program and receive a monthly fee for using their TradingView charts in my analysis.
✅LIKE AND COMMENT MY IDEAS✅

AUD/CAD BEARS ARE GAINING STRENGTH|SHORT
AUD/CAD SIGNAL
Trade Direction: short
Entry Level: 0.921
Target Level: 0.910
Stop Loss: 0.928
RISK PROFILE
Risk level: medium
Suggested risk: 1%
Timeframe: 1D
Disclosure: I am part of Trade Nation's Influencer program and receive a monthly fee for using their TradingView charts in my analysis.
✅LIKE AND COMMENT MY IDEAS✅

AUD/NZD SENDS CLEAR BEARISH SIGNALS|SHORT
Hello, Friends!
Previous week’s green candle means that for us the AUD/NZD pair is in the uptrend. And the current movement leg was also up but the resistance line will be hit soon and upper BB band proximity will signal an overbought condition so we will go for a counter-trend short trade with the target being at 1.137.
Disclosure: I am part of Trade Nation's Influencer program and receive a monthly fee for using their TradingView charts in my analysis.
✅LIKE AND COMMENT MY IDEAS✅

EUR/JPY SENDS CLEAR BEARISH SIGNALS|SHORT
Hello, Friends!
EUR/JPY is trending down which is clear from the red colour of the previous weekly candle. However, the price has locally surged into the overbought territory. Which can be told from its proximity to the BB upper band. Which presents a great trend following opportunity for a short trade from the resistance line above towards the demand level of 173.742.
Disclosure: I am part of Trade Nation's Influencer program and receive a monthly fee for using their TradingView charts in my analysis.
✅LIKE AND COMMENT MY IDEAS✅

BTCUSD Set To Fall! SELL!
My dear subscribers,
BTCUSD looks like it will make a good move, and here are the details:
The market is trading on 12278 pivot level.
Bias - Bearish
Technical Indicators: Both Super Trend & Pivot HL indicate a highly probable Bearish continuation.
Target - 11884
About Used Indicators:
The average true range (ATR) plays an important role in 'Supertrend' as the indicator uses ATR to calculate its value. The ATR indicator signals the degree of price volatility.
Disclosure: I am part of Trade Nation's Influencer program and receive a monthly fee for using their TradingView charts in my analysis.
———————————
WISH YOU ALL LUCK

EURUSD: Short Trading Opportunity
EURUSD
- Classic bearish setup
- Our team expects bearish continuation
SUGGESTED TRADE:
Swing Trade
Short EURUSD
Entry Point - 1.1741
Stop Loss - 1.1750
Take Profit - 1.1724
Our Risk - 1%
Start protection of your profits from lower levels
Disclosure: I am part of Trade Nation's Influencer program and receive a monthly fee for using their TradingView charts in my analysis.
❤️ Please, support our work with like & comment! ❤️

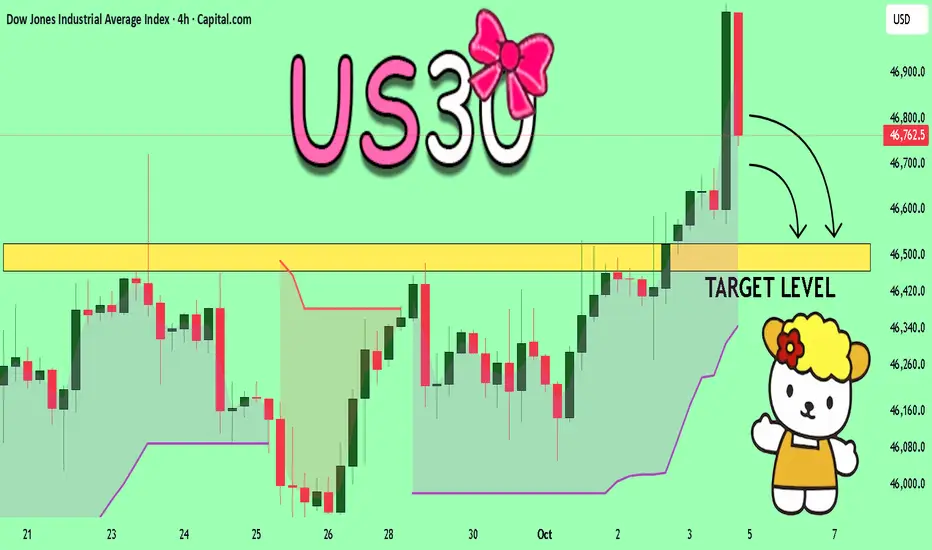
US30 Will Collapse! SELL!
My dear followers,
This is my opinion on the US30 next move:
The asset is approaching an important pivot point 46.762
Bias - Bearish
Technical Indicators: Supper Trend generates a clear short signal while Pivot Point HL is currently determining the overall Bearish trend of the market.
Goal - 46.525
About Used Indicators:
For more efficient signals, super-trend is used in combination with other indicators like Pivot Points.
Disclosure: I am part of Trade Nation's Influencer program and receive a monthly fee for using their TradingView charts in my analysis.
———————————
WISH YOU ALL LUCK
SILVER The Target Is DOWN! SELL!
My dear friends,
My technical analysis for SILVER is below:
The market is trading on 47.990 pivot level.
Bias - Bearish
Technical Indicators: Both Super Trend & Pivot HL indicate a highly probable Bearish continuation.
Target -47.247
Recommended Stop Loss -4848.0
About Used Indicators:
A pivot point is a technical analysis indicator, or calculations, used to determine the overall trend of the market over different time frames.
Disclosure: I am part of Trade Nation's Influencer program and receive a monthly fee for using their TradingView charts in my analysis.
———————————
WISH YOU ALL LUCK