EUR/CAD BEARS ARE STRONG HERE|SHORT
Hello, Friends!
EUR/CAD pair is trading in a local uptrend which we know by looking at the previous 1W candle which is green. On the 6H timeframe the pair is going up too. The pair is overbought because the price is close to the upper band of the BB indicator. So we are looking to sell the pair with the upper BB line acting as resistance. The next target is 1.627 area.
Disclosure: I am part of Trade Nation's Influencer program and receive a monthly fee for using their TradingView charts in my analysis.
✅LIKE AND COMMENT MY IDEAS✅
Short

GBPCHF Trading Opportunity! SELL!
My dear friends,
GBPCHF looks like it will make a good move, and here are the details:
The market is trading on 1.0605 pivot level.
Bias - Bearish
Technical Indicators: Supper Trend generates a clear short signal while Pivot Point HL is currently determining the overall Bearish trend of the market.
Goal - 1.0571
About Used Indicators:
Pivot points are a great way to identify areas of support and resistance, but they work best when combined with other kinds of technical analysis
Disclosure: I am part of Trade Nation's Influencer program and receive a monthly fee for using their TradingView charts in my analysis.
———————————
WISH YOU ALL LUCK

BITCOIN – LONG - 105K SWEEP BEFORE WE LEAPTraders,
In my latest analysis I said that Bitcoin will reach 117.000-117.500 before a bigger dump. Price didn't reach those levels yet, and dumped instantly instead.
However, the main thesis still stands: price is likely to reach that zone (117.000-117.500) before a larger reversal down. But before that, I expect a short squeeze beginning at $105.000.
Why I Expect a Squeeze
During the Asia session, new leveraged short exposure was built. Open Interest (OI) increased while Net Shorts rose, showing that traders were adding fresh short positions.
Around 107,000–107,500, both Spot CVD and Coin-Margined CVD are showing bullish divergence. Sellers are active, but price is holding, which indicates absorption.
Stablecoin-Margined CVD in the same range shows exhaustion, suggesting selling pressure is fading.
At New York open, OI continued to rise together with Net Longs, meaning aggressive longs are now fading into the short exposure created during Asia.
What This Means
Historically, the London and New York sessions tend to sweep Asia’s positioning. When Asia builds short exposure, the later sessions often push price higher to liquidate those shorts. This often results in a short squeeze, which aligns with what we may be seeing now.
Determining the Next Move Down
Before deciding if price extends lower first, we must identify the variables of probability (VOP) — the “magnets” that increase the likelihood of a lower sweep.
1. Weak Thursday Low
There is a weak low that has not been properly tested. In TPO (Time Price Opportunity) terms, a weak low forms when price finds temporary support without strong buying response. Such levels often get revisited.
2. Unswept Sunday 19 Oct Low
There is also an unswept Sunday low from 19 October. Sunday lows are often swept because weekend liquidity is thin and order books are shallow. When liquidity returns during the week, those inefficient areas tend to get filled.
Imbalances and Volume Gaps Below
Next we look for gaps, imbalances, or LVNs (Low Volume Nodes) — areas where trading activity was limited or one-sided. These zones often attract price because markets seek balance.
Many traders identify “fair value gaps” by looking at candles, but that only shows part of the picture. To locate the real inefficiency, we need to look inside the candles using order flow or a Fixed Range Volume Profile (FRVP) to find the exact levels of bid-ask imbalance.
Volume Profile and Fibonacci Confluence
Drawing the Fixed Range Volume Profile from the impulse move below the Sunday 19 Oct low shows a clear imbalance at 105,070.
Checking confluences:
The 0.786 Fibonacci retracement (low to high) aligns exactly with 105,070
The 0.886 retracement (higher low to high) also aligns exactly with 105,070
Fibonacci extensions (1.113 and 1.272) both target around 105,000
The 0.618 extension also lands near 105,000
Thesis Summary
Based on all data and confluence:
Price likely dips to sweep the weak 30 Oct low and the 19 Oct Sunday low
Target zone: LVN / imbalance near 105,000
Expect a liquidity grab that traps late shorts and shakes out weak longs
After that, expect a reversal toward 117,000–117,500, where the next major liquidity pool lies
Why a Lower Sweep Is Expected
The Asia session built significant short exposure
There is an inefficiency and low-volume magnet around 105k
Weak lows provide clear liquidity targets
Once those areas are cleared, market structure favors a strong reversal upward
In summary:
Bitcoin is likely to make one more sweep toward the 105,000 zone to clear liquidity before expanding upward into the 117,000–117,500 area, where a larger reversal setup is likely to form. Of course, price can always move up or down without perfectly respecting these levels — the market does not owe us precision. These levels simply represent the highest-probability areas based on current data and confluence.

Euro continued Weakness Points to 1.1480 RetestHello traders, I’d like to share my view on EURUSD. The current market structure shows a clear bearish momentum, with the pair consistently forming lower highs and lower lows inside a well-defined descending channel. The rejection from the 1.1660 Resistance Zone — which coincides with a strong Seller Zone — marked the beginning of a sustained downtrend. After a fake breakout attempt above the resistance, the market quickly reversed and continued to decline, confirming that sellers remain in control. The pair is now trading close to the Buyer Zone, which aligns with the Support Level around 1.1500–1.1480. This area has historically acted as a key demand region, making it crucial for the next price reaction. At the moment, EURUSD is respecting both the Resistance Line and the Support Line within the channel, showing the continuation of the bearish cycle. My primary scenario anticipates a potential short-term pullback toward the upper boundary of the channel (around 1.1560–1.1580) before another bearish impulse develops toward TP1 at 1.1480. However, a confirmed breakout above 1.1600 could invalidate this bearish setup and open the way for a broader correction toward the 1.1660 Resistance Level. Until then, the trend remains bearish, and I favor short opportunities targeting 1.1480 as the next key level. Please share this idea with your friends and click Boost 🚀

KRBN - Clear resistance for a potential short🔱 The multiple struggle at the Centerline gives us a hint for a potential short. 🔱
The thin slanted support needs to be broken and only then can we consider a move to the downside.
The L-MLH is my first PTG and the red Centerline my second.
Wish you all a happy new week and don't forget to watch my 👉 Weekly Trading Watchlist.

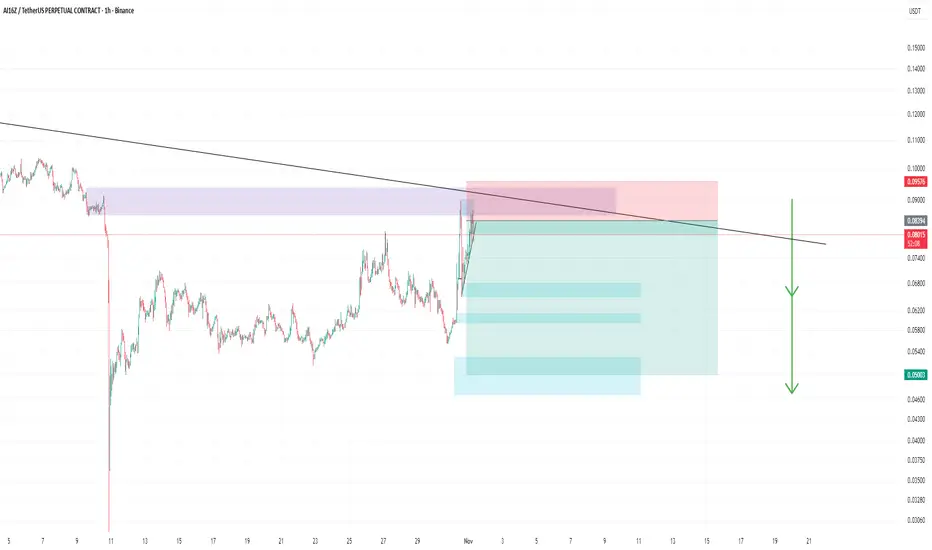
AI16Z Update #1 Short-positionHello everyone 😍
💁♂️ I'm back with an update on the analysis of the AI16Z cryptocurrency
Unfortunately, the previous analysis was accompanied by a bit of bad luck, but since the area in question was very important to me, I entered the short position again inside the blue circle and the first target was touched and it fell by 32%. 🔥🔥
First target area $0.067 ✅
Second target area $0.0602
Last target area $0.052
Did anyone use the analysis?
Was it useful for you?
Share your comments with me.
😍 Would you like to join my Telegram channel?
Our services will be free for the first 5 people 😎🔥
💁♂️ For coordination, send a message to the ID @mehdi_sh2025 on Telegram.
Earlier and more accurate positions will be posted on the Telegram channel. 🏌️
⚠️The analysis may not reach the final target, so at each target, if you make a good profit and see signs of a trend change, you can exit the trade or manage your capital.
⚠️ None of the analysis is a recommendation to buy or sell, but simply my personal opinions on the charts. You can use the charts and choose any that interest you and take a position if you wish.
To support me, I would appreciate it if you boost the analysis and share it with your friends so that I can analyze it with more energy for you, my dears. Thank you all. 💖

GBPCAD What Next? SELL!
My dear subscribers,
My technical analysis for GBPCAD is below:
The price is coiling around a solid key level - 1.8425
Bias - Bearish
Technical Indicators: Pivot Points High anticipates a potential price reversal.
Super trend shows a clear sell, giving a perfect indicators' convergence.
Goal - 1.8406
My Stop Loss - 1.8436
About Used Indicators:
By the very nature of the supertrend indicator, it offers firm support and resistance levels for traders to enter and exit trades. Additionally, it also provides signals for setting stop losses
Disclosure: I am part of Trade Nation's Influencer program and receive a monthly fee for using their TradingView charts in my analysis.
———————————
WISH YOU ALL LUCK

SILVER My Opinion! SELL!
My dear friends,
Please, find my technical outlook for SILVER below:
The price is coiling around a solid key level - 48.678
Bias - Bearish
Technical Indicators: Pivot Points Low anticipates a potential price reversal.
Super trend shows a clear sell, giving a perfect indicators' convergence.
Goal - 47.933
About Used Indicators:
The pivot point itself is simply the average of the high, low and closing prices from the previous trading day.
Disclosure: I am part of Trade Nation's Influencer program and receive a monthly fee for using their TradingView charts in my analysis.
———————————
WISH YOU ALL LUCK

AI16Z shortHello everyone 😍
💁♂️This time we are back with a great position with a setup
I think the AI16Z cryptocurrency can fall to the lower areas
⚠️This is my opinion and please check yours before entering the trade
First target area $0.067
Second target area $0.0602
Last target area $0.052
⚠️The analysis may not reach the final target, so at each target, if you make a good profit and see signs of a trend change, you can exit the trade or manage your capital.
⚠️ None of the analysis is a recommendation to buy or sell, but simply my personal opinions on the charts. You can use the charts and choose any that interest you and take a position if you wish.
To support me, I would appreciate it if you boost the analysis and share it with your friends so that I can analyze it with more energy for you, my dears. Thank you all. 💖
USDCAD: Expecting Bearish Continuation! Here is Why:
The price of USDCAD will most likely collapse soon enough, due to the supply beginning to exceed demand which we can see by looking at the chart of the pair.
Disclosure: I am part of Trade Nation's Influencer program and receive a monthly fee for using their TradingView charts in my analysis.
❤️ Please, support our work with like & comment! ❤️

EURUSD Trading Opportunity! SELL!
My dear friends,
My technical analysis for EURUSD is below:
The market is trading on 1.1659 pivot level.
Bias - Bearish
Technical Indicators: Both Super Trend & Pivot HL indicate a highly probable Bearish continuation.
Target - 1.1623
About Used Indicators:
A pivot point is a technical analysis indicator, or calculations, used to determine the overall trend of the market over different time frames.
Disclosure: I am part of Trade Nation's Influencer program and receive a monthly fee for using their TradingView charts in my analysis.
———————————
WISH YOU ALL LUCK

USDJPY Trading Opportunity! SELL!
My dear subscribers,
My technical analysis for USDJPY is below:
The price is coiling around a solid key level - 154.15
Bias - Bearish
Technical Indicators: Pivot Points High anticipates a potential price reversal.
Super trend shows a clear sell, giving a perfect indicators' convergence.
Goal - 153.12
About Used Indicators:
By the very nature of the supertrend indicator, it offers firm support and resistance levels for traders to enter and exit trades. Additionally, it also provides signals for setting stop losses
Disclosure: I am part of Trade Nation's Influencer program and receive a monthly fee for using their TradingView charts in my analysis.
———————————
WISH YOU ALL LUCK

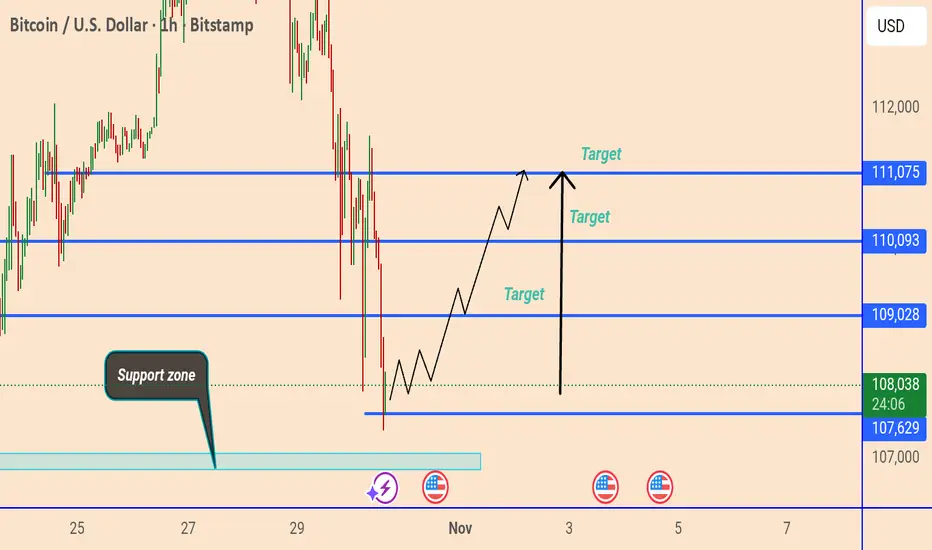
Bitcoin Price Analysis: Potential Rebound from Key Support Zone This chart shows the BTC/USD (1-hour) price action with key support and resistance levels. Bitcoin is currently trading near $107,904, slightly above a highlighted support zone around $107,629–$107,000. The analysis suggests a potential bullish reversal from this support, with projected upside targets at $109,028, $110,093, and $111,075.
GOLD The Target Is DOWN! SELL!
My dear friends,
My technical analysis for GOLD is below:
The market is trading on 4022.7 pivot level.
Bias - Bearish
Technical Indicators: Both Super Trend & Pivot HL indicate a highly probable Bearish continuation.
Target - 4010.3
Recommended Stop Loss - 4030.0
About Used Indicators:
A pivot point is a technical analysis indicator, or calculations, used to determine the overall trend of the market over different time frames.
Disclosure: I am part of Trade Nation's Influencer program and receive a monthly fee for using their TradingView charts in my analysis.
———————————
WISH YOU ALL LUCK

GOLD SELLERS WILL DOMINATE THE MARKET|SHORT
GOLD SIGNAL
Trade Direction: short
Entry Level: 4,010.34
Target Level: 3,889.94
Stop Loss: 4,089.87
RISK PROFILE
Risk level: medium
Suggested risk: 1%
Timeframe: 4h
Disclosure: I am part of Trade Nation's Influencer program and receive a monthly fee for using their TradingView charts in my analysis.
✅LIKE AND COMMENT MY IDEAS✅

AUD/CHF BEARS ARE STRONG HERE|SHORT
Hello, Friends!
AUD/CHF is making a bullish rebound on the 12H TF and is nearing the resistance line above while we are generally bearish biased on the pair due to our previous 1W candle analysis, thus making a trend-following short a good option for us with the target being the 0.517 level.
Disclosure: I am part of Trade Nation's Influencer program and receive a monthly fee for using their TradingView charts in my analysis.
✅LIKE AND COMMENT MY IDEAS✅

GBP/AUD SHORT FROM RESISTANCE
Hello, Friends!
It makes sense for us to go short on GBP/AUD right now from the resistance line above with the target of 2.044 because of the confluence of the two strong factors which are the general downtrend on the previous 1W candle and the overbought situation on the lower TF determined by it’s proximity to the upper BB band.
Disclosure: I am part of Trade Nation's Influencer program and receive a monthly fee for using their TradingView charts in my analysis.
✅LIKE AND COMMENT MY IDEAS✅

USDJPY Is Going Down! Short!
Here is our detailed technical review for USDJPY.
Time Frame: 2h
Current Trend: Bearish
Sentiment: Overbought (based on 7-period RSI)
Forecast: Bearish
The market is on a crucial zone of supply 154.213.
The above-mentioned technicals clearly indicate the dominance of sellers on the market. I recommend shorting the instrument, aiming at 153.254 level.
P.S
The term oversold refers to a condition where an asset has traded lower in price and has the potential for a price bounce.
Overbought refers to market scenarios where the instrument is traded considerably higher than its fair value. Overvaluation is caused by market sentiments when there is positive news.
Like and subscribe and comment my ideas if you enjoy them!

AUDUSD Will Fall! Sell!
Take a look at our analysis for AUDUSD.
Time Frame: 4h
Current Trend: Bearish
Sentiment: Overbought (based on 7-period RSI)
Forecast: Bearish
The price is testing a key resistance 0.654.
Taking into consideration the current market trend & overbought RSI, chances will be high to see a bearish movement to the downside at least to 0.650 level.
P.S
We determine oversold/overbought condition with RSI indicator.
When it drops below 30 - the market is considered to be oversold.
When it bounces above 70 - the market is considered to be overbought.
Like and subscribe and comment my ideas if you enjoy them!

GBPAUD Will Go Lower From Resistance! Short!
Please, check our technical outlook for GBPAUD.
Time Frame: 6h
Current Trend: Bearish
Sentiment: Overbought (based on 7-period RSI)
Forecast: Bearish
The market is trading around a solid horizontal structure 2.008.
The above observations make me that the market will inevitably achieve 1.984 level.
P.S
Overbought describes a period of time where there has been a significant and consistent upward move in price over a period of time without much pullback.
Like and subscribe and comment my ideas if you enjoy them!

EURUSD Will Go Lower! Sell!
Take a look at our analysis for EURUSD.
Time Frame: 2h
Current Trend: Bearish
Sentiment: Overbought (based on 7-period RSI)
Forecast: Bearish
The market is approaching a key horizontal level 1.160.
Considering the today's price action, probabilities will be high to see a movement to 1.157.
P.S
The term oversold refers to a condition where an asset has traded lower in price and has the potential for a price bounce.
Overbought refers to market scenarios where the instrument is traded considerably higher than its fair value. Overvaluation is caused by market sentiments when there is positive news.
Like and subscribe and comment my ideas if you enjoy them!

BTCUSD Short: Targeting 108,000 Demand ZoneHello, traders! Bitcoin (BTCUSD) has recently transitioned from a prolonged bullish structure into a corrective phase after facing strong rejection from the 116,000 Supply Zone. The market previously traded inside a well-defined Ascending Channel, forming a steady sequence of higher highs and higher lows — a classic bullish formation.However, after testing the upper boundary of the channel and the Pivot Point, BTC failed to sustain bullish momentum. The breakout attempts above the supply zone turned out to be fake breakouts, showing exhaustion among buyers. Since then, the market has shifted its tone and started to form a descending structure, moving below the Supply Line that now acts as dynamic resistance.
Currently, the price is pushing lower from the mid-range of the channel toward the Demand Zone, located between 108,000 and 107,700. This area has previously served as a strong support base that triggered impulsive bullish reversals in the past.
In my opinion, BTC is likely to extend its bearish correction toward the 108,000–107,700 demand area. A successful test and strong reaction from this zone could mark a potential bullish reversal, confirming demand absorption and the end of the correction phase. However, if sellers maintain control and manage to break decisively below 107,700, the market may open the way for a deeper decline toward the 106,000 level. As long as the price remains below the Supply Line, short-term bearish pressure prevails. I’m currently bearish to neutral, looking for price action signals around the demand area to confirm whether a new upward impulse is about to begin. Manage your risk!

Gold is Trading Under The Pressure of a Strong Dollar!!Hey Traders, in today's trading session we are monitoring XAUUSD for a selling opportunity around 4,020 zone, Gold is trading in a downtrend and currently is in a correction phase in which it is approaching the trend at 4,020 support and resistance area.
Trade safe, Joe.
