EURUSD Trading Opportunity! SELL!
My dear followers,
I analysed this chart on EURUSD and concluded the following:
The market is trading on 1.1809 pivot level.
Bias - Bearish
Technical Indicators: Both Super Trend & Pivot HL indicate a highly probable Bearish continuation.
Target - 1.1749
About Used Indicators:
A super-trend indicator is plotted on either above or below the closing price to signal a buy or sell. The indicator changes color, based on whether or not you should be buying. If the super-trend indicator moves below the closing price, the indicator turns green, and it signals an entry point or points to buy.
Disclosure: I am part of Trade Nation's Influencer program and receive a monthly fee for using their TradingView charts in my analysis.
———————————
WISH YOU ALL LUCK
Short

SILVER BEARS WILL DOMINATE THE MARKET|SHORT
SILVER SIGNAL
Trade Direction: short
Entry Level: 4,275.6
Target Level: 4,185.4
Stop Loss: 4,335.0
RISK PROFILE
Risk level: medium
Suggested risk: 1%
Timeframe: 3h
Disclosure: I am part of Trade Nation's Influencer program and receive a monthly fee for using their TradingView charts in my analysis.
✅LIKE AND COMMENT MY IDEAS✅

EUR/NZD SENDS CLEAR BEARISH SIGNALS|SHORT
EUR/NZD SIGNAL
Trade Direction: short
Entry Level: 1.972
Target Level: 1.961
Stop Loss: 1.979
RISK PROFILE
Risk level: medium
Suggested risk: 1%
Timeframe: 3h
Disclosure: I am part of Trade Nation's Influencer program and receive a monthly fee for using their TradingView charts in my analysis.
✅LIKE AND COMMENT MY IDEAS✅

EUR/CAD SELLERS WILL DOMINATE THE MARKET|SHORT
Hello, Friends!
We are now examining the EUR/CAD pair and we can see that the pair is going up locally while also being in a uptrend on the 1W TF. But there is also a powerful signal from the BB upper band being nearby, indicating that the pair is overbought so we can go short from the resistance line above and a target at 1.597 level.
Disclosure: I am part of Trade Nation's Influencer program and receive a monthly fee for using their TradingView charts in my analysis.
✅LIKE AND COMMENT MY IDEAS✅

USDJPY Is Bearish! Sell!
Here is our detailed technical review for USDJPY.
Time Frame: 1D
Current Trend: Bearish
Sentiment: Overbought (based on 7-period RSI)
Forecast: Bearish
The market is on a crucial zone of supply 146.990.
The above-mentioned technicals clearly indicate the dominance of sellers on the market. I recommend shorting the instrument, aiming at 144.781 level.
P.S
Overbought describes a period of time where there has been a significant and consistent upward move in price over a period of time without much pullback.
Like and subscribe and comment my ideas if you enjoy them!

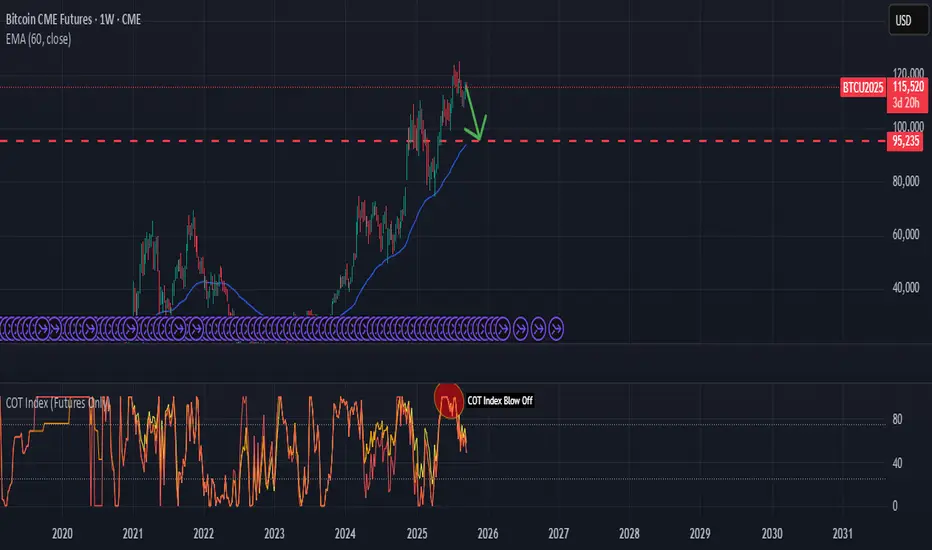
Bitcoin Blow-Off TopBitcoin is showing signs of exhaustion after a strong rally into the $120k region. On the weekly timeframe, several signals point toward a potential corrective leg lower:
📊 Key Technicals
Major Supply Zone: $115k–$120k area has acted as resistance, with sellers defending this level.
Trend Structure: Price has broken momentum after the blow-off move and is now trading below recent highs.
EMA Support: Price is extended above the EMA 60 (94k), leaving room for mean reversion.
COT Data: Commercials are heavily net short with a COT Index blow-off signal, indicating distribution from strong hands to weak hands.
🎯 Trade Thesis
The risk-reward favors the short side from current levels.
Initial downside target sits at the $95k region (prior resistance turned support + EMA alignment).
A break of that level could open the door toward the $80k handle in the medium term.
📌 Plan
Entry: 114k–116k
Stop: Above 120k
Targets:
TP1: 95k
TP2: 80k
💡 This setup combines market structure, supply zone rejection, and institutional positioning via COT. The technical picture suggests Bitcoin is vulnerable to a deeper pullback before any further sustainable rally.
DOGUSDT: Potential Reversal at Key Level in Rising ChannelHey everyone, Ken here!
Right now, I'm closely watching DOGUSDT and it seems like it might be going through a correction phase as the price tests the lower boundary of the rising channel. This is a key level, and if the price bounces from here, I believe it could continue towards the next target around 0.3200.
However, if the price breaks below this support, the bullish outlook would weaken, and we could see further declines. That’s why I always pay close attention to price action and trading volume to identify solid buying opportunities.
Risk management is essential in trading, so I always make sure to carefully confirm setups and trade with caution. What do you think about the current situation? Feel free to share your thoughts in the comments!

Long Term Btc PlanI can see BTC going to take 85k.
People think "Below 90k bull run is over"
Would cause extreme fear/panic in the markets if broken below 90k. basically reaching 85-86k would be cause just by paper hands at the end being scared out of their positions.
Currently Looking for bigger shorts and small longs only. Exception if BTC breaks above 118.5k and shows bullish signals.
Will look for reenter spot below 90/100k depends on situation.
Want to see Diamond Top playout on 4h, then break above it or reject from 786/886 fibb and enter big short to 105/90s.
The Long/Short Positions on chart is worth looking at, I have alerts near all entries/SL/Tp and even S/R.
I had a thought that next big crash might be caused by an exchange going tits up at near top, and I have intuition it might be MEXC.
NOT YOUR KEYS NOT YOUR ASSETS.

BTC short at 116000 to 110500Short BTC116000 looks doable.
E: 116000
SL: 117500
TP1: 113555
TP2: 110500
TP3: 105000
Possibility of 96k, but I doubt it at this moment. would need to take 119k first in my belief, and now there is too many bearish signs for that.
Currently BTC moving after bearish Symmetrical Triangle, forming Diamond Top pattern, perfect entry would be around 116000.
Looks like February 2025

GBPJPY: Bearish Forecast & Bearish Scenario
It is essential that we apply multitimeframe technical analysis and there is no better example of why that is the case than the current GBPJPY chart which, if analyzed properly, clearly points in the downward direction.
Disclosure: I am part of Trade Nation's Influencer program and receive a monthly fee for using their TradingView charts in my analysis.
❤️ Please, support our work with like & comment! ❤️

EURUSD - 15-Minute Opportunity – Risk/Reward 2.22Guys, greetings
I’ve prepared an EURUSD analysis for you.
On my 15-minute chart:
🟢 Buy entry level: 1.17152
🔴 Stop level: 1.17002
🎯 TP1: 1.17206
🎯 TP2: 1.17287
🎯 TP3: 1.17480
Risk/reward ratio for this trade: 2.22
Guys, every single like you give is my biggest motivation to keep sharing these analyses.
Thank you to all my friends who support me with their likes and stand by my side.

EURJPY What Next? SELL!
My dear friends,
EURJPY looks like it will make a good move, and here are the details:
The market is trading on 173.30 pivot level.
Bias - Bearish
Technical Indicators: Supper Trend generates a clear short signal while Pivot Point HL is currently determining the overall Bearish trend of the market.
Goal - 172.84
About Used Indicators:
Pivot points are a great way to identify areas of support and resistance, but they work best when combined with other kinds of technical analysis
Disclosure: I am part of Trade Nation's Influencer program and receive a monthly fee for using their TradingView charts in my analysis.
———————————
WISH YOU ALL LUCK

GBPCAD My Opinion! SELL!
My dear subscribers,
My technical analysis for GBPCAD is below:
The price is coiling around a solid key level - 1.8803
Bias - Bearish
Technical Indicators: Pivot Points Low anticipates a potential price reversal.
Super trend shows a clear sell, giving a perfect indicators' convergence.
Goal - 1.8779
My Stop Loss - 1.8816
About Used Indicators:
By the very nature of the supertrend indicator, it offers firm support and resistance levels for traders to enter and exit trades. Additionally, it also provides signals for setting stop losses
Disclosure: I am part of Trade Nation's Influencer program and receive a monthly fee for using their TradingView charts in my analysis.
———————————
WISH YOU ALL LUCK

SOL Parabolic Run Despite the recent chop, when you zoom out to the 1D timeframe there is a clear pattern being followed since the April crash.
From the sub $100 low Solana has posted progressively higher lows in a parabolic fashion. The highs on the other hand are in more of a linear fashion as shown by the diagonal S/R level, at first it provided support and now since March it has been resistance.
So for me there are two possible actionable trades:
- Continuation of the parabolic move, this would include flipping the Diagonal S/R level, currently at time of writing this resistance level is being tested, a close above gives a better possibility of the rally continuing.
- The rally becomes exhausted and fails to flip the Diagonal S/R and loses the parabolic support level. Should this support break $185 is the first target (light green zone), $160 as the second target (dark green zone).
Important to remember we have CPI & FOMC rapidly approaching that could provide the volatility to trigger either of these moves, lets see what happens next.

EURUSD: Bearish Continuation
The analysis of the EURUSD chart clearly shows us that the pair is finally about to tank due to the rising pressure from the sellers.
Disclosure: I am part of Trade Nation's Influencer program and receive a monthly fee for using their TradingView charts in my analysis.
❤️ Please, support our work with like & comment! ❤️

EURCAD: Bearish Continuation & Short Trade
EURCAD
- Classic bearish pattern
- Our team expects retracement
SUGGESTED TRADE:
Swing Trade
Sell EURCAD
Entry - 1.6249
Stop - 1.6257
Take - 1.6233
Our Risk - 1%
Start protection of your profits from lower levels
Disclosure: I am part of Trade Nation's Influencer program and receive a monthly fee for using their TradingView charts in my analysis.
❤️ Please, support our work with like & comment! ❤️

EURUSD Short: Rejection from Channel ResistanceHello, traders! The price auction for EURUSD has been in a bullish phase, with the market structure being defined by a large upward wedge. This pattern has been guiding the price higher through a series of higher highs and higher lows, but such formations often signal that the underlying trend is losing momentum and may be approaching a point of exhaustion.
Currently, the price action is at a critical inflection point, testing the upper resistance line of this multi-week wedge. The auction is being squeezed into the apex of the pattern, a situation that typically precedes a volatile move. This is a key area where sellers are expected to challenge the bullish initiative and attempt to take control.
The primary scenario anticipates a bearish resolution to this upward wedge. The expectation is that the price will be rejected from the resistance line, triggering a sharp reversal. This move is expected to have sufficient momentum to break down below the wedge's ascending support line, confirming a structural shift. The take-profit for this breakdown scenario is therefore set at the 1.16800 support level, which is also the upper boundary of the current demand zone. Manage your risk!

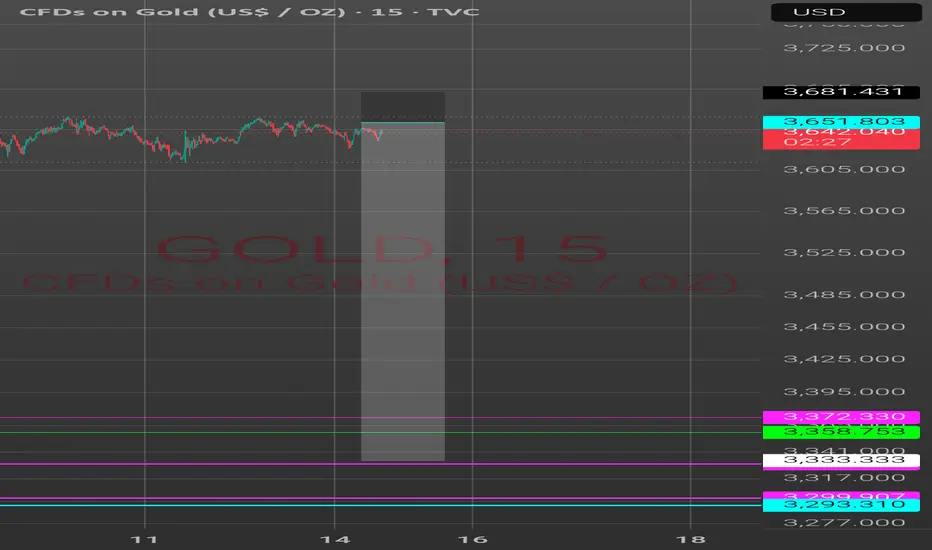
Xau Short1:10 RR setup.
For TP will have alerts near price in case some event be happening in the world which would cause volatility and may push the price down to 3000
Seems like Gold wants to do liqiudity grab and then treap bulls
SILVER Will Fall! Sell!
Here is our detailed technical review for SILVER.
Time Frame: 3h
Current Trend: Bearish
Sentiment: Overbought (based on 7-period RSI)
Forecast: Bearish
The market is testing a major horizontal structure 4,221.1.
Taking into consideration the structure & trend analysis, I believe that the market will reach 4,164.2 level soon.
P.S
We determine oversold/overbought condition with RSI indicator.
When it drops below 30 - the market is considered to be oversold.
When it bounces above 70 - the market is considered to be overbought.
Like and subscribe and comment my ideas if you enjoy them!

USD/JPY - Forecast 🕰 Weekly View
Price is ranging under 148–150 weekly resistance while holding above the 142–144 weekly demand zone. If demand continues to hold, we could see a push back toward the 156–158 target. A clean break below 142 would invalidate this outlook.
📉 Daily Structure
Major Resistance: 148–150 supply block
Major Support: 142–144 demand zone
Price is coiling between mid-range weak support and overhead resistance, building liquidity for the next move.
⏱ 8H Breakdown
On the 8H, price is capped under the descending trendline. Refined demand sits around 144–145. A sweep into this level could fuel the next bullish continuation. Breakout above 150 opens the road directly into 156–158.
🔎 Outlook
Short-term pullback still possible → but overall structure favors a mid-term bullish continuation targeting 156–158.
Bias: Short-term pullback → mid-term bullish.

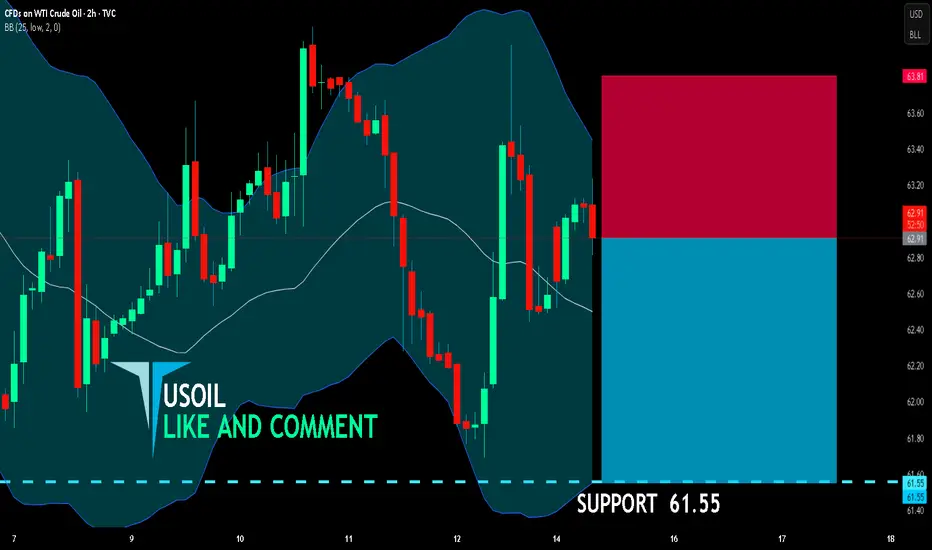
USOIL BEARISH BIAS RIGHT NOW| SHORT
USOIL SIGNAL
Trade Direction: short
Entry Level: 62.91
Target Level: 61.55
Stop Loss: 63.81
RISK PROFILE
Risk level: medium
Suggested risk: 1%
Timeframe: 2h
Disclosure: I am part of Trade Nation's Influencer program and receive a monthly fee for using their TradingView charts in my analysis.
✅LIKE AND COMMENT MY IDEAS✅
EUR/JPY BEST PLACE TO SELL FROM|SHORT
EUR/JPY SIGNAL
Trade Direction: short
Entry Level: 172.979
Target Level: 171.265
Stop Loss: 174.125
RISK PROFILE
Risk level: medium
Suggested risk: 1%
Timeframe: 12h
Disclosure: I am part of Trade Nation's Influencer program and receive a monthly fee for using their TradingView charts in my analysis.
✅LIKE AND COMMENT MY IDEAS✅

USD/CAD SHORT FROM RESISTANCE
Hello, Friends!
Previous week’s green candle means that for us the USD/CAD pair is in the uptrend. And the current movement leg was also up but the resistance line will be hit soon and upper BB band proximity will signal an overbought condition so we will go for a counter-trend short trade with the target being at 1.371.
Disclosure: I am part of Trade Nation's Influencer program and receive a monthly fee for using their TradingView charts in my analysis.
✅LIKE AND COMMENT MY IDEAS✅
