NZDCHF SENDS CLEAR BEARISH SIGNALS|SHORT
Hello, Friends!
It makes sense for us to go short on NZD/CHF right now from the resistance line above with the target of 0.471 because of the confluence of the two strong factors which are the general downtrend on the previous 1W candle and the overbought situation on the lower TF determined by it’s proximity to the upper BB band.
Disclosure: I am part of Trade Nation's Influencer program and receive a monthly fee for using their TradingView charts in my analysis.
✅LIKE AND COMMENT MY IDEAS✅
Short

AUD/NZD BEARS ARE GAINING STRENGTH|SHORT
Hello, Friends!
Previous week’s green candle means that for us the AUD/NZD pair is in the uptrend. And the current movement leg was also up but the resistance line will be hit soon and upper BB band proximity will signal an overbought condition so we will go for a counter-trend short trade with the target being at 1.111.
Disclosure: I am part of Trade Nation's Influencer program and receive a monthly fee for using their TradingView charts in my analysis.
✅LIKE AND COMMENT MY IDEAS✅

EURUSD Is Bearish! Sell!
Please, check our technical outlook for EURUSD.
Time Frame: 7h
Current Trend: Bearish
Sentiment: Overbought (based on 7-period RSI)
Forecast: Bearish
The market is approaching a significant resistance area 1.169.
Due to the fact that we see a positive bearish reaction from the underlined area, I strongly believe that sellers will manage to push the price all the way down to 1.163 level.
P.S
Please, note that an oversold/overbought condition can last for a long time, and therefore being oversold/overbought doesn't mean a price rally will come soon, or at all.
Disclosure: I am part of Trade Nation's Influencer program and receive a monthly fee for using their TradingView charts in my analysis.
Like and subscribe and comment my ideas if you enjoy them!

AUDNZD Is Going Down! Short!
Take a look at our analysis for AUDNZD.
Time Frame: 6h
Current Trend: Bearish
Sentiment: Overbought (based on 7-period RSI)
Forecast: Bearish
The price is testing a key resistance 1.113.
Taking into consideration the current market trend & overbought RSI, chances will be high to see a bearish movement to the downside at least to 1.108 level.
P.S
We determine oversold/overbought condition with RSI indicator.
When it drops below 30 - the market is considered to be oversold.
When it bounces above 70 - the market is considered to be overbought.
Disclosure: I am part of Trade Nation's Influencer program and receive a monthly fee for using their TradingView charts in my analysis.
Like and subscribe and comment my ideas if you enjoy them!

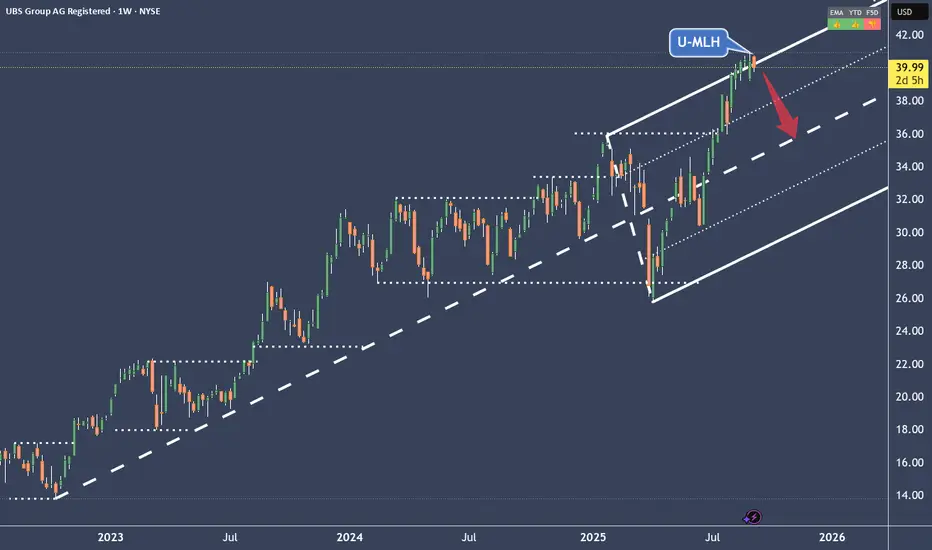
UBS Swiss Bank ran too hot for my likingBut I like it!
It's a fair short opportunity IMO.
Also, the setup is playing out very nice.
It opened & closed back into the Fork on the daily.
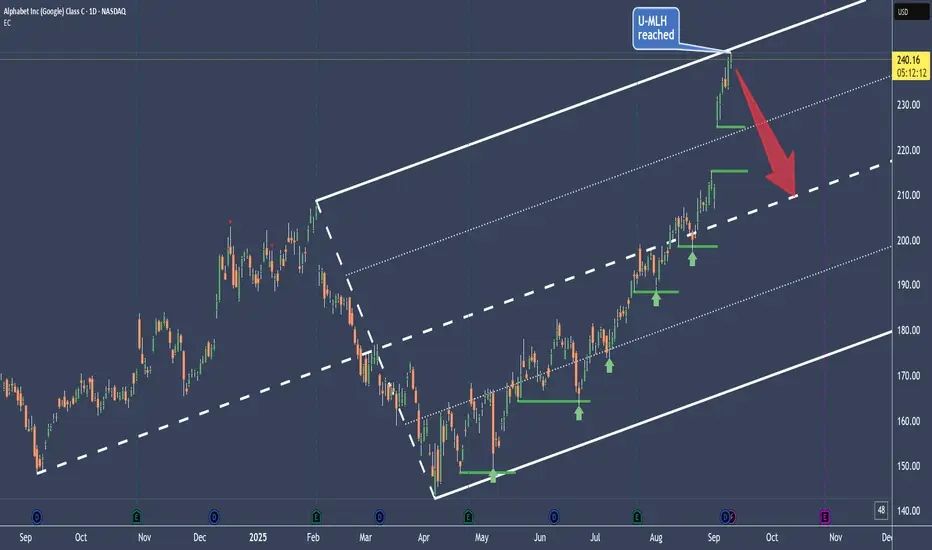
I approach it the same way like the Google short, with ITM Options (see link).
Target is the Centerline with an 80% chance of success.
Google has reached it's stretch level👉 The rubber band is stretched 📉💥🐍
👉 Euphoria is at it's top 🚀💸🌕
👉 Greed eats brain 💰🤑👐
So, why not taking a casual short?
Let's say, with some ITM Put Options, just to define the risk?
Because if I short the UL, there's still a chance that greed and euphoria goes nuts and gaps way above the U-MLH.
So, let's give it time to mature, like a good old Whiskey §8-)
Cheers 🥃
EURUSD Short: Price Reverse and Start FallHello, traders! The price auction for EURUSD has been operating within a well-defined ascending channel for several weeks. This bullish structure has been confirmed by multiple pivot points, with buyers defending the ascending demand line and sellers consistently emerging at the upper supply zone near the 1.1715 level. This has established a clear rotational pattern between the channel's boundaries.
Currently, the auction is at a critical inflection point, once again testing the upper boundary of this channel. The price has rallied to meet the ascending supply line, which forms a strong confluence of resistance with the horizontal 1.1715 - 1.1740 supply area. This is the same zone where previous rallies have failed, making it a key battleground.
The primary scenario anticipates a rejection from this resistance confluence, continuing the established pattern of rotation. The expectation is that sellers will defend the supply zone and initiate a new downward move back towards the channel's support. A failure to break out higher would confirm a short-term correction is underway. The take-profit for this rotational play is therefore set at 1.1605 points, targeting the ascending demand line of the channel. Manage your risk!

BTCUSD: Fake Breakout and Drop to Support LineHello everyone, here is my breakdown of the current Bitcoin setup.
Market Analysis
From a broader perspective, the price of Bitcoin has transitioned from a downward channel into a large rising wedge pattern. This structure has defined the price action for several weeks, creating a volatile environment with clear boundaries at the support zone near the 109000 level and the resistance zone up to the 113000 area.
Currently, we are at a very interesting and critical point. The price has once again rallied to the top of the Wedge and is testing the major horizontal resistance at the 112500 level. This is the third significant test of this ceiling in recent history.
My Scenario & Strategy
My scenario is built on a repeating pattern of behavior I've observed at this resistance. On the two previous tests of this 112500 area, the price created a 'fake breakout', briefly pushing above the level only to be aggressively sold off. This repeated failure is a strong clue that sellers are dominant here.
My expectation is that history will repeat itself. I'm looking for the price to make one more 'fake breakout' push into the 112500 - 113000 resistance zone. A swift reversal and a fall back below the 112500 level would be the key signal that sellers have once again taken control. The primary target for this move is 110700, which aligns with the ascending wedge support line.
That's the setup I'm tracking. Thank you for your attention, and always manage your risk.

Gold may move up a little and then start to declineHello traders, I want share with you my opinion about Gold. The market for Gold has transitioned from a prolonged balancing phase into a strong directional trend, following a decisive breakout from its prior multi-week big range. This breakout, originating from the support area near the 3445 level, shifted market control firmly to buyers and initiated a new impulsive phase. The price action for XAU since then has been characterized by a steep, high-momentum rally, which is being guided by an ascending mirror line. Currently, the asset is at a new high, continuing to push upwards along this aggressive trendline. However, such accelerated trends are often unsustainable and can signal that the market is becoming overextended and due for a correction. I expect that after a potential final push higher, the price will stage a sharp reversal, with enough selling pressure to cause a breakdown below the steep mirror line. A break of this dynamic support would be the first confirmation that a corrective phase has begun. Therefore, the TP for this corrective scenario is logically placed at 3520 points. Please share this idea with your friends and click Boost 🚀

NZDCAD: Trading Signal From Our Team
NZDCAD
- Classic bearish pattern
- Our team expects retracement
SUGGESTED TRADE:
Swing Trade
Sell NZDCAD
Entry - 0.8230
Stop - 0.8238
Take - 0.8216
Our Risk - 1%
Start protection of your profits from lower levels
Disclosure: I am part of Trade Nation's Influencer program and receive a monthly fee for using their TradingView charts in my analysis.
❤️ Please, support our work with like & comment! ❤️

AUDCHF: Bearish Forecast & Bearish Scenario
Remember that we can not, and should not impose our will on the market but rather listen to its whims and make profit by following it. And thus shall be done today on the AUDCHF pair which is likely to be pushed down by the bears so we will sell!
Disclosure: I am part of Trade Nation's Influencer program and receive a monthly fee for using their TradingView charts in my analysis.
❤️ Please, support our work with like & comment! ❤️

GOLD: Bearish Continuation & Short Trade
GOLD
- Classic bearish setup
- Our team expects bearish continuation
SUGGESTED TRADE:
Swing Trade
Short GOLD
Entry Point - 3644.0
Stop Loss - 3652.1
Take Profit - 3630.1
Our Risk - 1%
Start protection of your profits from lower levels
Disclosure: I am part of Trade Nation's Influencer program and receive a monthly fee for using their TradingView charts in my analysis.
❤️ Please, support our work with like & comment! ❤️

GBPJPY What Next? SELL!
My dear subscribers,
This is my opinion on the GBPJPY next move:
The instrument tests an important psychological level 199.56
Bias - Bearish
Technical Indicators: Supper Trend gives a precise Bearish signal, while Pivot Point HL predicts price changes and potential reversals in the market.
Target - 199.28
My Stop Loss - 199.71
About Used Indicators:
On the subsequent day, trading above the pivot point is thought to indicate ongoing bullish sentiment, while trading below the pivot point indicates bearish sentiment.
Disclosure: I am part of Trade Nation's Influencer program and receive a monthly fee for using their TradingView charts in my analysis.
———————————
WISH YOU ALL LUCK

USD/JPY - Targets for next move Hi Traders, what are everyone's thoughts on USD/JPY?
This is my view.. I see price in HTF making Bullish movements reacting of Demand zones. What we have now is a very clear ranging market after price came off the Supply zone. BSL was swept and now we are stuck between a very weak Support and Resistance.
So what I belive will happen next will be due to HTF bullish Demand, I see SSL liquidity that has to be swept before buyers step in to drive the price back up again. Im seeing much stronger rejections from sellers than I am from buyers currently telling me Sellers have more control.
I do have short positions currently active but I will continue to add more positions on this pullback. The highlighted yellow area within the IMB will be my targets.
Good luck traders and please follow and comment if this was helpful

#022: AUD/CHF SHORT Investment Opportunity
The AUD/CHF is consolidating in a tight range after recent attempts to rally. The pair remains stuck below the 0.5265-0.5270 zone, which has acted as a liquidity-seeking area in recent sessions. Hello, I'm Andrea Russo, an independent Forex trader and prop trader with $200,000 in capital under management. Thank you in advance for your time.
Key Observations
The low volumes seen during the latest rally suggest the move is more related to stop-loss hunting than actual accumulation.
A confirmed break below 0.5235 on high volume could trigger accelerated downside momentum.
Broader fundamentals still favor the CHF in times of uncertainty, while the AUD struggles in risk-off conditions.
This setup aims to capture a move back towards the 0.5200 area, aligning with the upper technical resistance and a potential bearish continuation.

USDJPY Will Go Lower From Resistance! Sell!
Here is our detailed technical review for USDJPY.
Time Frame: 1D
Current Trend: Bearish
Sentiment: Overbought (based on 7-period RSI)
Forecast: Bearish
The market is testing a major horizontal structure 147.406.
Taking into consideration the structure & trend analysis, I believe that the market will reach 144.300 level soon.
P.S
Please, note that an oversold/overbought condition can last for a long time, and therefore being oversold/overbought doesn't mean a price rally will come soon, or at all.
Disclosure: I am part of Trade Nation's Influencer program and receive a monthly fee for using their TradingView charts in my analysis.
Like and subscribe and comment my ideas if you enjoy them!

AUDUSD Will Go Down From Resistance! Short!
Take a look at our analysis for AUDUSD.
Time Frame: 1h
Current Trend: Bearish
Sentiment: Overbought (based on 7-period RSI)
Forecast: Bearish
The market is approaching a key horizontal level 0.660.
Considering the today's price action, probabilities will be high to see a movement to 0.658.
P.S
The term oversold refers to a condition where an asset has traded lower in price and has the potential for a price bounce.
Overbought refers to market scenarios where the instrument is traded considerably higher than its fair value. Overvaluation is caused by market sentiments when there is positive news.
Disclosure: I am part of Trade Nation's Influencer program and receive a monthly fee for using their TradingView charts in my analysis.
Like and subscribe and comment my ideas if you enjoy them!

USOIL SELLERS WILL DOMINATE THE MARKET|SHORT
USOIL SIGNAL
Trade Direction: short
Entry Level: 63.28
Target Level: 61.46
Stop Loss: 64.49
RISK PROFILE
Risk level: medium
Suggested risk: 1%
Timeframe: 3h
Disclosure: I am part of Trade Nation's Influencer program and receive a monthly fee for using their TradingView charts in my analysis.
✅LIKE AND COMMENT MY IDEAS✅

NZD/CAD BEST PLACE TO SELL FROM|SHORT
Hello, Friends!
NZD-CAD uptrend evident from the last 1W green candle makes short trades more risky, but the current set-up targeting 0.812 area still presents a good opportunity for us to sell the pair because the resistance line is nearby and the BB upper band is close which indicates the overbought state of the NZD/CAD pair.
Disclosure: I am part of Trade Nation's Influencer program and receive a monthly fee for using their TradingView charts in my analysis.
✅LIKE AND COMMENT MY IDEAS✅

AUD/CAD BEARS ARE STRONG HERE|SHORT
Hello, Friends!
AUD/CAD pair is in the uptrend because previous week’s candle is green, while the price is clearly rising on the 6H timeframe. And after the retest of the resistance line above I believe we will see a move down towards the target below at 0.903 because the pair overbought due to its proximity to the upper BB band and a bearish correction is likely.
Disclosure: I am part of Trade Nation's Influencer program and receive a monthly fee for using their TradingView charts in my analysis.
✅LIKE AND COMMENT MY IDEAS✅

GBPCHF: Short Signal with Entry/SL/TP
GBPCHF
- Classic bearish formation
- Our team expects fall
SUGGESTED TRADE:
Swing Trade
Sell GBPCHF
Entry Level - 1.0788
Sl - 1.0796
Tp - 1.0774
Our Risk - 1%
Start protection of your profits from lower levels
Disclosure: I am part of Trade Nation's Influencer program and receive a monthly fee for using their TradingView charts in my analysis.
❤️ Please, support our work with like & comment! ❤️

NZDUSD My Opinion! SELL!
My dear friends,
Please, find my technical outlook for NZDUSD below:
The instrument tests an important psychological level 0.5930
Bias - Bearish
Technical Indicators: Supper Trend gives a precise Bearish signal, while Pivot Point HL predicts price changes and potential reversals in the market.
Target - 0.5903
About Used Indicators:
Super-trend indicator is more useful in trending markets where there are clear uptrends and downtrends in price.
Disclosure: I am part of Trade Nation's Influencer program and receive a monthly fee for using their TradingView charts in my analysis.
———————————
WISH YOU ALL LUCK

AUDNZD Set To Fall! SELL!
My dear friends,
Please, find my technical outlook for AUDNZD below:
The price is coiling around a solid key level - 1.1113
Bias - Bearish
Technical Indicators: Pivot Points Low anticipates a potential price reversal.
Super trend shows a clear sell, giving a perfect indicators' convergence.
Goal - 1.1104
Safe Stop Loss - 1.1118
About Used Indicators:
The pivot point itself is simply the average of the high, low and closing prices from the previous trading day.
Disclosure: I am part of Trade Nation's Influencer program and receive a monthly fee for using their TradingView charts in my analysis.
———————————
WISH YOU ALL LUCK
