GOLD Will Go Lower From Resistance! Sell!
Please, check our technical outlook for GOLD.
Time Frame: 12h
Current Trend: Bearish
Sentiment: Overbought (based on 7-period RSI)
Forecast: Bearish
The market is approaching a significant resistance area 3,367.70.
Due to the fact that we see a positive bearish reaction from the underlined area, I strongly believe that sellers will manage to push the price all the way down to 3,322.77 level.
P.S
The term oversold refers to a condition where an asset has traded lower in price and has the potential for a price bounce.
Overbought refers to market scenarios where the instrument is traded considerably higher than its fair value. Overvaluation is caused by market sentiments when there is positive news.
Disclosure: I am part of Trade Nation's Influencer program and receive a monthly fee for using their TradingView charts in my analysis.
Like and subscribe and comment my ideas if you enjoy them!
Short

XAUUSD Short: Sellers to Maintain Control at 3380 SupplyHello, traders! The macro structure for the XAU price auction has been defined by two critical pivot points, establishing a wide and volatile consolidation range. A major pivot point high was formed at the 3390 supply zone, while a subsequent pivot point low anchored the market at the 3300 demand zone. All price action since has occurred between these two dominant control zones, transitioning the market into a state of balance.
Currently, the price action is contracting within a large symmetrical triangle, signaling a compression of volatility. The auction is now at a critical inflection point, as it is directly testing the upper boundary of this formation. This area represents a powerful confluence of resistance, where the descending supply line and the horizontal 3380 - 3390 supply zone intersect, providing a key battleground for market participants.
The working hypothesis is a short scenario, predicated on sellers successfully defending this resistance confluence. It is anticipated that the price will make a final push into the supply zone before being rejected. A confirmed failure to break higher would validate the triangle's integrity and initiate a full rotation to the downside. The take-profit is therefore set at 3330, targeting the high-liquidity area where the ascending demand line converges with the horizontal demand zone. Manage your risk!

BTCUSD: Short Trade with Entry/SL/TP
BTCUSD
- Classic bearish pattern
- Our team expects retracement
SUGGESTED TRADE:
Swing Trade
Sell BTCUSD
Entry - 11665
Stop - 11763
Take - 11484
Our Risk - 1%
Start protection of your profits from lower levels
Disclosure: I am part of Trade Nation's Influencer program and receive a monthly fee for using their TradingView charts in my analysis.
❤️ Please, support our work with like & comment! ❤️

EURUSD: Market of Sellers
The price of EURUSD will most likely collapse soon enough, due to the supply beginning to exceed demand which we can see by looking at the chart of the pair.
Disclosure: I am part of Trade Nation's Influencer program and receive a monthly fee for using their TradingView charts in my analysis.
❤️ Please, support our work with like & comment! ❤️

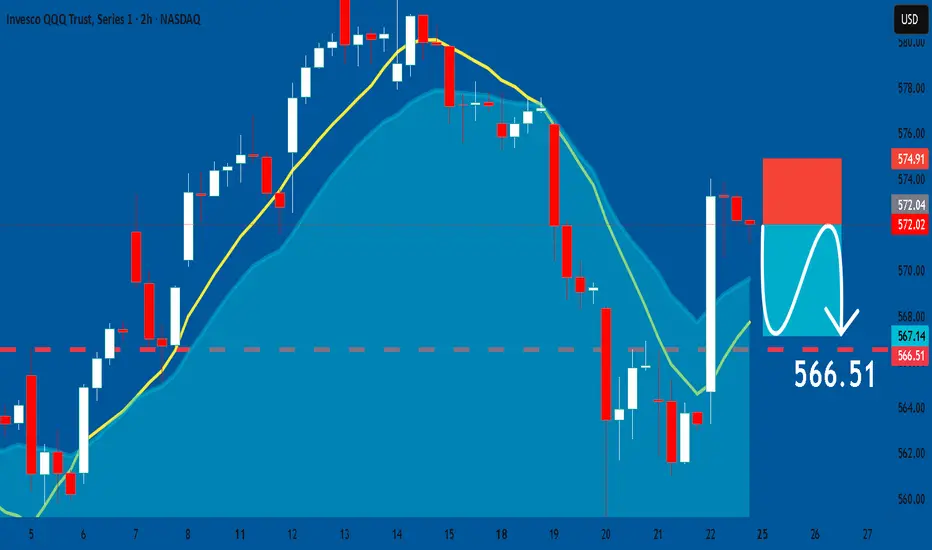
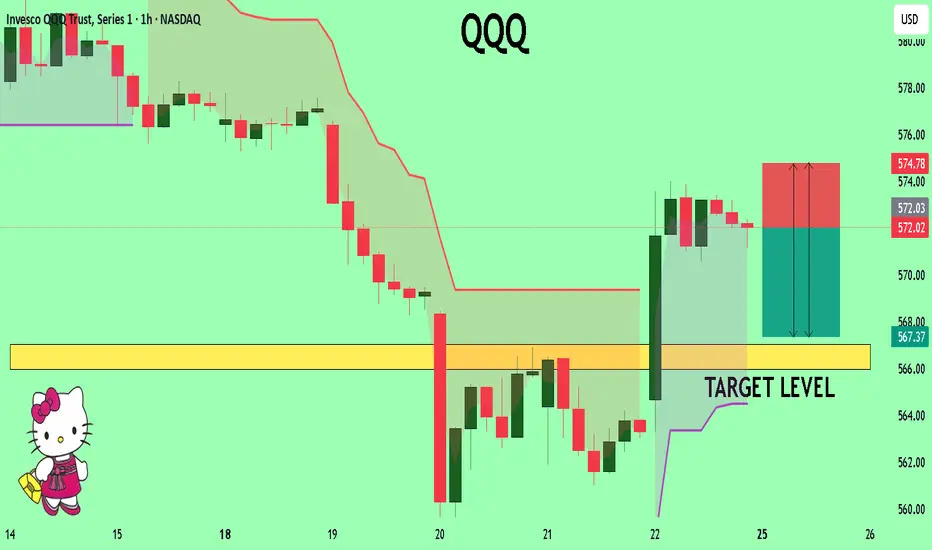
QQQ: Bearish Continuation & Short Signal
QQQ
- Classic bearish setup
- Our team expects bearish continuation
SUGGESTED TRADE:
Swing Trade
Short QQQ
Entry Point - 572.02
Stop Loss - 574.91
Take Profit - 566.51
Our Risk - 1%
Start protection of your profits from lower levels
Disclosure: I am part of Trade Nation's Influencer program and receive a monthly fee for using their TradingView charts in my analysis.
❤️ Please, support our work with like & comment! ❤️
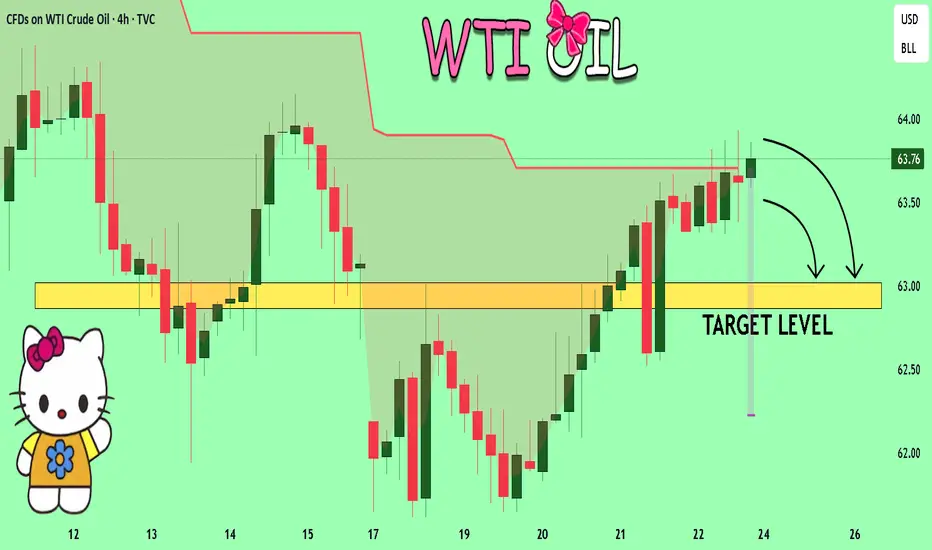
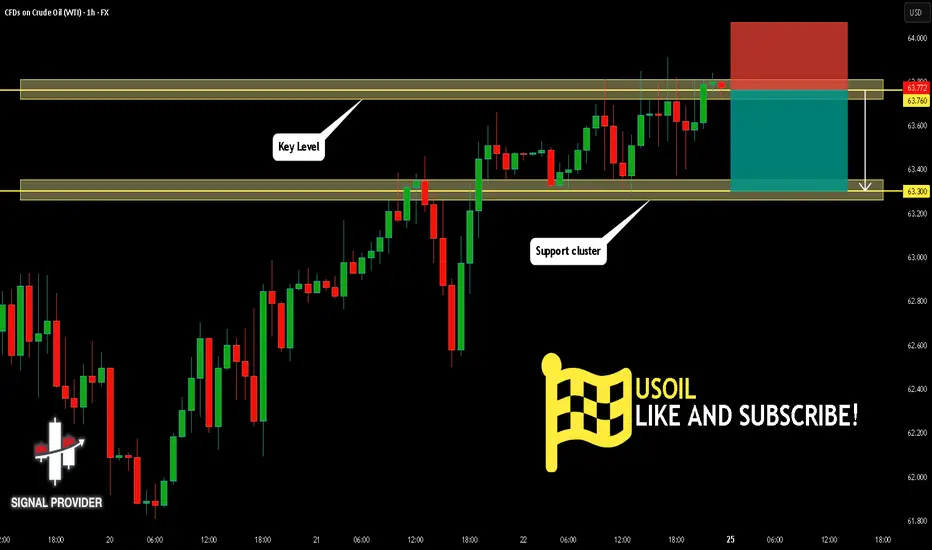
USOIL SENDS CLEAR BEARISH SIGNALS|SHORT
USOIL SIGNAL
Trade Direction: short
Entry Level: 63.73
Target Level: 61.24
Stop Loss: 65.36
RISK PROFILE
Risk level: medium
Suggested risk: 1%
Timeframe: 8h
Disclosure: I am part of Trade Nation's Influencer program and receive a monthly fee for using their TradingView charts in my analysis.
✅LIKE AND COMMENT MY IDEAS✅

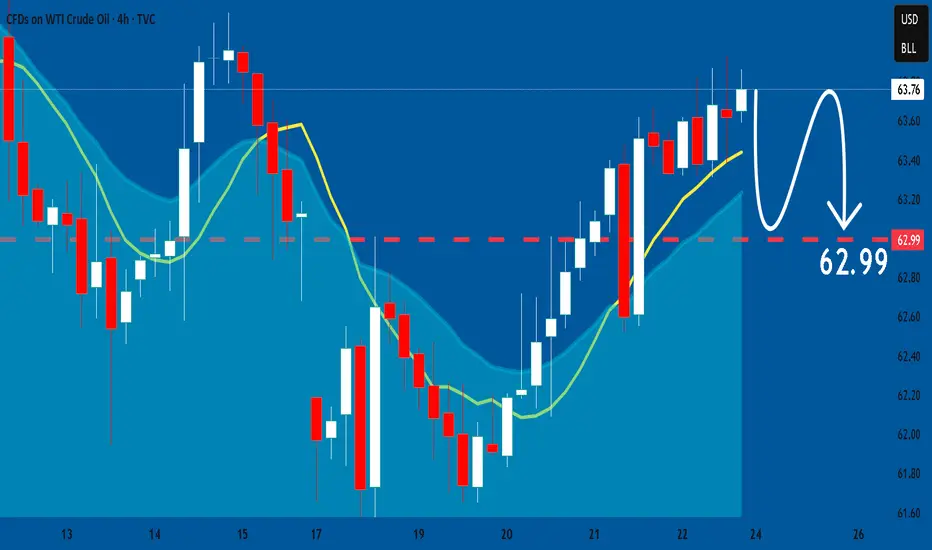
USOIL Set To Fall! SELL!
My dear subscribers,
This is my opinion on the USOIL next move:
The instrument tests an important psychological level 63.76
Bias - Bearish
Technical Indicators: Supper Trend gives a precise Bearish signal, while Pivot Point HL predicts price changes and potential reversals in the market.
Target - 63.02
About Used Indicators:
On the subsequent day, trading above the pivot point is thought to indicate ongoing bullish sentiment, while trading below the pivot point indicates bearish sentiment.
Disclosure: I am part of Trade Nation's Influencer program and receive a monthly fee for using their TradingView charts in my analysis.
———————————
WISH YOU ALL LUCK
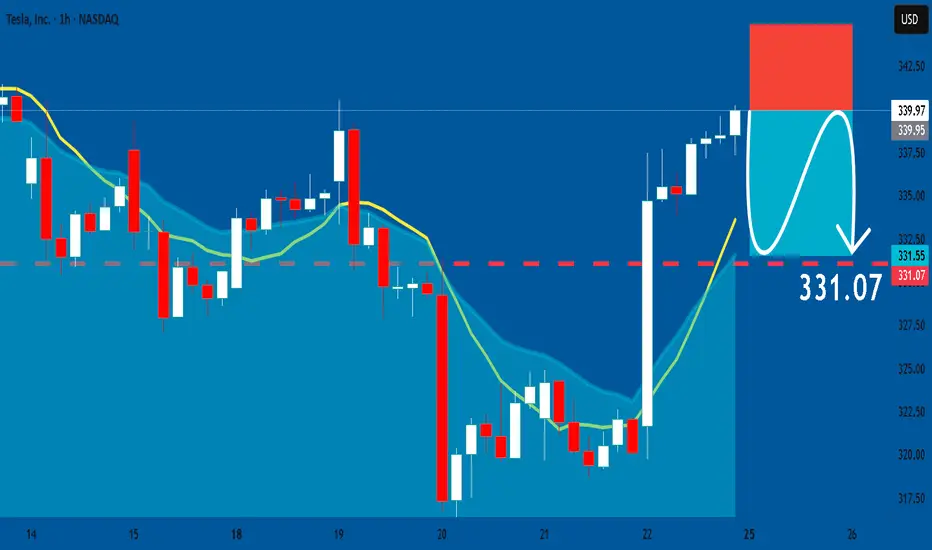
TESLA Will Collapse! SELL!
My dear friends,
Please, find my technical outlook for TESLA below:
The instrument tests an important psychological level 339.97
Bias - Bearish
Technical Indicators: Supper Trend gives a precise Bearish signal, while Pivot Point HL predicts price changes and potential reversals in the market.
Target - 332.22
Recommended Stop Loss - 344.40
About Used Indicators:
Super-trend indicator is more useful in trending markets where there are clear uptrends and downtrends in price.
Disclosure: I am part of Trade Nation's Influencer program and receive a monthly fee for using their TradingView charts in my analysis.
———————————
WISH YOU ALL LUCK
BTC Long (short term high risk)Hi,
I just entered a BTC long, expecting a further upwards move after the indication and pullback.
Hopefully it will short term go to around 119k, but can be a further continuation of the bull trend longterm. But thinking short term in this one, I set a stop loss just below this weekend's pullback low.
Lucky trading!
David.

AUD/NZD BEARISH BIAS RIGHT NOW| SHORT
Hello, Friends!
The BB upper band is nearby so AUD-NZD is in the overbought territory. Thus, despite the uptrend on the 1W timeframe I think that we will see a bearish reaction from the resistance line above and a move down towards the target at around 1.099.
Disclosure: I am part of Trade Nation's Influencer program and receive a monthly fee for using their TradingView charts in my analysis.
✅LIKE AND COMMENT MY IDEAS✅

USDCHF Under Pressure! SELL!
My dear followers,
This is my opinion on the USDCHF next move:
The asset is approaching an important pivot point 0.8094
Bias - Bearish
Technical Indicators: Supper Trend generates a clear short signal while Pivot Point HL is currently determining the overall Bearish trend of the market.
Goal - 0.8070
About Used Indicators:
For more efficient signals, super-trend is used in combination with other indicators like Pivot Points.
Disclosure: I am part of Trade Nation's Influencer program and receive a monthly fee for using their TradingView charts in my analysis.
———————————
WISH YOU ALL LUCK

EURJPY Trading Opportunity! SELL!
My dear subscribers,
EURJPY looks like it will make a good move, and here are the details:
The market is trading on 172.60 pivot level.
Bias - Bearish
Technical Indicators: Both Super Trend & Pivot HL indicate a highly probable Bearish continuation.
Target - 172.07
About Used Indicators:
The average true range (ATR) plays an important role in 'Supertrend' as the indicator uses ATR to calculate its value. The ATR indicator signals the degree of price volatility.
Disclosure: I am part of Trade Nation's Influencer program and receive a monthly fee for using their TradingView charts in my analysis.
———————————
WISH YOU ALL LUCK

SILVER: Weak Market & Bearish Continuation
Our strategy, polished by years of trial and error has helped us identify what seems to be a great trading opportunity and we are here to share it with you as the time is ripe for us to sell SILVER.
Disclosure: I am part of Trade Nation's Influencer program and receive a monthly fee for using their TradingView charts in my analysis.
❤️ Please, support our work with like & comment! ❤️

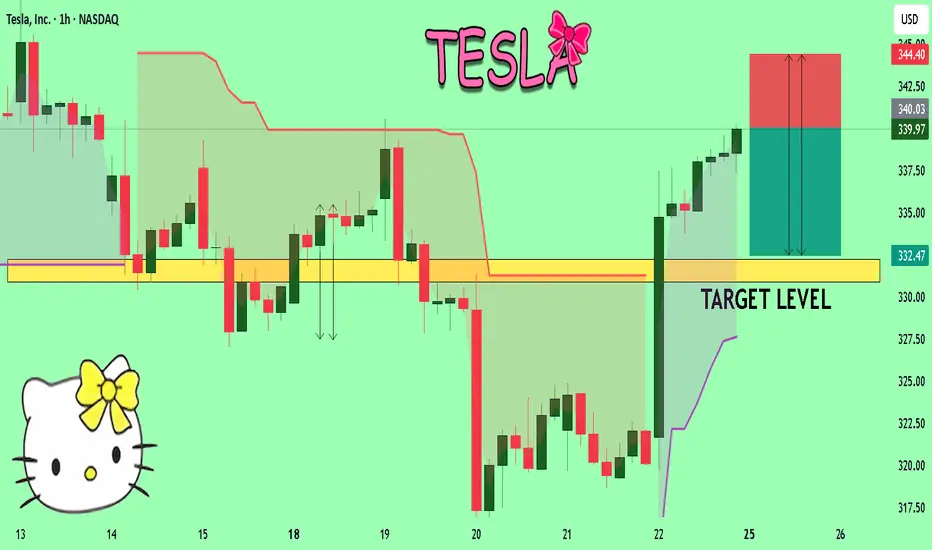
TESLA: Short Trading Opportunity
TESLA
- Classic bearish formation
- Our team expects fall
SUGGESTED TRADE:
Swing Trade
Sell TESLA
Entry Level - 339.97
Sl - 344.91
Tp - 331.07
Our Risk - 1%
Start protection of your profits from lower levels
Disclosure: I am part of Trade Nation's Influencer program and receive a monthly fee for using their TradingView charts in my analysis.
❤️ Please, support our work with like & comment! ❤️
QQQ The Target Is DOWN! SELL!
My dear subscribers,
My technical analysis for QQQ is below:
The price is coiling around a solid key level - 572.02
Bias - Bearish
Technical Indicators: Pivot Points Low anticipates a potential price reversal.
Super trend shows a clear sell, giving a perfect indicators' convergence.
Goal - 567.03
My Stop Loss - 574.78
About Used Indicators:
By the very nature of the supertrend indicator, it offers firm support and resistance levels for traders to enter and exit trades. Additionally, it also provides signals for setting stop losses
Disclosure: I am part of Trade Nation's Influencer program and receive a monthly fee for using their TradingView charts in my analysis.
———————————
WISH YOU ALL LUCK
USOIL: Swing Trading & Technical Analysis
The recent price action on the USOIL pair was keeping me on the fence, however, my bias is slowly but surely changing into the bearish one and I think we will see the price go down.
Disclosure: I am part of Trade Nation's Influencer program and receive a monthly fee for using their TradingView charts in my analysis.
❤️ Please, support our work with like & comment! ❤️
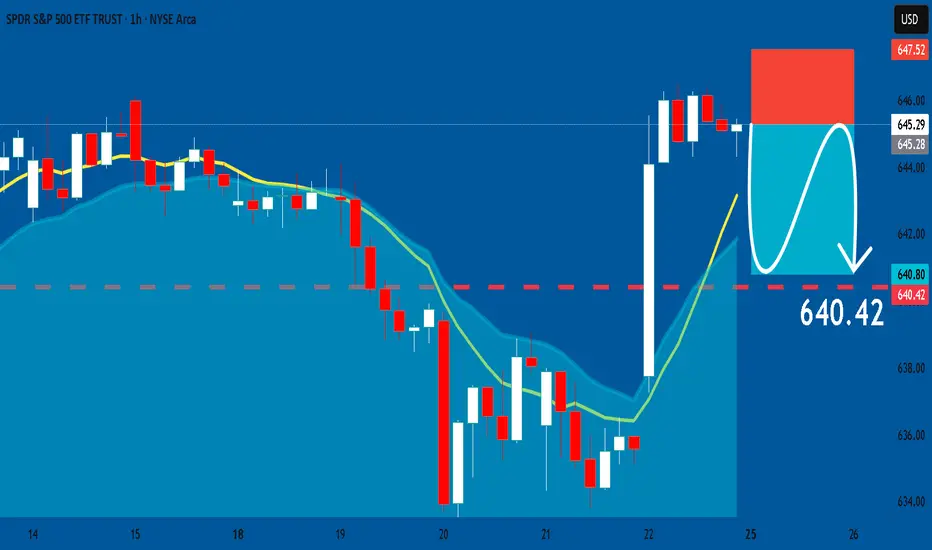
SPY: Short Trade Explained
SPY
- Classic bearish formation
- Our team expects pullback
SUGGESTED TRADE:
Swing Trade
Short SPY
Entry - 645.29
Sl - 647.52
Tp - 640.42
Our Risk - 1%
Start protection of your profits from lower levels
Disclosure: I am part of Trade Nation's Influencer program and receive a monthly fee for using their TradingView charts in my analysis.
❤️ Please, support our work with like & comment! ❤️
EURUSD Buyers In Panic! SELL!
My dear friends,
My technical analysis for EURUSD is below:
The market is trading on 1.1720 pivot level.
Bias - Bearish
Technical Indicators: Both Super Trend & Pivot HL indicate a highly probable Bearish continuation.
Target - 1.1674
About Used Indicators:
A pivot point is a technical analysis indicator, or calculations, used to determine the overall trend of the market over different time frames.
Disclosure: I am part of Trade Nation's Influencer program and receive a monthly fee for using their TradingView charts in my analysis.
———————————
WISH YOU ALL LUCK

BTCUSD Massive Short! SELL!
My dear followers,
I analysed this chart on BTCUSD and concluded the following:
The market is trading on 11665 pivot level.
Bias - Bearish
Technical Indicators: Both Super Trend & Pivot HL indicate a highly probable Bearish continuation.
Target - 11505
Safe Stop Loss - 11748
About Used Indicators:
A super-trend indicator is plotted on either above or below the closing price to signal a buy or sell. The indicator changes color, based on whether or not you should be buying. If the super-trend indicator moves below the closing price, the indicator turns green, and it signals an entry point or points to buy.
Disclosure: I am part of Trade Nation's Influencer program and receive a monthly fee for using their TradingView charts in my analysis.
———————————
WISH YOU ALL LUCK

USOIL Is Going Down! Sell!
Please, check our technical outlook for USOIL.
Time Frame: 1h
Current Trend: Bearish
Sentiment: Overbought (based on 7-period RSI)
Forecast: Bearish
The market is approaching a significant resistance area 63.760.
Due to the fact that we see a positive bearish reaction from the underlined area, I strongly believe that sellers will manage to push the price all the way down to 63.300 level.
P.S
Overbought describes a period of time where there has been a significant and consistent upward move in price over a period of time without much pullback.
Disclosure: I am part of Trade Nation's Influencer program and receive a monthly fee for using their TradingView charts in my analysis.
Like and subscribe and comment my ideas if you enjoy them!
AUDCAD Will Fall! Short!
Take a look at our analysis for AUDCAD.
Time Frame: 1D
Current Trend: Bearish
Sentiment: Overbought (based on 7-period RSI)
Forecast: Bearish
The price is testing a key resistance 0.897.
Taking into consideration the current market trend & overbought RSI, chances will be high to see a bearish movement to the downside at least to 0.890 level.
P.S
The term oversold refers to a condition where an asset has traded lower in price and has the potential for a price bounce.
Overbought refers to market scenarios where the instrument is traded considerably higher than its fair value. Overvaluation is caused by market sentiments when there is positive news.
Disclosure: I am part of Trade Nation's Influencer program and receive a monthly fee for using their TradingView charts in my analysis.
Like and subscribe and comment my ideas if you enjoy them!

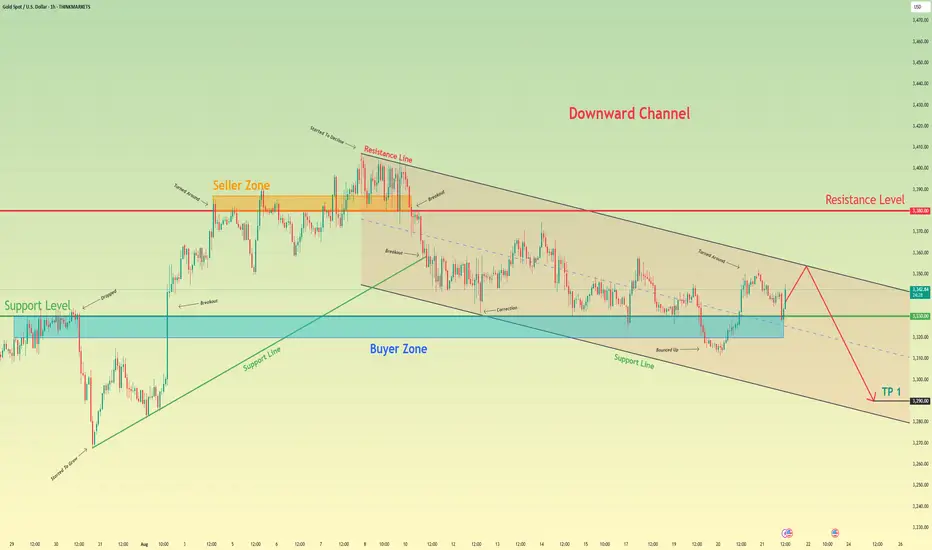
Gold can continue to decline inside downward channelHello traders, I want share with you my opinion about Gold. The price action for Gold has been dictated by a large downward channel since the last major peak was established at the 3380 resistance level. This bearish structure has effectively contained the market, guiding it through a series of impulsive declines and corrective rebounds between its well-defined support and resistance lines. After the most recent upward rebound originated from the lower boundary of the channel, the price has been in a corrective rally, now approaching a formidable confluence of resistance. This critical area is formed by the intersection of the channel's descending resistance line and the major horizontal seller zone around 3380. The primary working hypothesis is a short scenario, which is based on the expectation that this powerful resistance will hold and cause the current corrective rally to fail. A confirmed rejection from this zone would validate the integrity of the downward channel and signal that the dominant bearish trend is set to resume. This would likely trigger the next major impulsive fall, which is expected to break through the immediate support level at 3330. Therefore, the TP for this continuation scenario is logically placed at the 3290 level, a target that represents a new lower low within the channel's structure and a prudent objective for the anticipated move. Please share this idea with your friends and click Boost 🚀
Disclaimer: As part of ThinkMarkets’ Influencer Program, I am sponsored to share and publish their charts in my analysis.
CHFJPY: Weak Market & Bearish Forecast
The price of CHFJPY will most likely increase soon enough, due to the demand beginning to exceed supply which we can see by looking at the chart of the pair.
Disclosure: I am part of Trade Nation's Influencer program and receive a monthly fee for using their TradingView charts in my analysis.
❤️ Please, support our work with like & comment! ❤️
