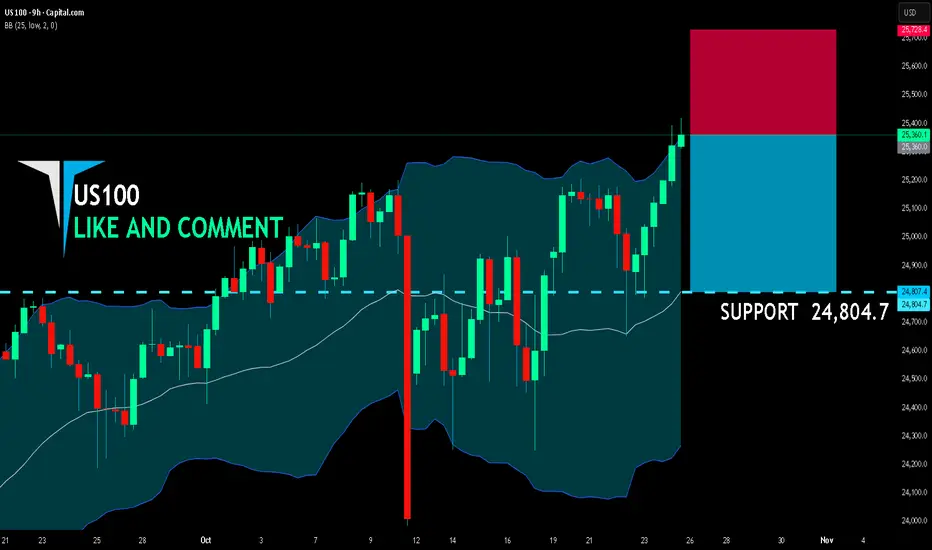
US100 SHORT FROM RESISTANCE
US100 SIGNAL
Trade Direction: short
Entry Level: 25,360.0
Target Level: 24,804.7
Stop Loss: 25,728.4
RISK PROFILE
Risk level: medium
Suggested risk: 1%
Timeframe: 9h
Disclosure: I am part of Trade Nation's Influencer program and receive a monthly fee for using their TradingView charts in my analysis.
✅LIKE AND COMMENT MY IDEAS✅
Short
EUR/JPY BEARS WILL DOMINATE THE MARKET|SHORT
Hello, Friends!
Previous week’s green candle means that for us the EUR/JPY pair is in the uptrend. And the current movement leg was also up but the resistance line will be hit soon and upper BB band proximity will signal an overbought condition so we will go for a counter-trend short trade with the target being at 176.680.
Disclosure: I am part of Trade Nation's Influencer program and receive a monthly fee for using their TradingView charts in my analysis.
✅LIKE AND COMMENT MY IDEAS✅

Bitcoin Forms Head and Shoulders — Correction 107,500 in PlayHello traders! I’d like to share my view on the current market structure for Bitcoin. After a prolonged period of bullish momentum and multiple impulsive rallies, the market has entered a corrective phase. The price action has formed a clear Head and Shoulders pattern beneath the major resistance zone near 121,700, signaling growing selling pressure. Currently, BTC is trading within a short-term descending structure, staying below both the resistance line and the Seller Zone. The recent rejection from the right shoulder area confirms that sellers remain in control, and the market is now moving toward the Buyer Zone, located around 107,500.In my opinion, this movement represents a continuation of the ongoing correction rather than a full trend reversal. I expect the price to decline into the Buyer Zone, completing the right shoulder and reaching the TP1 target near 107,500. If the market finds strong support in this demand area and forms a confirmed reversal structure, it could mark the end of the corrective phase and initiate the next major bullish leg. A successful bounce from this level would open the way for a potential rally back toward the 114,000–115,000 resistance range.This setup provides a clear trading plan — I remain bearish in the short term, looking for a potential bullish reversal from the lower boundary of the structure. Please share this idea with your friends and click Boost 🚀

Bitcoin short - midterm sell This midterm trend reversal could make price action trade lower, there is a trendline break downwards, sell positions, if channel breaks it give us more confirmation, the current POI level has been traded earlier it is in confluence with 61,8 fibonacci retracement, the 2 targets lower(green lines) are theoretical take profits areas.
Good luck and good trading, this is not financial advice this is solely my own analysis!
APPLE: Price Action & Swing Analysis
The recent price action on the APPLE pair was keeping me on the fence, however, my bias is slowly but surely changing into the bearish one and I think we will see the price go down.
Disclosure: I am part of Trade Nation's Influencer program and receive a monthly fee for using their TradingView charts in my analysis.
❤️ Please, support our work with like & comment! ❤️

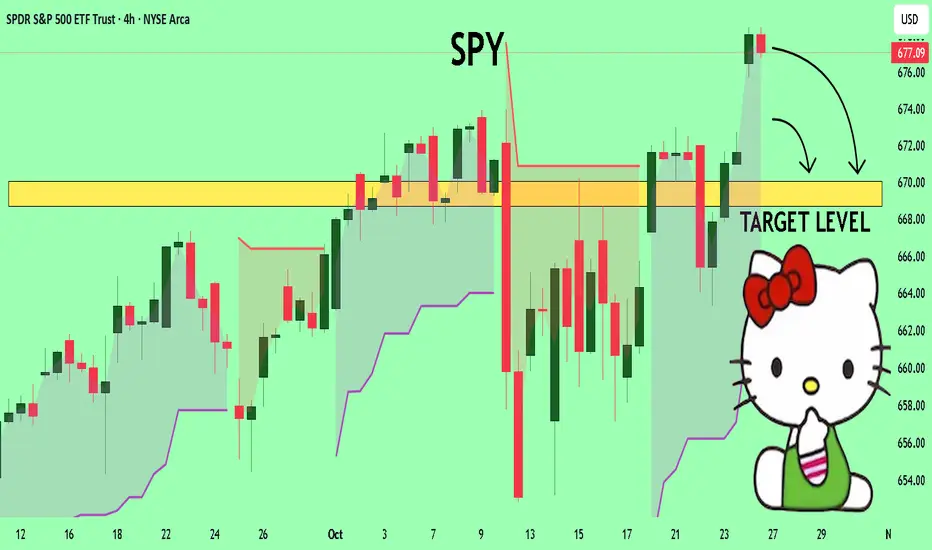
SPY The Target Is DOWN! SELL!
My dear friends,
SPY looks like it will make a good move, and here are the details:
The market is trading on 677.09 pivot level.
Bias - Bearish
Technical Indicators: Supper Trend generates a clear short signal while Pivot Point HL is currently determining the overall Bearish trend of the market.
Goal - 670.03
About Used Indicators:
Pivot points are a great way to identify areas of support and resistance, but they work best when combined with other kinds of technical analysis
Disclosure: I am part of Trade Nation's Influencer program and receive a monthly fee for using their TradingView charts in my analysis.
———————————
WISH YOU ALL LUCK
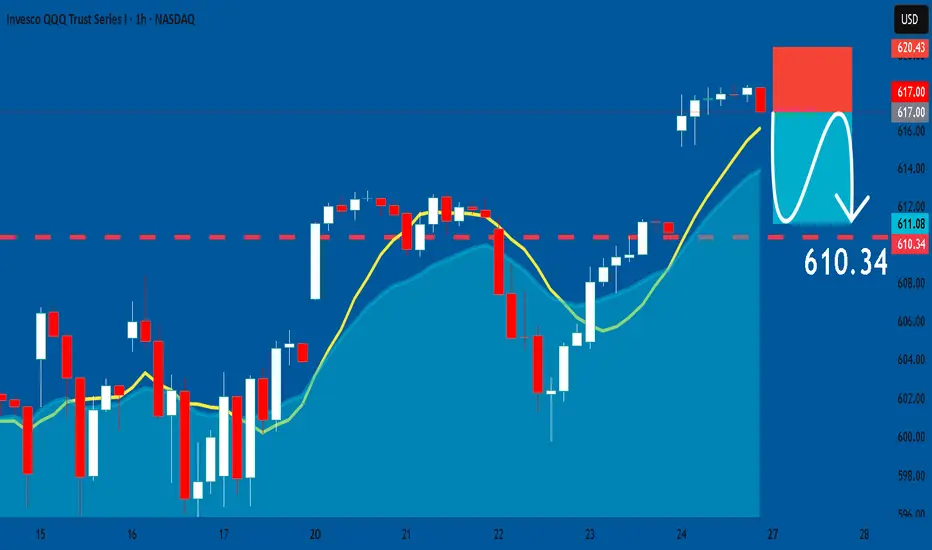
QQQ: Short Trading Opportunity
QQQ
- Classic bearish formation
- Our team expects fall
SUGGESTED TRADE:
Swing Trade
Sell QQQ
Entry Level - 617.00
Sl -620.43
Tp - 610.34
Our Risk - 1%
Start protection of your profits from lower levels
Disclosure: I am part of Trade Nation's Influencer program and receive a monthly fee for using their TradingView charts in my analysis.
❤️ Please, support our work with like & comment! ❤️
EURUSD: Weak Market & Bearish Continuation
It is essential that we apply multitimeframe technical analysis and there is no better example of why that is the case than the current EURUSD chart which, if analyzed properly, clearly points in the downward direction.
Disclosure: I am part of Trade Nation's Influencer program and receive a monthly fee for using their TradingView charts in my analysis.
❤️ Please, support our work with like & comment! ❤️

NATGAS: Short Trade Explained
NATGAS
- Classic bearish formation
- Our team expects pullback
SUGGESTED TRADE:
Swing Trade
Short NATGAS
Entry - 3.337
Sl - 3.372
Tp - 3.272
Our Risk - 1%
Start protection of your profits from lower levels
Disclosure: I am part of Trade Nation's Influencer program and receive a monthly fee for using their TradingView charts in my analysis.
❤️ Please, support our work with like & comment! ❤️

USOIL Buyers In Panic! SELL!
My dear subscribers,
This is my opinion on the USOIL next move:
The instrument tests an important psychological level 61.43
Bias - Bearish
Technical Indicators: Supper Trend gives a precise Bearish signal, while Pivot Point HL predicts price changes and potential reversals in the market.
Target - 59.88
About Used Indicators:
On the subsequent day, trading above the pivot point is thought to indicate ongoing bullish sentiment, while trading below the pivot point indicates bearish sentiment.
Disclosure: I am part of Trade Nation's Influencer program and receive a monthly fee for using their TradingView charts in my analysis.
———————————
WISH YOU ALL LUCK

US30 Massive Short! SELL!
My dear friends,
Please, find my technical outlook for US30 below:
The instrument tests an important psychological level 47206
Bias - Bearish
Technical Indicators: Supper Trend gives a precise Bearish signal, while Pivot Point HL predicts price changes and potential reversals in the market.
Target - 46982
Recommended Stop Loss - 47329
About Used Indicators:
Super-trend indicator is more useful in trending markets where there are clear uptrends and downtrends in price.
Disclosure: I am part of Trade Nation's Influencer program and receive a monthly fee for using their TradingView charts in my analysis.
———————————
WISH YOU ALL LUCK

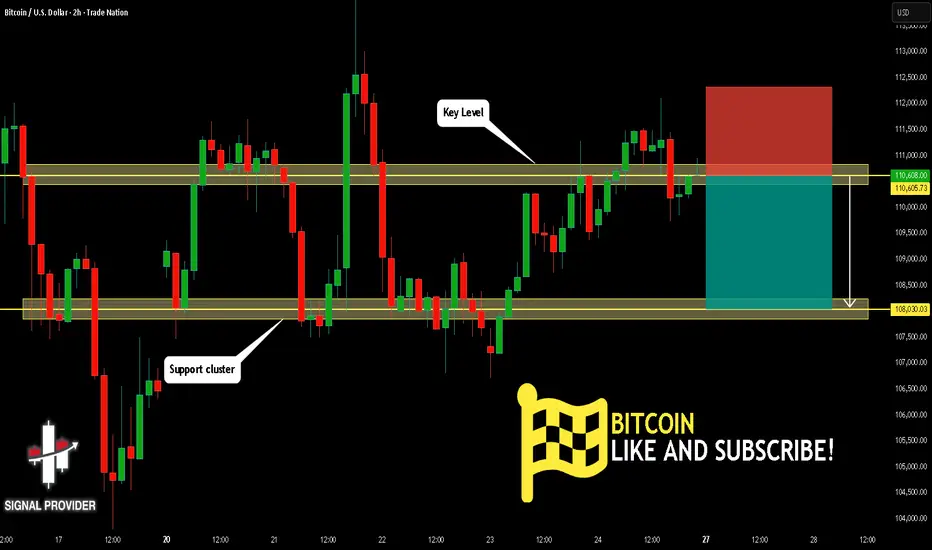
BITCOIN Will Go Lower! Sell!
Here is our detailed technical review for BITCOIN.
Time Frame: 2h
Current Trend: Bearish
Sentiment: Overbought (based on 7-period RSI)
Forecast: Bearish
The market is testing a major horizontal structure 110,605.73.
Taking into consideration the structure & trend analysis, I believe that the market will reach 108,030.03 level soon.
P.S
We determine oversold/overbought condition with RSI indicator.
When it drops below 30 - the market is considered to be oversold.
When it bounces above 70 - the market is considered to be overbought.
Like and subscribe and comment my ideas if you enjoy them!
USOIL SENDS CLEAR BEARISH SIGNALS|SHORT
USOIL SIGNAL
Trade Direction: short
Entry Level: 61.42
Target Level: 58.17
Stop Loss: 63.58
RISK PROFILE
Risk level: medium
Suggested risk: 1%
Timeframe: 6h
Disclosure: I am part of Trade Nation's Influencer program and receive a monthly fee for using their TradingView charts in my analysis.
✅LIKE AND COMMENT MY IDEAS✅

EUR/GBP BEARS ARE GAINING STRENGTH|SHORT
Hello, Friends!
EUR/GBP is trending down which is evident from the red colour of the previous weekly candle. However, the price has locally surged into the overbought territory. Which can be told from its proximity to the BB upper band. Which presents a great trend following opportunity for a short trade from the resistance line above towards the demand level of 0.869.
Disclosure: I am part of Trade Nation's Influencer program and receive a monthly fee for using their TradingView charts in my analysis.
✅LIKE AND COMMENT MY IDEAS✅

USD/JPY SELLERS WILL DOMINATE THE MARKET|SHORT
Hello, Friends!
USD/JPY pair is in the uptrend because previous week’s candle is green, while the price is clearly rising on the 8H timeframe. And after the retest of the resistance line above I believe we will see a move down towards the target below at 151.123 because the pair overbought due to its proximity to the upper BB band and a bearish correction is likely.
Disclosure: I am part of Trade Nation's Influencer program and receive a monthly fee for using their TradingView charts in my analysis.
✅LIKE AND COMMENT MY IDEAS✅

AUDNZD: Bearish Continuation & Short Trade
AUDNZD
- Classic bearish pattern
- Our team expects retracement
SUGGESTED TRADE:
Swing Trade
Sell AUDNZD
Entry - 1.1327
Stop - 1.1332
Take - 1.1317
Our Risk - 1%
Start protection of your profits from lower levels
Disclosure: I am part of Trade Nation's Influencer program and receive a monthly fee for using their TradingView charts in my analysis.
❤️ Please, support our work with like & comment! ❤️

EURGBP: Bearish Forecast & Outlook
Remember that we can not, and should not impose our will on the market but rather listen to its whims and make profit by following it. And thus shall be done today on the EURGBP pair which is likely to be pushed down by the bears so we will sell!
Disclosure: I am part of Trade Nation's Influencer program and receive a monthly fee for using their TradingView charts in my analysis.
❤️ Please, support our work with like & comment! ❤️

GOLD: Short Signal with Entry/SL/TP
GOLD
- Classic bearish setup
- Our team expects bearish continuation
SUGGESTED TRADE:
Swing Trade
Short GOLD
Entry Point - 4129.1
Stop Loss - 4142.0
Take Profit - 4102.9
Our Risk - 1%
Start protection of your profits from lower levels
Disclosure: I am part of Trade Nation's Influencer program and receive a monthly fee for using their TradingView charts in my analysis.
❤️ Please, support our work with like & comment! ❤️

EURUSD Technical Analysis! SELL!
My dear followers,
I analysed this chart on EURUSD and concluded the following:
The market is trading on 1.1631 pivot level.
Bias - Bearish
Technical Indicators: Both Super Trend & Pivot HL indicate a highly probable Bearish
continuation.
Target - 1.1615
Safe Stop Loss - 1.1640
About Used Indicators:
A super-trend indicator is plotted on either above or below the closing price to signal a buy or sell. The indicator changes color, based on whether or not you should be buying. If the super-trend indicator moves below the closing price, the indicator turns green, and it signals an entry point or points to buy.
Disclosure: I am part of Trade Nation's Influencer program and receive a monthly fee for using their TradingView charts in my analysis.
———————————
WISH YOU ALL LUCK

GOLD Is Bearish! Short!
Here is our detailed technical review for GOLD.
Time Frame: 45m
Current Trend: Bearish
Sentiment: Overbought (based on 7-period RSI)
Forecast: Bearish
The market is on a crucial zone of supply 4,058.20.
The above-mentioned technicals clearly indicate the dominance of sellers on the market. I recommend shorting the instrument, aiming at 3,995.15 level.
P.S
The term oversold refers to a condition where an asset has traded lower in price and has the potential for a price bounce.
Overbought refers to market scenarios where the instrument is traded considerably higher than its fair value. Overvaluation is caused by market sentiments when there is positive news.
Like and subscribe and comment my ideas if you enjoy them!

USDCAD Will Fall! Short!
Please, check our technical outlook for USDCAD.
Time Frame: 4h
Current Trend: Bearish
Sentiment: Overbought (based on 7-period RSI)
Forecast: Bearish
The market is approaching a significant resistance area 1.402.
Due to the fact that we see a positive bearish reaction from the underlined area, I strongly believe that sellers will manage to push the price all the way down to 1.398 level.
P.S
Please, note that an oversold/overbought condition can last for a long time, and therefore being oversold/overbought doesn't mean a price rally will come soon, or at all.
Like and subscribe and comment my ideas if you enjoy them!

GOLD BEARISH BIAS RIGHT NOW| SHORT
GOLD SIGNAL
Trade Direction: short
Entry Level: 4,250.59
Target Level: 4,039.91
Stop Loss: 4,389.04
RISK PROFILE
Risk level: medium
Suggested risk: 1%
Timeframe: 12h
Disclosure: I am part of Trade Nation's Influencer program and receive a monthly fee for using their TradingView charts in my analysis.
✅LIKE AND COMMENT MY IDEAS✅

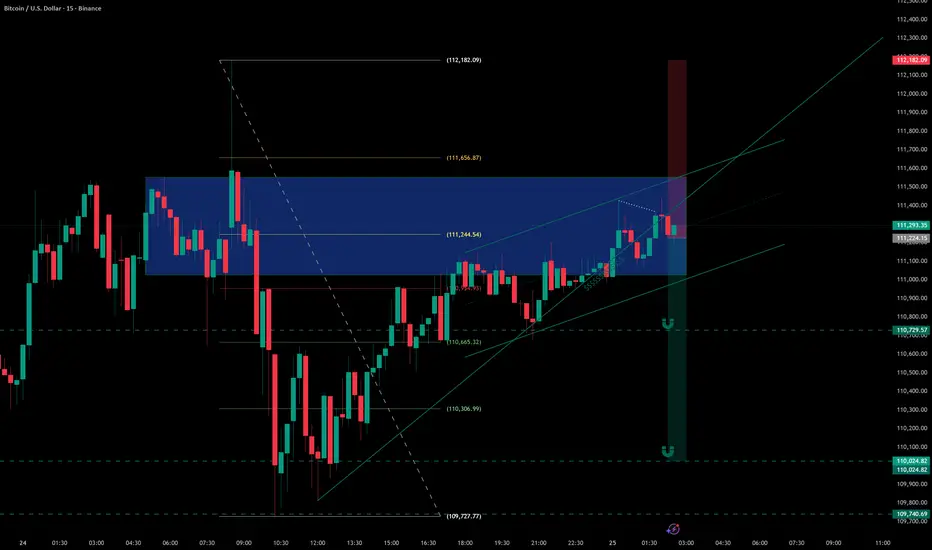
BITCOIN BEARISH BIAS RIGHT NOW| SHORT
BITCOIN SIGNAL
Trade Direction: short
Entry Level: 111,152.14
Target Level: 108,548.72
Stop Loss: 112,904.00
RISK PROFILE
Risk level: medium
Suggested risk: 1%
Timeframe: 1h
Disclosure: I am part of Trade Nation's Influencer program and receive a monthly fee for using their TradingView charts in my analysis.
✅LIKE AND COMMENT MY IDEAS✅
