BTCUSD Short: Bearish Rotation Expected Toward 107,700Hello, traders! The prior market structure for BTCUSD shows a clear downward trend, structured between a strong supply zone around the 114,000 level and a demand zone near 104,000. Price action continues to respect these boundaries, forming a broad horizontal range after multiple breakouts and retests.
Currently, the market is trading near the upper boundary of the range, where the price has once again tested the supply zone and the descending supply line. Each of these levels has historically acted as strong resistance, producing several pivot points and rejections in recent sessions. After the latest retest of this area, BTCUSD is showing signs of renewed selling pressure. The inability to break above the supply level suggests that sellers are still dominating the market, and the structure remains bearish.
My scenario assumes a continuation of the downward movement within the range. In my opinion, the next likely development is a rotation from the 109,500–110,000 area down to the 107,700 pivot point, and potentially toward the lower demand line near 104,000 if bearish momentum accelerates. Manage your risk!
Short

GBPJPY: Bears Will Push Lower
Balance of buyers and sellers on the GBPJPY pair, that is best felt when all the timeframes are analyzed properly is shifting in favor of the sellers, therefore is it only natural that we go short on the pair.
Disclosure: I am part of Trade Nation's Influencer program and receive a monthly fee for using their TradingView charts in my analysis.
❤️ Please, support our work with like & comment! ❤️

EURGBP Set To Fall! SELL!
My dear subscribers,
EURGBP looks like it will make a good move, and here are the details:
The market is trading on 0.8719 pivot level.
Bias - Bearish
Technical Indicators: Both Super Trend & Pivot HL indicate a highly probable Bearish continuation.
Target - 0.8703
About Used Indicators:
The average true range (ATR) plays an important role in 'Supertrend' as the indicator uses ATR to calculate its value. The ATR indicator signals the degree of price volatility.
Disclosure: I am part of Trade Nation's Influencer program and receive a monthly fee for using their TradingView charts in my analysis.
———————————
WISH YOU ALL LUCK

AUDCAD A Fall Expected! SELL!
My dear friends,
AUDCAD looks like it will make a good move, and here are the details:
The market is trading on 0.9115 pivot level.
Bias - Bearish
Technical Indicators: Supper Trend generates a clear short signal while Pivot Point HL is currently determining the overall Bearish trend of the market.
Goal - 0.9096
Recommended Stop Loss - 0.9125
About Used Indicators:
Pivot points are a great way to identify areas of support and resistance, but they work best when combined with other kinds of technical analysis
Disclosure: I am part of Trade Nation's Influencer program and receive a monthly fee for using their TradingView charts in my analysis.
———————————
WISH YOU ALL LUCK

EURJPY Trading Opportunity! SELL! My dear followers,
This is my opinion on the EURJPY next move:
The asset is approaching an important pivot point 176.95
Bias - Bearish
Technical Indicators: Supper Trend generates a clear short signal while Pivot Point HL is currently determining the overall Bearish trend of the market.
Goal - 176.33
About Used Indicators:
For more efficient signals, super-trend is used in combination with other indicators like Pivot Points.
Disclosure: I am part of Trade Nation's Influencer program and receive a monthly fee for using their TradingView charts in my analysis.
———————————
WISH YOU ALL LUCK

GOLD What Next? SELL!
My dear subscribers,
This is my opinion on the GOLD next move:
The instrument tests an important psychological level 4125.9
Bias - Bearish
Technical Indicators: Supper Trend gives a precise Bearish signal, while Pivot Point HL predicts price changes and potential reversals in the market.
Target - 4093.5
My Stop Loss - 4146.0
About Used Indicators:
On the subsequent day, trading above the pivot point is thought to indicate ongoing bullish sentiment, while trading below the pivot point indicates bearish sentiment.
Disclosure: I am part of Trade Nation's Influencer program and receive a monthly fee for using their TradingView charts in my analysis.
———————————
WISH YOU ALL LUCK

GOLD BEARS WILL DOMINATE THE MARKET|SHORT
GOLD SIGNAL
Trade Direction: short
Entry Level: 4,107.17
Target Level: 3,579.84
Stop Loss: 4,459.30
RISK PROFILE
Risk level: medium
Suggested risk: 1%
Timeframe: 1D
Disclosure: I am part of Trade Nation's Influencer program and receive a monthly fee for using their TradingView charts in my analysis.
✅LIKE AND COMMENT MY IDEAS✅

AUD/CHF SENDS CLEAR BEARISH SIGNALS|SHORT
AUD/CHF SIGNAL
Trade Direction: short
Entry Level: 0.519
Target Level: 0.514
Stop Loss: 0.522
RISK PROFILE
Risk level: medium
Suggested risk: 1%
Timeframe: 6h
Disclosure: I am part of Trade Nation's Influencer program and receive a monthly fee for using their TradingView charts in my analysis.
✅LIKE AND COMMENT MY IDEAS✅

AUD/NZD SELLERS WILL DOMINATE THE MARKET|SHORT
Hello, Friends!
It makes sense for us to go short on AUD/NZD right now from the resistance line above with the target of 1.127 because of the confluence of the two strong factors which are the general downtrend on the previous 1W candle and the overbought situation on the lower TF determined by it’s proximity to the upper BB band.
Disclosure: I am part of Trade Nation's Influencer program and receive a monthly fee for using their TradingView charts in my analysis.
✅LIKE AND COMMENT MY IDEAS✅

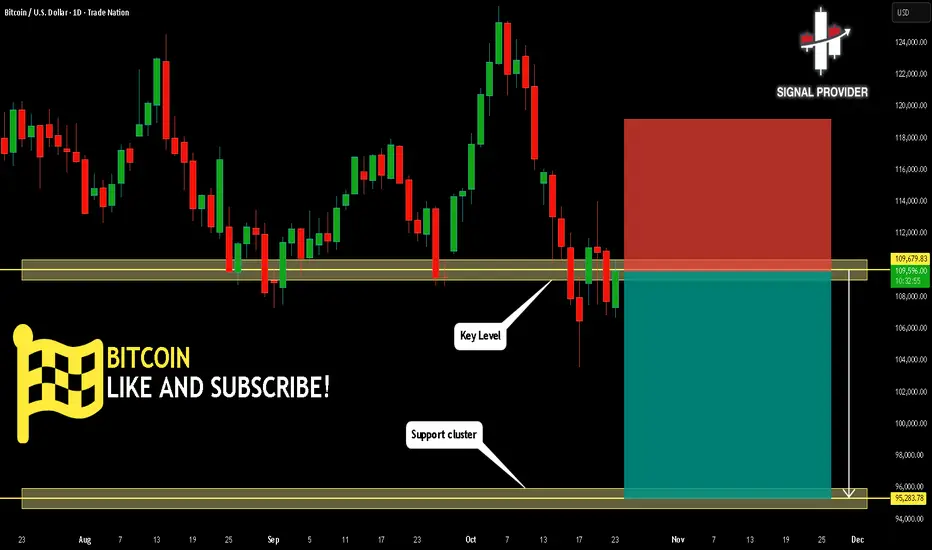
BITCOIN Will Go Down From Resistance! Short!
Take a look at our analysis for BITCOIN.
Time Frame: 1D
Current Trend: Bearish
Sentiment: Overbought (based on 7-period RSI)
Forecast: Bearish
The market is approaching a key horizontal level 109,679.83.
Considering the today's price action, probabilities will be high to see a movement to 95,283.78.
P.S
The term oversold refers to a condition where an asset has traded lower in price and has the potential for a price bounce.
Overbought refers to market scenarios where the instrument is traded considerably higher than its fair value. Overvaluation is caused by market sentiments when there is positive news.
Like and subscribe and comment my ideas if you enjoy them!
EURAUD Will Go Down! Sell!
Here is our detailed technical review for EURAUD.
Time Frame: 1D
Current Trend: Bearish
Sentiment: Overbought (based on 7-period RSI)
Forecast: Bearish
The market is on a crucial zone of supply 1.780.
The above-mentioned technicals clearly indicate the dominance of sellers on the market. I recommend shorting the instrument, aiming at 1.755 level.
P.S
Overbought describes a period of time where there has been a significant and consistent upward move in price over a period of time without much pullback.
Like and subscribe and comment my ideas if you enjoy them!

EURUSD Short: Setup After Fake Breakout and Supply RejectionHello, traders! The market for EURUSD has been developing within a well-defined descending structure, characterized by lower highs and consistent rejection from the upper supply levels. After the earlier breakout from the falling wedge formation, the price transitioned into a broad consolidation range between the 1.1720 Supply Zone and the 1.1545 Demand Zone. This structure represents a balanced market phase, where buyers and sellers are testing control over short-term direction.
Currently, the price has once again approached the upper boundary of the range — the 1.1720 Supply Level — and faced a clear rejection. This move suggests that sellers are still defending this zone and that the market remains trapped within the broader consolidation phase.
My scenario anticipates a continuation of the decline from the Supply Zone.
The recent rejection confirms the presence of strong selling interest and indicates that the next likely move will be a rotation back toward the Demand Zone near 1.1545. Therefore, I’m watching for continued bearish momentum, with the take-profit target placed at 1.1545, in alignment with the lower boundary of the range. Manage your risk.

BTCUSD Short: Rally will Continue in ChannelHello, traders! The prior market structure for BTCUSD saw a major reversal after a strong rally failed to sustain its momentum, peaking near 126000. This established a new bearish phase, with the price action since being clearly contained within a well-defined descending channel, confirming that sellers currently have the initiative.
Currently, the price is in a corrective phase within this channel. After bouncing from the lows, the auction has rallied back up and is now directly testing the descending supply line. This is a critical inflection point where the dominant downtrend could resume with force.
My scenario for the development of events is that this corrective rally will fail upon testing the channel's resistance. I expect a rejection from this supply line to confirm that sellers are still in control. In my opinion, this will trigger the next impulsive move down, which should be strong enough to break the key 108700 demand level. The take-profit is therefore set at 104250, targeting a new lower low. Manage your risk!

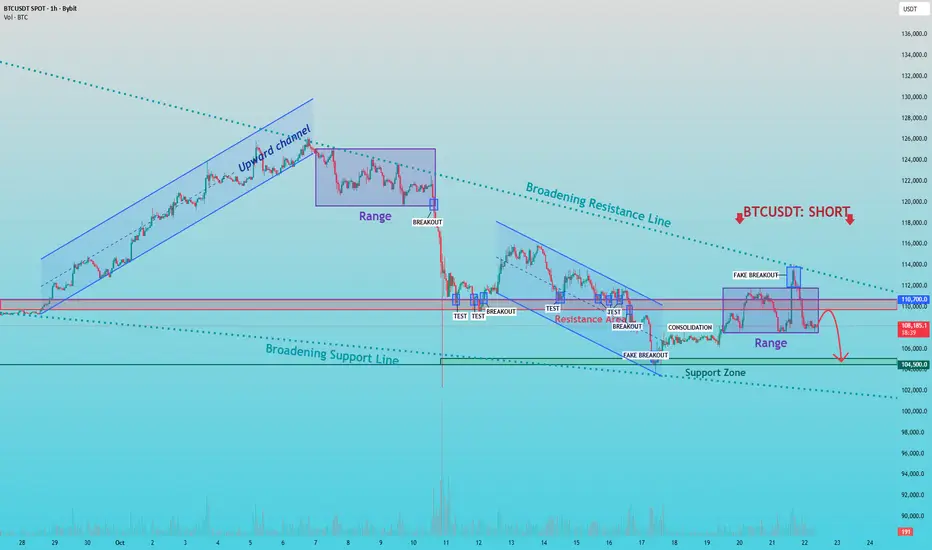
BTCUSDT — Bearish Structure Intact, Watching for BreakdownHello everyone, here is my breakdown of the current Bitcoin setup.
Market Analysis
From a broader perspective, BTCUSDT has been trading inside a broadening formation, marked by expanding highs and lows — a typical sign of increasing volatility and market uncertainty. After a strong upward move within an ascending channel, the structure broke down, shifting the market momentum from bullish to bearish.
Following the breakdown, price entered a period of range-bound consolidation and multiple tests of resistance, each confirming that sellers remain in control. The most recent fake breakout above the 114,000 zone served as a strong rejection signal — a clear sign that buying momentum is fading and that the market could be preparing for another leg down.
My Scenario & Strategy
My scenario is based on the idea that the current movement is a corrective rebound within a larger bearish structure. As the price approaches the resistance area around 110,700, I expect selling pressure to increase once again. The plan is to watch how the price reacts around this resistance zone. A confirmed rejection or failure to break above this level would validate the short scenario, potentially leading to a continuation move toward the 104,500 support zone, which aligns with the lower boundary of the broadening formation.
That's the setup I'm tracking. Thank you for your attention, and always manage your risk.
EURUSD: Bearish Continuation Setup Within Broadening PatternHello everyone, here’s my breakdown of the current Euro setup.
Market Analysis
From a broader perspective, EUR/USD has been trading within a broadening formation, characterized by expanding highs and lows — a classic sign of increasing volatility and market indecision.
The key event that has defined the recent structure was a fake breakout above the 1.1757 resistance zone. After briefly pushing higher, the price was strongly rejected, indicating clear seller dominance and triggering a shift back into a bearish phase. Since then, price action has developed multiple range-bound consolidations followed by bearish breakouts, confirming that sellers continue to control momentum.
My Scenario & Strategy
Currently, the pair is pulling back after another breakout to the downside, trading just below the broadening resistance line. In my view, this recovery is a corrective rally rather than a reversal — it’s likely to face renewed selling pressure as it approaches the resistance area. I’m watching for a rejection confirmation around the upper boundary of the pattern. If that rejection holds, it would validate the short scenario and potentially trigger a continuation move toward the 1.1555 support zone — the lower boundary of the formation.
The broader structure remains bearish, and as long as EUR/USD stays below 1.1700, short setups are favored. A confirmed rejection could open the way for another wave of selling toward the next key support at 1.1555.
That's the setup I'm tracking. Thank you for your attention, and always manage your risk.

GOLD Analysis: Watching for Reaction Near Buyer ZoneHello traders, I want to share with you my opinion about Gold. The market for Gold has been in a strong bullish trend for quite some time, forming a clear upward channel structure. Each impulse has been followed by a short consolidation phase (range), allowing the market to gather liquidity for the next push higher. However, after reaching the key Resistance Level near 4368, the price entered a Seller Zone where heavy supply emerged, triggering a sharp correction. This move broke the short-term market structure and pushed the price down towards the Buyer Zone — an important support area that previously acted as a base for a strong rally. Currently, Gold is trading near the bottom of a descending correction channel, approaching a crucial decision point. I expect the market to make a small corrective move to retest the Resistance Line of this channel, and if rejection follows, it could open the way for another bearish leg toward my TP around 4020. From a broader perspective, this decline still looks like a healthy correction within a major uptrend, so I’ll be watching closely how the price reacts inside the Buyer Zone — it might offer great opportunities for the next bullish impulse later on. Thank you for reading! Please share this idea with your friends and click Boost 🚀

Bitcoin Correction Continues: Buyers’ Last Stand at 106KHello, traders, I want share with you my opinion about Bitcoin. After a strong bullish impulse, BTCUSDT reached a local high and entered a consolidation phase, forming a clear range. The subsequent breakout to the downside signaled the start of the current corrective phase. At the moment, the price is moving within a descending structure, defined by a resistance line from recent lower highs and a support line connecting local lows. The market recently retested the previous Support Level (now acting as resistance) near 109,000 and is showing bearish pressure again. Currently, the price is trading near the Buyer Zone (106,000–107,000), which previously served as a strong demand area. I expect the market to test this zone once again, where buyer reactions will determine the next move. I think that BTC will consolidate between the Buyer Zone and Resistance Line, forming a potential accumulation before any decisive breakout. If buyers manage to defend 106,000, we could see a rebound toward the 110,000–112,000 region. However, a confirmed breakout below the Buyer Zone would open the path to TP1 = 106,300 and possibly extend the correction lower. Please share this idea with your friends and click Boost 🚀

Euro will likely Continue its Decline to 1.1560 pointsHello traders, I want share with you my opinion about Euro. The market for the Euro has seen a significant shift in its structure, following a 'fake breakout' above the 1.1780 Resistance Level which led to a new ATH near 1.1920. This reversal initiated a new bearish phase, with the price action for EURUSD now being contained within a downward wedge. Currently, after finding support near the bottom of this formation, the asset is in a corrective rally, approaching the descending resistance line of the wedge. In my mind, this rally is a corrective move that will fail upon testing the wedge's resistance. I expect that the price will complete its small upward movement and be rejected from this dynamic resistance. I think this rejection will confirm that sellers remain in control and will trigger the next major decline. Therefore, I have placed my TP at the 1.1560 level, targeting the major buyer zone at the bottom of the structure. Please share this idea with your friends and click Boost 🚀

Bitcoin - We've reached the last line of support🔱 The Buyers’ Zone represents the last major support before price potentially drops toward the red centerline. 🔱
👉 The 3-Drives pattern, signaling exhaustion in the current move.
👉 Broader markets are highly stretched; a broader trend reversal would likely pull Bitcoin down with it.
👉 The slanted support line in the dayli chart is now resistance that could not be washed away.
Given these conditions, there’s a strong possibility that this final support zone won’t hold, leading to a deeper flush.
For targets I see the red Centerline, and even the L-MLH, which gives us a natural support.
Stay sharp and trade safe—wishing you a profitable week ahead
AUDUSD: Short Signal Explained
AUDUSD
- Classic bearish formation
- Our team expects pullback
SUGGESTED TRADE:
Swing Trade
Short AUDUSD
Entry - 0.6494
Sl - 0.6499
Tp - 0.6485
Our Risk - 1%
Start protection of your profits from lower levels
Disclosure: I am part of Trade Nation's Influencer program and receive a monthly fee for using their TradingView charts in my analysis.
❤️ Please, support our work with like & comment! ❤️

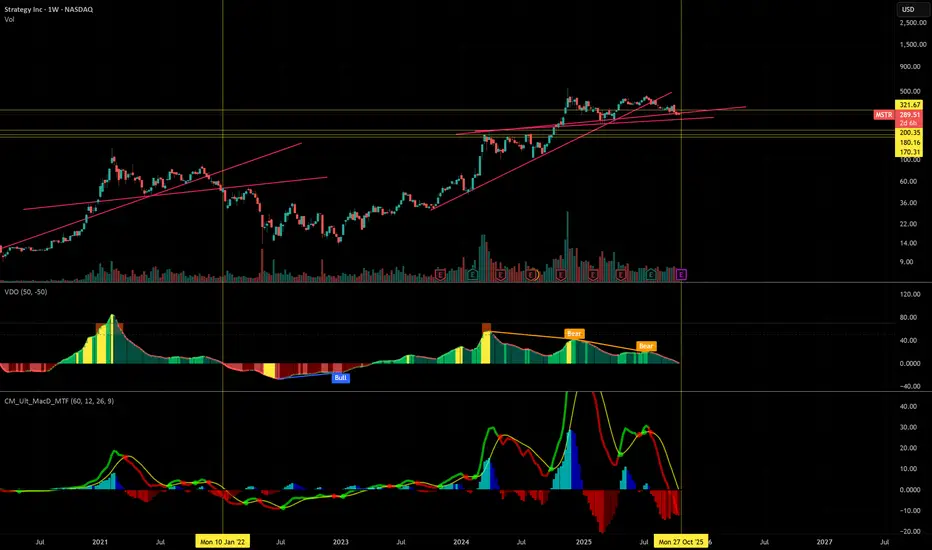
GOLD US SHORTGOLD 60 DAY Target point
You try! Easy Money,
The gold Only long position after!!!
check my profile gold / play button
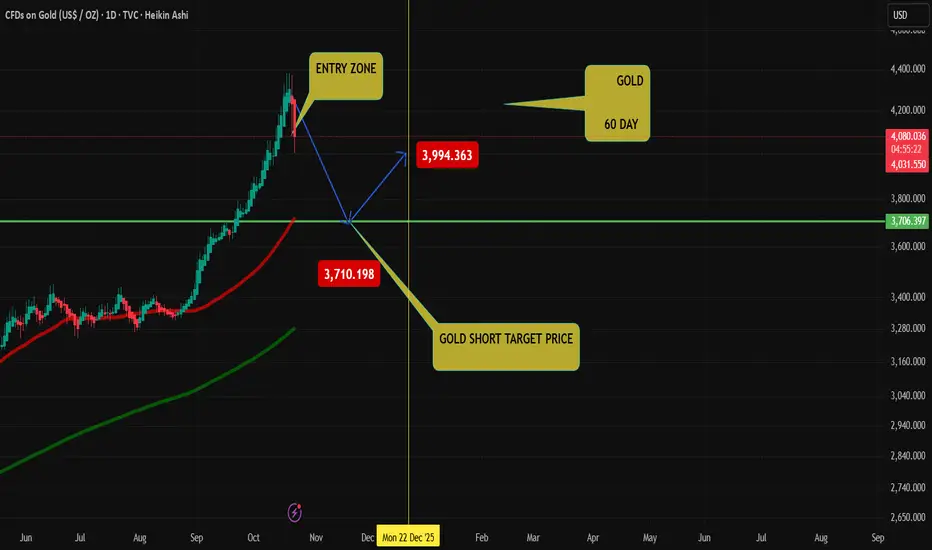
If this looks bullish.. you got another thing coming History doesn't repeat itself, but it often rhymes. So far 1:1.
I reckon the next 356 days will test out Saylors holders
USDCAD My Opinion! SELL!
My dear friends,
My technical analysis for USDCAD is below:
The market is trading on 1.4027 pivot level.
Bias - Bearish
Technical Indicators: Both Super Trend & Pivot HL indicate a highly probable Bearish continuation.
Target - 1.4012
Recommended Stop Loss - 1.4037
About Used Indicators:
A pivot point is a technical analysis indicator, or calculations, used to determine the overall trend of the market over different time frames.
Disclosure: I am part of Trade Nation's Influencer program and receive a monthly fee for using their TradingView charts in my analysis.
———————————
WISH YOU ALL LUCK
