EURAUD Short tradeEURAUD has broken a Support zone after being in a downtrend for multiple days.
Short EURAUD at retest of zone. Trail your stop loss.
TP 1 @ 1.56 TP 2 @ 1.536. Use efficient risk management.
Shorting


Short selling using the RSI of VWAP strategyRSI of VWAP has been published for Long side entries only. However, it can be used to short the equity. below are the details ...
1. Add VWAP to your chart
2. Add RSI (period 14) (set oversold line to 25 and overbought line to 70)
3. change the source of RSI to VWAP
when the VWAP crosses down to Oversold line at 25 , take the short position
cover the short position when vwap reaches overbought line 70
you can take profits anywhere you are comfortable / defined targets ...
Let me know what do you think of this idea ... based on that I will implement the code for short strategy.

Bitcoin NEUTRAL?! Huge resistance! More BEARISH SETUP!Hey there,
Please follow me on TV and like this post!
What do you think? Comment below!
Bitcoin currently seems kinda neutral.
If I had to choose, I would say it is leaning bearish.
1. Major resistance of 14k
2. Extensive run up
3. No retest of prior important levels 12k to 12,5k
And yet we should not underestimate Bitcoins strength!
We can also push beyond 14.5k, but the pullback will come!
Therefore shorting seems to be no way for me now.
Will way to catch the dip phase!
Cheers,
Konrad


Boulevard Of Broken DreamsWhatever will going to happen will happen, and what we need appeared.
Why the market had likely overshot when the economy still struggle? Because it is the nature of stock market, people like to run away from reality, wanna live in richness fantasy. "The more sweet dreams are the more hurtful when wake up" . The economy will affect the stock market, never the opposite.
When the music stop? We will find out in the next 2 weeks.
We can see a big pullback in 3500 resistance but the next 2 weeks could decide the market destiny. Keep your head objective, conscious, calm and cool. You will make a better decision.
Short below 3450, recommend if weekly price close under this position. (Stop loss >3600)
Press like & follow to support my work.
Thanks for your attention !

AU TradeStructure has been broken. Let's if that area holds as the new lower high. A nice 4.48:1 RRR trade


critical situation .. But I am shorting for sure.....if BTC come back to 9.2k then I am long.. but still shorted from 9.2k.
if BTC goes below 8.6k shorting continue to 7.2k to 6.5k area........... thank you.......

Is a shorting like the one of March 12th predictable? BTC 2020- How would you predict a movement like the one we saw on May 12th? Those days BTC lost >55 % of its value.
- How can we take advantage of that?
- What technical/fundamental indicators do you suggest to use/be more accurate?
Any ideas and thoughts about this topics are welcome.
Guys, push the like button, write a comment, and share with your friend and foes. I'd appreciate your collaboration. THANK YOU! ☺

GBPUSD LIVE TRADE
GBPUSD H4- This pair is currently in a Downtrend with price below the 50EMA.
Reason For Entry- Market Pullback followed by Engulfing Candle.
SL- 70PIPS🛑
TP- 70PIPS✅
TP2- 140PIPS✅ (2:1R/R)

Well, I mean.THIS IS NOT ANY FINANCIAL ADVICE, just some info.
Quite simply this is a short IMO, RSI is at 90! And there is bearish divergence.

USD/CADIt is grow up a little bit, but breaking down to downtrend.
Short, when the candle at the top

$OKTA -- shorting this pre ER parabolic piece of shit$OKTA look at this insane parabola. shorting it pre-ER nuff said


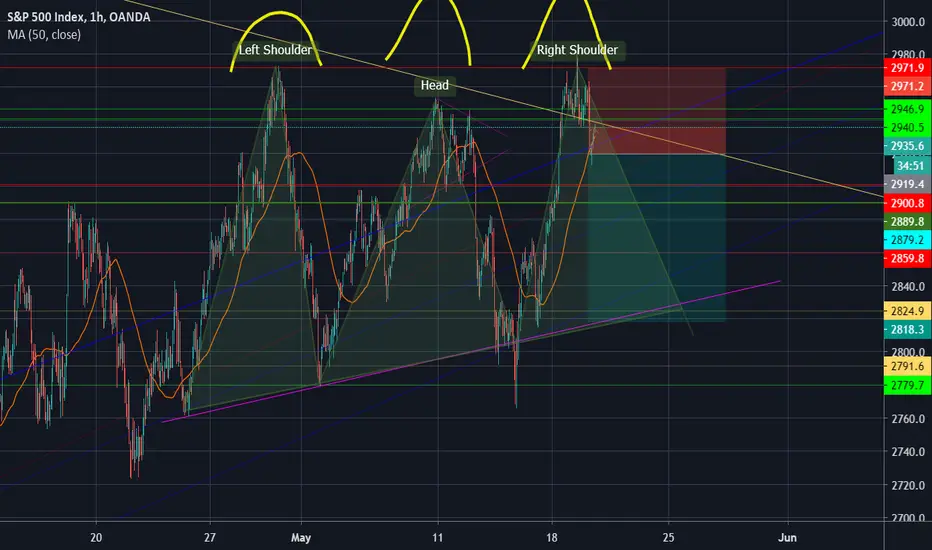
"The Real" Head and shoulder of the S&P ???I'm posting this as an idea, I thought that the head and shoulder was already here when we touched the 2780 level but we came back because the feds and Powell saying that they will do anything to keep the rally. Now this one (that I have in the picture) might come next week so I hope that the feds can't fight this really obvious technical indicator of a fall.
Or, I'm with a sell position and is just my bias of the trade trying to see and catch any false indicator of a big fall. (Although I'm pretty sure it won't go over 2971 or 2980 again).
Please let me know what do you think?!!!

OMXS30 - Short OpportunityOMXS30 might have some percent upside, but the market is starting to show weakness. This recession is just starting. Here is a shorting idea.

NASDAQ - Short OpportunityNasdaq might have some percent upside, but the market is starting to show weakness. This recession is just starting. Here is a shorting idea.

Dow Jones Industrial Average - Short OpportunityDJI might have some percent upside, but the market is starting to show weakness. This recession is just starting. Here is a shorting idea.

AUDCHF SHORTINGAUDCHF Wants to fall go back into the trend line. If it goes back into the trend it can gradually fall down and break the big red trend line.

CHFJPY SHORTINGA quick way to make a great amount of profit if it follows the trend line. It may be a little late now to enter but still has a potential cause it can go until the pink line and even brake it to hit the blue line macd and rsi supports this.

