$ES Futures: Bearish Breakdown Ahead? Short Setup Inside
## 🔻 ES Futures Bearish Setup: Shorting into Weakness (Aug 21, 2025) 🔻
### 🏦 Market Outlook
* 📉 **Bias:** Bearish sentiment dominates
* 🔎 **Tech drag** + weak momentum = downside risk
* ⚠️ Key support in focus: 6296–6298 zone
---
### 📊 Trade Idea (SHORT)
* 🎯 **Instrument:** ES Futures
* 📉 **Direction:** SHORT
* 💰 **Entry:** 6369.75 (near market)
* 🛑 **Stop Loss:** 6390.00
* 🎯 **Target:** 6300.00
* 📊 **Size:** 1 contract (\$50/pt)
* 💪 **Confidence:** 65%
* ⏰ **Timing:** Market Open
---
### ⚠️ Risk Watch
* 🌀 Low volume may cause chop
* 📉 Bounce risk near 6296–6298
* 🌍 Macro catalysts could shift flows
---
🔥 Hashtags for Reach 🔥
\#ESFutures #SP500 #FuturesTrading #DayTrading #SwingTrading #SPX #MarketOutlook #BearishSetup
Shortsetup

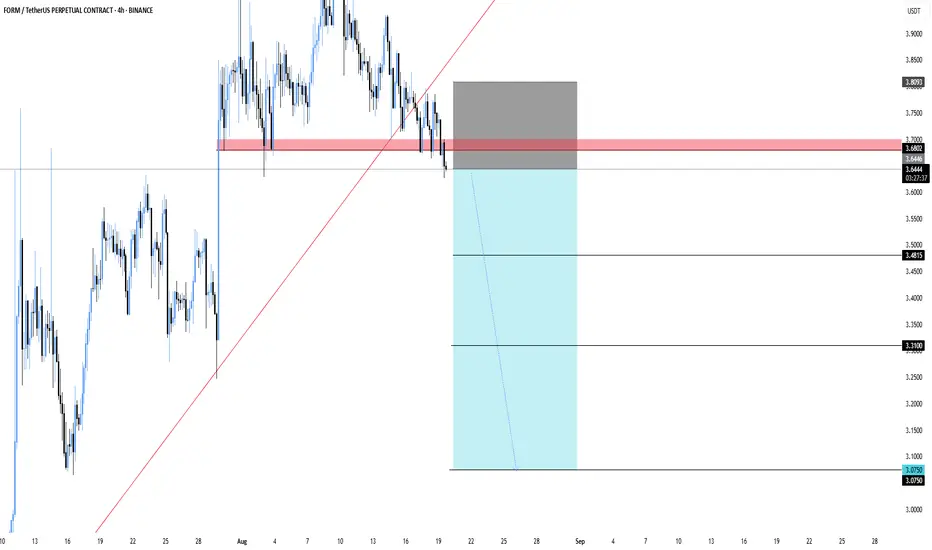
FORMUSDT.P – Break Below SupportFORMUSDT – Break Below Support
FORM has broken its trendline and slipped under the support zone. As long as it stays below this area, the momentum looks bearish with more room to the downside.
Entry: 3.64
Stoploss: 3.8093
Targets:
3.48
3.31
3.075
Let’s see if the breakdown continues or if buyers step back in.
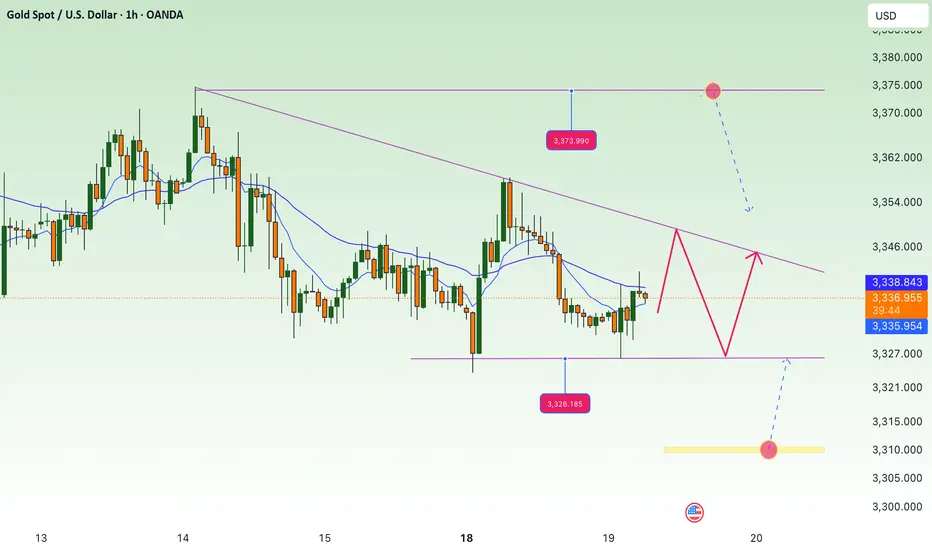
Recovered and traded below 3374 , XAU today⭐️GOLDEN INFORMATION:
Gold (XAU/USD) came under renewed selling pressure in Thursday’s Asian session, stalling Wednesday’s solid rebound from the $3,311–3,312 zone, its lowest level in nearly three weeks. The release of the late-July FOMC minutes revealed a hawkish tilt, with policymakers voicing greater concern over inflation than labor market conditions. This has tempered expectations for a jumbo Fed rate cut in September, bolstered the U.S. Dollar, and diverted flows away from the non-yielding metal.
Further weighing on gold, optimism surrounding a potential resolution to the Russia–Ukraine conflict has dampened safe-haven demand. At the same time, political noise added uncertainty after President Donald Trump called for Fed Governor Lisa Cook to resign amid mortgage fraud allegations, raising questions over the central bank’s independence. This could limit aggressive USD buying and lend some support to bullion. Looking ahead, traders will eye global flash PMI readings for fresh cues before Fed Chair Jerome Powell’s highly anticipated remarks at the Jackson Hole Symposium.
⭐️Personal comments NOVA:
Short-term downtrend line, gold price maintains accumulation at 3300 - 3374, use fibo to find support reaction points
⭐️SET UP GOLD PRICE:
🔥SELL GOLD zone: 3373- 3375 SL 3380
TP1: $3366
TP2: $3354
TP3: $3344
🔥BUY GOLD zone: $3302-$3300 SL $3295
TP1: $3313
TP2: $3325
TP3: $3337
⭐️Technical analysis:
Based on technical indicators EMA 34, EMA89 and support resistance areas to set up a reasonable SELL order.
⭐️NOTE:
Note: Nova wishes traders to manage their capital well
- take the number of lots that match your capital
- Takeprofit equal to 4-6% of capital account
- Stoplose equal to 2-3% of capital account

Ross Stores Faces Crucial $150 Resistance TestTrend:
The stock has remained inside a descending channel since Aug 2024. Price is currently testing the upper trendline resistance at $150–151, a level where it has been repeatedly rejected.
Momentum Indicators:
RSI (60.3): Slightly bullish but shows bearish divergence vs price → signals weakening momentum.
MACD: Bullish but flattening, suggesting fading momentum; a bearish crossover could confirm downside.
Trade Plan-Bearish Setup (base case – rejection at resistance)
Entry (Short): $145–147 zone
Stop-Loss: $150.60-152 (above trendline)
Targets: $144.43,$140.62,$138.91,$137.54, and even lower, if bearishness persists.

EURJPY SHORTi see potential for EURJPY to go down to 155 level.
At the moment there are not confirmed down move yet, but the way how price is behaving at the moment i belive we will see down movment i next days/weeks.
Trade according to your strategy!

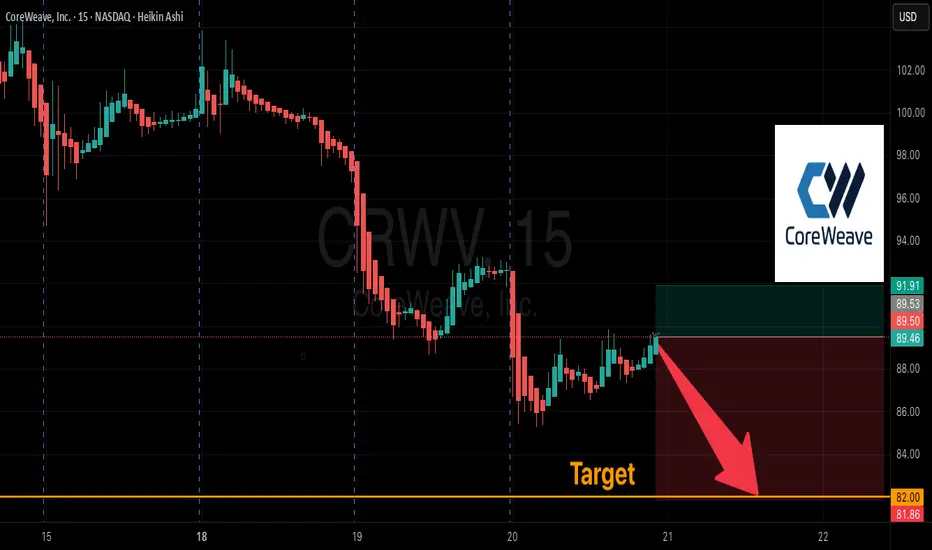
CRWV Bearish Breakdown – $82P Loading
# ⚠️ CRWV \$82P – Bearish Breakdown Alert 🚨📉
**Summary (2025-08-20):**
CRWV is flashing strong **bearish momentum** across all models:
* 📉 Daily & Weekly RSI both below key thresholds = heavy downside pressure.
* 💼 Volume up **1.5x vs last week** = institutional selling confirmation.
* 🔻 Options skew bearish: High OI at **\$80 & \$85 puts**, Call/Put ratio = 1.00 (neutral on surface, but leaning bearish).
* 🌐 VIX at **16.6** = stable environment for weekly option plays.
---
## 📊 Trade Setup
* 🎯 **Instrument:** CRWV
* 🔀 **Direction:** PUT (SHORT)
* 💵 **Entry Price:** 0.94
* 🎯 **Profit Target:** 1.40 → 1.88 (50–100% gain)
* 🛑 **Stop Loss:** 0.42 (\~45% risk)
* 📅 **Expiry:** 2025-08-22
* 📈 **Confidence:** 75% (strong institutional selling + bearish momentum)
* ⏰ **Entry Timing:** Market open
---
### 🚨 Key Risks:
* High **gamma risk** with only 2 days left.
* Potential short squeeze due to clustered OI at \$80–\$85 puts.
---
💡 **Play Idea:** Short-dated **\$82 puts** align perfectly with the bearish setup — but manage risk tightly due to gamma heat.
Gold Trade the range until it breaks Short Setup Here is a quick video on the current range and what I see going into Friday with the Fed speaking .
I have given some key levels and reaction zones for what could be a volatile reaction in the gold price .
Tools used Fibonacci, Time price opportunity charts , Anchored vwap and bars pattern .
Any questions then please leave in the comments section below the chart

BTC - Following Crash PlanBTC has been following my analysis of predicting a potential crash here.
We can use DXY to anticipate when a significant liquidity grab / flash crash will occur.
Since DXY is retesting a major breakdown on the weekly - monthly, it would be wise to watch for volatility today on Bitcoins price, noting these liquidity regions if we are about to enter a bull run ranging out 3-5 years.
Targets and potential corrective patterns marked on this chart.
Happy trading.

SHORT ON GBP/CHFGBP/CHF has a nice double top and has just created a lower high confirming the pattern to complete price reversal to the downside.
Looking to catch 100-200 pips to the next level of demand.

Gold price drops to 3300, accumulation⭐️GOLDEN INFORMATION:
Gold prices fell on Tuesday as the U.S. Dollar extended modest gains for a second session, while geopolitical optimism weighed on safe-haven demand. XAU/USD is trading near $3,317, with markets eyeing the potential for progress in peace talks following U.S. President Donald Trump’s meetings with Vladimir Putin, Volodymyr Zelenskiy, and European leaders.
Speculation over a possible de-escalation of the Ukraine–Russia conflict has pressured bullion, which typically benefits during times of heightened uncertainty. Last Friday’s Trump-Putin talks laid the groundwork for further dialogue, and on Monday Trump met with Zelenskiy and European counterparts to push for a ceasefire and set the stage for trilateral negotiations between Kyiv and Moscow.
⭐️Personal comments NOVA:
Gold prices under selling pressure ahead of today's FOMC meeting, aiming to fall back to psychological support zone 3300
⭐️SET UP GOLD PRICE:
🔥SELL GOLD zone: 3339- 3341 SL 3346
TP1: $3330
TP2: $3320
TP3: $3310
🔥BUY GOLD zone: $3302-$3300 SL $3295
TP1: $3313
TP2: $3325
TP3: $3337
⭐️Technical analysis:
Based on technical indicators EMA 34, EMA89 and support resistance areas to set up a reasonable SELL order.
⭐️NOTE:
Note: Nova wishes traders to manage their capital well
- take the number of lots that match your capital
- Takeprofit equal to 4-6% of capital account
- Stoplose equal to 2-3% of capital account

Selling pressure continues to return to 3300Plan XAU day: August 20, 2025
Related Information:!!!
Gold (XAU/USD) slid to its lowest level in nearly three weeks during the Asian session on Wednesday, with bearish sentiment prevailing as market participants await a decisive break below the 100-day Simple Moving Average (SMA) to confirm prospects for further downside. The US Dollar (USD) extended its steady ascent for a third consecutive session, supported by fading expectations of more aggressive monetary easing by the Federal Reserve (Fed), which remains a primary headwind for the non-yielding precious metal.
In addition, renewed optimism over a potential Russia–Ukraine peace agreement has added to the downward pressure on safe-haven gold. Looking ahead, investors will turn their attention to the release of the FOMC meeting minutes, while Fed Chair Jerome Powell’s upcoming remarks at the Jackson Hole Symposium may provide further clarity on the central bank’s policy trajectory. These developments are poised to play a pivotal role in shaping near-term USD demand and guiding the next directional move for the commodity
personal opinion:!!!
Gold price recovered to break through 3327 to gain liquidity and continue the downtrend
Important price zone to consider : !!!
Resistance zone point: 3330 zone
Sustainable trading to beat the market

GBPUSD Short Position idea! RR 1:6Price broke the daily trend line and its tested back the trend line resistance twice on 4HR down trend fibonacci. This could be a possible pullback till the key zone. Trade with your own risk, Cheers!

Accumulate, price range 3341 decreases along the trend linePlan XAU day: August 19, 2025
Related Information:!!!
Gold (XAU/USD) has surrendered part of its intraday advance and moved lower during the American session on Tuesday, as the resilience of the US Dollar (USD) weighs on the precious metal. Earlier in the day, Gold rebounded from an overnight dip triggered in the wake of Monday’s White House summit between US President Donald Trump, Ukrainian President Volodymyr Zelenskyy, and key European leaders. Although the talks underscored diplomatic alignment, the absence of a ceasefire has sustained elevated geopolitical uncertainty, thereby offering a degree of support to safe-haven assets.
As of writing, XAU/USD is trading near $3,335, retreating from an intraday peak of approximately $3,345. A stronger US Dollar continues to cap bullish momentum, while slightly softer US Treasury yields—following three consecutive sessions of gains—provide only limited relief for the metal. Looking ahead, market participants will turn their focus to the Jackson Hole Symposium and Wednesday’s release of the FOMC meeting minutes for clearer guidance on the Federal Reserve’s policy outlook. With markets still pricing in a September rate cut, any dovish signals could help re-energize demand for Gold in the sessions to come.
personal opinion:!!!
Support zone 3327, gold price reacted to recover showing that gold trend today is still mainly accumulating and decreasing according to the formed H1 trend line
Important price zone to consider : !!!
Resistance zone point: 3341 zone
Sustainable trading to beat the market

continue to accumulate waiting for FOMC, above 3300⭐️GOLDEN INFORMATION:
Gold (XAU/USD) found dip-buying interest in Tuesday’s Asian session, rebounding from the more than two-week low hit a day earlier. Support for the non-yielding metal comes largely from rising expectations that the Federal Reserve will restart its rate-cutting cycle in September. In addition, a cautious tone across broader markets is fueling safe-haven flows into bullion.
⭐️Personal comments NOVA:
Gold price continues to maintain the accumulation zone above 3300, the market moves sideways waiting for FOMC information
⭐️SET UP GOLD PRICE:
🔥SELL GOLD zone: 3374- 3376 SL 3381
TP1: $3365
TP2: $3355
TP3: $3342
🔥BUY GOLD zone: $3311-$3309 SL $3304
TP1: $3322
TP2: $3333
TP3: $3348
⭐️Technical analysis:
Based on technical indicators EMA 34, EMA89 and support resistance areas to set up a reasonable SELL order.
⭐️NOTE:
Note: Nova wishes traders to manage their capital well
- take the number of lots that match your capital
- Takeprofit equal to 4-6% of capital account
- Stoplose equal to 2-3% of capital account
▒₿▒ BITCOIN FORECAST | 6HR ▒₿▒COINBASE:BTCUSD
[ [ ]]
In my last analysis on July 25th, I laid out a bullish forecast targeting the $150K level, based on a fractal pattern that had been tracking well. However, the market has reached a critical divergent point. The recent price action, particularly the confirmation of major weekly bearish signals, requires us to reassess and adapt. As of today, the bullish case has been invalidated, and the inverse bearish fractal is now the primary scenario.
What Changed? The Confluence of Bearish Signals
Several major warning signs have now been confirmed, forcing this change in outlook:
The Double Shooting Stars: As noted on August 14th, two powerful Shooting Star candles appeared on the weekly chart. This was the first major indicator of a potential top. We needed a strong weekly close to invalidate this pattern, and we got the opposite.
Break of Major Trend Support: The price has now broken a major ascending trendline on the daily chart, a clear signal that sellers have taken control of the short-to-medium term trend.
The Fractal Inversion: The price action began to diverge from our bullish fractal and started to perfectly mirror an inverted, bearish version of the same pattern.
The New Forecast: Following the Bearish Fractal
The image above shows the original bullish fractal (in teal) and the now-active inverted fractal (in pink). The breakdown of the daily trendline was the trigger, and this fractal now provides a potential roadmap for the correction that is underway.
This isn't just a pattern; it's a visual representation of the path of least resistance, which is now clearly to the downside.
Key Levels to Watch
This fractal path aligns perfectly with the key technical levels we must now watch. These are the battlegrounds that will define this correction:
Established Resistance: ~$124,000. This is now the confirmed peak. The bears are in full control as long as we remain below this level.
Initial Warning Sign (Triggered): A close below $111,000. We have already breached this level, confirming the initial phase of the downtrend. The likelihood of this being a simple correction, rather than the start of a bear market, drops significantly with every day we spend below it.
Full Bear Market Confirmation: A decisive weekly close below $104,000. This remains the most critical level. According to the analysis, if we break below the $104k-$100k zone, there is an
80% likelihood that we are in a Bear Market and that the ~$124k high was the final top for this bull run.
Conclusion
The bullish forecast has been invalidated by a confluence of powerful, high-timeframe bearish signals. The market is now following a bearish inverted fractal, which aligns with our key technical levels.
The primary expectation is that this correction will continue, with the $104,000 support zone being the next logical destination. Stay safe and manage your risk accordingly.
This is not financial advice (NFA). This is for educational purposes only. Always do your own research (DYOR).
DISCLAIMER
I AM NOT A FINACIAL ADVISOR, NOR AM I YOURS. THIS IS NOT FINANCIAL ADVICE. MEARLY DOODLINGS ON A MATHMATICALLY DRIVEN GRAPHICAL INTERFACE, TRACKING AN INVISIBLE 256BIT MILITARY-GRADE ENCRYPTED ASSET. . . FOR ENTERTAINMENT/AMUSEMENT PUROSES ONLY. ENJOY!

GBPCADDate:
August 18, 2025
Session:
Asia Session
Pair:
GBPCAD
Bias:
Short
Liquid from last week lies it should sweep those pools
this week.
Entry:1.86448
Stop Loss:1.86761
Target:1.84527
RR:6.21

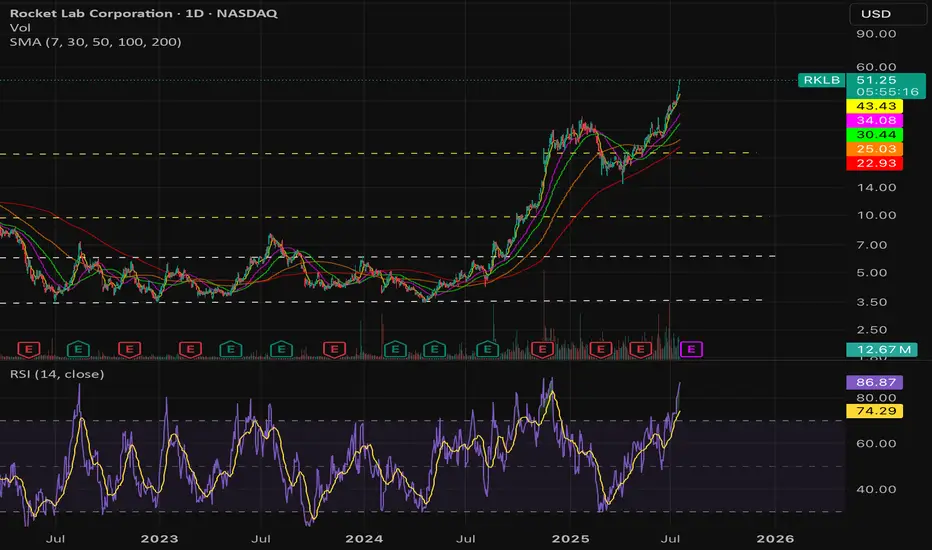
$RKLB Overvalued asf! - NASDAQ:RKLB is overvalued. I will either stay on the sidelines or short the heck out of this POS.
- Company sells hopium which doesn't have meaningful materialization as of now and not even in the distant future.
Fundamentally,
2025 | 2026 | 2027 | 2028
-0.32 | -0.08 | 0.17 | 0.47
Revenue:
576.83M | 905.01M | 1.21B | 1.69B
- Market cap of NASDAQ:RKLB currently sits at 24.61B as of July 17, 2025.
- People who are buying now are buying someone else bag and are in for a horrible ride.
- Consider buying it under $15 if you are super bullish
SHORT ON GBP/USDGU is ready to fall after a CHOC to the downside from a major supply area.
Dollar is also strong pushing to the upside which will cause pound to fall in this pair.
Looking to catch 200-400 pips on GU.

BTC - Potential Crash Update As complicated as this has been, I still suspect this massive crash on BTC to occur.
My suspicion is this this move up isn’t a true bull market, but a bearish retest. DXY breaking down a major multi month bearish pattern shows a bull run beginning now and spanning our 5 years on BTC and equities.
I suspect BTC to continue abruptly dropping per my plan here, as laid out in previous posts.
Happy trading.

SOLUSDSOLUSD Short Call Minor support broken
A short is planned as on larget time frame retracement is pending

XAU recovers, mostly sideways below 3375⭐️GOLDEN INFORMATION:
Gold (XAU/USD) slipped toward $3,330 in early Asian trading on Monday, pressured by stronger-than-expected U.S. Producer Price Index (PPI) data. Investors now turn their attention to the meeting later today between U.S. President Donald Trump and Ukrainian President Volodymyr Zelenskiy for potential market-moving headlines.
Thursday’s hotter inflation print forced traders to scale back expectations for a September Federal Reserve rate cut, weighing on the yellow metal. The U.S. PPI rose 3.3% year-on-year in July, sharply above June’s 2.4% increase and well beyond the 2.5% forecast, reinforcing headwinds for bullion.
⭐️Personal comments NOVA:
Gold price recovers around 3353, downtrend line. Maintain accumulation below strong resistance zone 3375
⭐️SET UP GOLD PRICE:
🔥SELL GOLD zone: 3374- 3376 SL 3381
TP1: $3365
TP2: $3355
TP3: $3342
🔥BUY GOLD zone: $3312-$3310 SL $3305
TP1: $3322
TP2: $3333
TP3: $3348
⭐️Technical analysis:
Based on technical indicators EMA 34, EMA89 and support resistance areas to set up a reasonable SELL order.
⭐️NOTE:
Note: Nova wishes traders to manage their capital well
- take the number of lots that match your capital
- Takeprofit equal to 4-6% of capital account
- Stoplose equal to 2-3% of capital account

XAUUSD READY FOR DROP (READ CAPTION)Hi trader's.
current price:3357
gold today breakdown lower and H1 candle i watching sell
gold resistance zone 3358 and 33670
gold breakdown 3340 then gold fill down
resistance zone 3358_3365_3370
support zone 3340
target 3330_3325
please like comment and follow thank you

Last call for shorts. GBP/USD Last opportunity for me to go short. 100% retracement on the daily which is good. It is reacting at the level we just need a bigger rejection to justify the madness. Downside target marked with intent to scale in at structure lower high points.
