Dont get trapped chasing the Opening gap Bitcoin Hello and Welcome
Here I present to you a quick theory on the Bitcoin CME open in the event we gap down and open in the 112K range.
This idea is just something to consider in the week ahead, with many traders destroyed as a result of Fridays crash and emotions running high going into the week ahead I encourage you to take a listen to this potential scenario for the week ahead on BTC.
Shortsignal

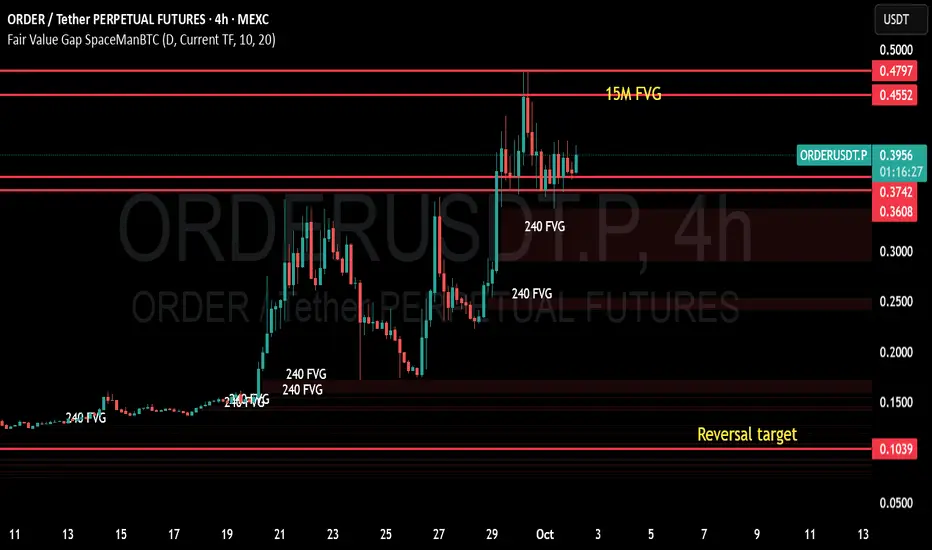
Potential Reversal on ORDERUSDT.P: Key Support Levels to watchAnalyzing the current price action of ORDERUSDT.P suggests a possible reversal, with expectations of a retracement back to the 10-cent level. Notably, a bottomless wick on the 4-hour candle at this level indicates strong support. Additionally, a Fair Value Gap (FVG) below the current price reinforces the likelihood of a return to that zone. The market typically seeks to fill FVGs above the current price, which aligns with this potential move.
However, a bearish Head and Shoulders pattern is forming at the top, signaling possible downside momentum. An FVG is also present at the top of the daily candle, serving as a potential resistance level.
Traders should monitor these key levels and patterns to inform their entries and exits. Caution is advised given the conflicting signals—support at 10 cents versus bearish pattern formation at the top.
Hope The Apple Doesn't Rot The Fall of The Big Apple
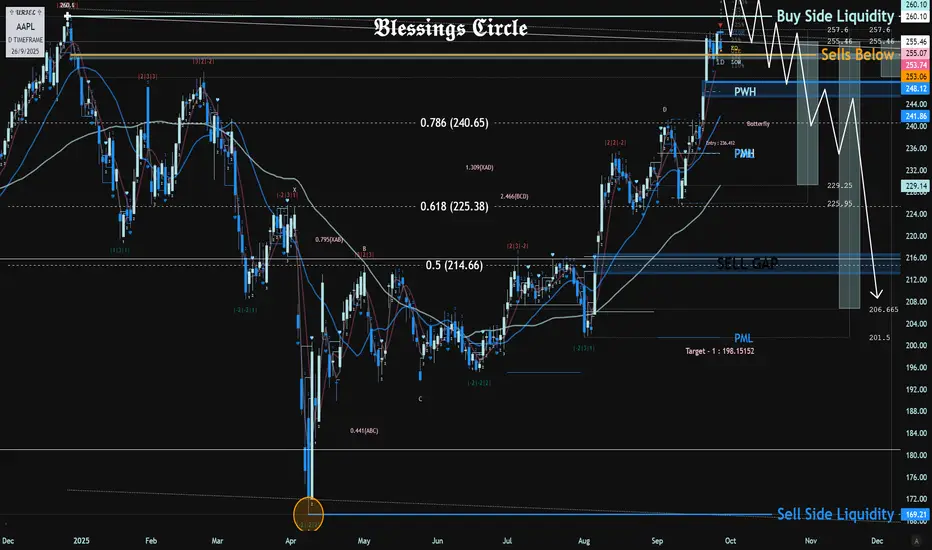
Watching For AAPL to Potentially Trade into 260.10 This Week.
If 260.10 Does Trade I Will Be Looking To Short & Actively Scale into Sells Up Until 265.
If AAPL Were To Squeeze Above 265, The Sells Thesis Would Be Null.
First Sells Target Would Be Into The Sell Gap @ 248-245.
Second Sells Target Would Be The Second Sell Gap @ 216-212.
Third Sells Target Would Be The April Wick Low @ 169.21.
We Can Fall Potentially Fall As Low As 100 or Maybe Even Lower, but Majority If Not 100% of My Sells Positions Will Be Scaled Out Into The Above Sells Targets.
Good Luck To All Traders Going Into The Month Of October & Start of Q4.
With NFP on Friday to Finish off The Week Make Sure To DE Risk If Long.
Selling pressure continues to adjust, reaching 3692?⭐️GOLDEN INFORMATION:
Gold (XAU/USD) slips in Friday’s Asian session, unable to build on Thursday’s rebound as strong US data lifted the Dollar to a three-week high and tempered Fed rate-cut bets. Still, losses may be limited with traders awaiting the US PCE inflation report for clearer direction.
⭐️Personal comments NOVA:
Gold price adjusted, accumulated according to 2 trend lines. Waiting for break and continue to get liquidity around support zone 3692
⭐️SET UP GOLD PRICE:
🔥SELL GOLD zone: 3788- 3790 SL 3795
TP1: $3780
TP2: $3770
TP3: $3760
🔥BUY GOLD zone: $3692-$3690 SL $3685
TP1: $3700
TP2: $3710
TP3: $3725
⭐️Technical analysis:
Based on technical indicators EMA 34, EMA89 and support resistance areas to set up a reasonable SELL order.
⭐️NOTE:
Note: Nova wishes traders to manage their capital well
- take the number of lots that match your capital
- Takeprofit equal to 4-6% of capital account
- Stoplose equal to 2-3% of capital account

Gold prices began to correct, 3690⭐️GOLDEN INFORMATION:
Gold (XAU/USD) holds firm near $3,750 in Thursday’s Asian session, supported by expectations of further Fed rate cuts and ongoing geopolitical risks. The Fed’s September 25 bps cut lowered the policy rate to 4.00%–4.25%, with its dot plot signaling two more reductions this year and another in 2026. Lower borrowing costs reduce the opportunity cost of holding Gold, keeping the metal underpinned.
⭐️Personal comments NOVA:
Gold price continued to break the 3750 support and fell sharply afterwards. Gold price started a major correction after the market was too FOMO on the buying side.
⭐️SET UP GOLD PRICE:
🔥SELL GOLD zone: 3788- 3790 SL 3795
TP1: $3780
TP2: $3770
TP3: $3760
🔥BUY GOLD zone: $3691-$3689 SL $3684
TP1: $3700
TP2: $3710
TP3: $3725
⭐️Technical analysis:
Based on technical indicators EMA 34, EMA89 and support resistance areas to set up a reasonable SELL order.
⭐️NOTE:
Note: Nova wishes traders to manage their capital well
- take the number of lots that match your capital
- Takeprofit equal to 4-6% of capital account
- Stoplose equal to 2-3% of capital account

Negative In Wheels ShareThe company's financials indicate a mixed performance. While it has a healthy promoter holding and a good cash flow, it has also faced challenges such as declining revenues and a lower-than-industry revenue and profit growth in recent years.

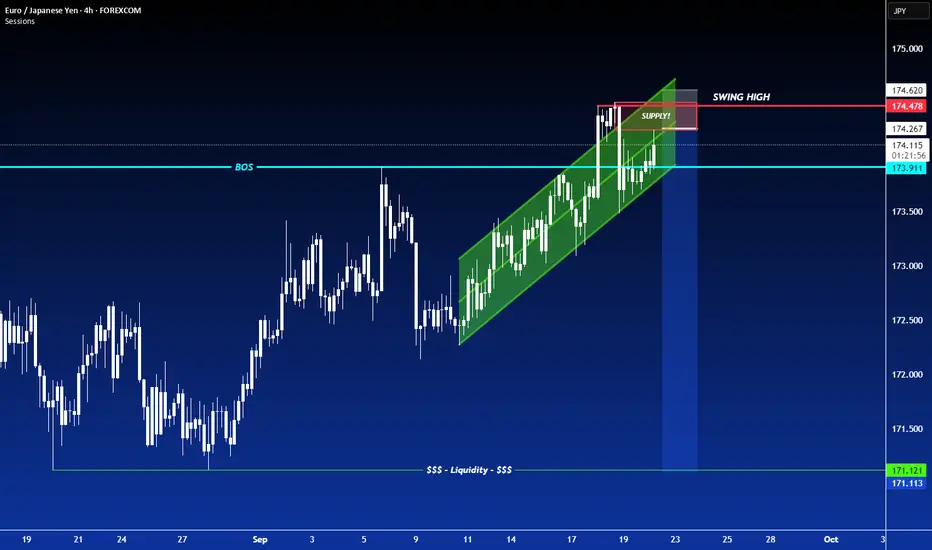
SHORT ON EUR/JPYEUR/JPY has created a beautiful rising channel (bearish reversal pattern) at a major resistance area/zone.
It has also given us a CHOC (change of character) from up to down on the lower timeframe.
I will be selling EJ looking to make 200-300 pips.
Continued correction - gold price falls below 3600⭐️GOLDEN INFORMATION:
Gold (XAU/USD) slips for a second day, trading near $3,640 in Friday’s Asian session after profit-taking from record highs and a stronger US Dollar (USD). The pullback follows the Fed’s first rate cut of the year, a 25 bps move that lowered the target range to 4.0%–4.25% and signaled two more cuts ahead. Chair Jerome Powell described the decision as a “risk management cut” and downplayed urgency for further easing, a less dovish tone that supports the Greenback and weighs on bullion in the near term.
⭐️Personal comments NOVA:
Gold price continues to adjust, recovers briefly and returns to the 3600 price zone
⭐️SET UP GOLD PRICE:
🔥SELL GOLD zone: 3704- 3706 SL 3711
TP1: $3690
TP2: $3680
TP3: $3665
🔥BUY GOLD zone: $3596-$3598 SL $3591
TP1: $3608
TP2: $3620
TP3: $3630
⭐️Technical analysis:
Based on technical indicators EMA 34, EMA89 and support resistance areas to set up a reasonable SELL order.
⭐️NOTE:
Note: Nova wishes traders to manage their capital well
- take the number of lots that match your capital
- Takeprofit equal to 4-6% of capital account
- Stoplose equal to 2-3% of capital account

SHORT ON GBP/USDGU is finally ready to drop. Nice Double top at resistance zone.
Looking to catch 300-400 pips to the previous low.

UGLY! FNMA Collapse! We Are in a Recession!The recession began in earnest in late 2022.
Subsequently, in March 2023, Silicone Valley Bank was wiped out; the feds took over and now here we are on the other side of the expansionary cycle. As it currently stands, banks are still sitting on hundreds of billions in unrealized losses.
This can collapse faster than you can blink.
Dump 'em!

SHORT ON EUR/CADEUR/CAD has a nice rising channel at a major resistance area.
There is a lot of Liquidity to the downside.
I have a sell limit set at the top of the channel to activate me after the possible sweep of liquidity behind the resistance line of the channel.
Looking to catcu 300-400 pips on this play.

The ray of hope doesn't last longI think in about 2 hours we will see a new downward movement.
Only the market maker knows of course.
But these are calculations using probability theory.
Always look at all the details when analyzing, don't look at the fact that the candle is green.
It lures you psychologically to buy. But it's still early.
There are few liquidations on the market. They are not being written about yet.
There are still strong token inflows to the exchanges

SHORT ON GBP/CADGBP/CAD has a nice rising wedge at a major supply zone.
Price has failed to make a Higher High and is now starting to make Lower Highs.
Looking to catch 300-400 pips to the downside over the next week or so.

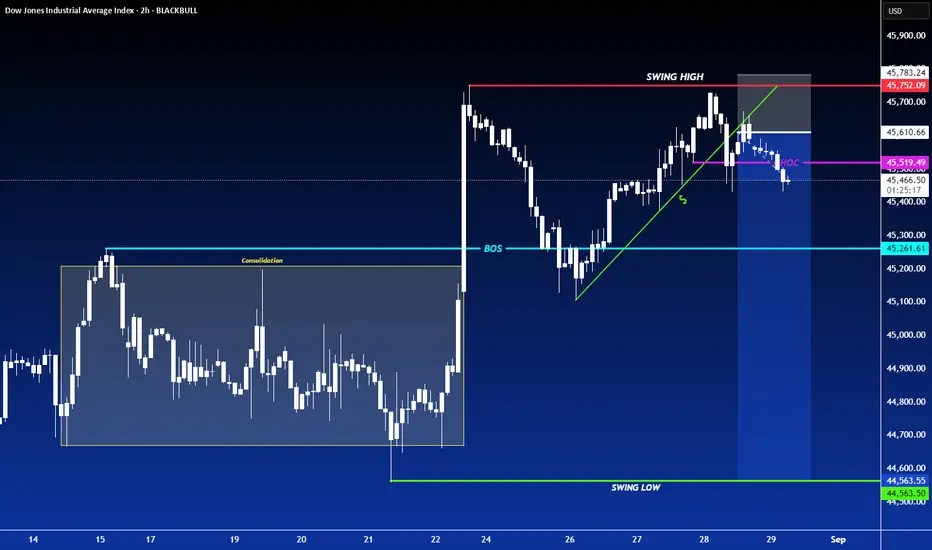
SHORT ON US30US30 has given us a CHOC to the downside after a long time run up.
I will be selling US30 to the consolidation zone looking to catch 1000 points over the next few days.
BTC adjusts down, market suspects interest rate cut💎 BTC PLAN UPDATE – Early Week (08 / 25 )
🔎 BTC Analysis
After retesting the 117k resistance zone (117,566 USD), the price reacted with a sharp drop. This indicates that the selling pressure in this area remains very strong.
Currently, the price is falling near the EMA200 (red line ~111,664) – which is a key short-term support level.
📌 Key Reaction Zones
111k – 110k:
This is the confluence of EMA200 + Fib 0.5.
If the price holds, there’s potential for a rebound back to 113k–115k.
109k – 108k:
Next strong support.
If 111k breaks, this zone will be the next critical reaction point.
105k – 104k:
Major long-term support (confluence of Fib extension + old demand zone).
In a bearish scenario, the price could test this zone before bouncing back up.
🌐 Market Sentiment & Expectations
After BTC was rejected at 117k, market sentiment has turned cautious and somewhat bearish in the short term.
However, many traders still expect BTC to hold above the EMA200 to trigger a rebound → if this level holds, sentiment may shift back to bullish, targeting 115k–117k again.
On the contrary, if the price breaks deep below 110k, the market may enter short-term panic and shift focus toward the strong support at 104k.

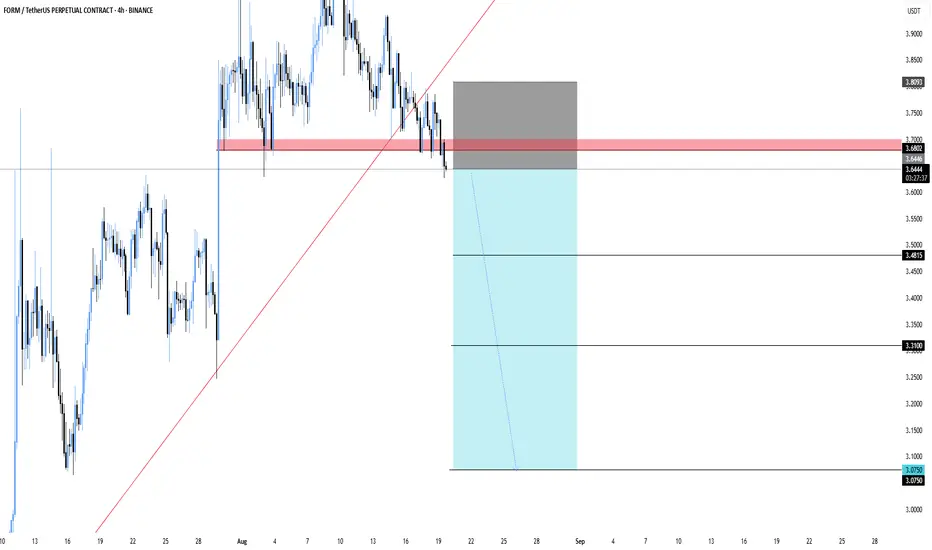
FORMUSDT.P – Break Below SupportFORMUSDT – Break Below Support
FORM has broken its trendline and slipped under the support zone. As long as it stays below this area, the momentum looks bearish with more room to the downside.
Entry: 3.64
Stoploss: 3.8093
Targets:
3.48
3.31
3.075
Let’s see if the breakdown continues or if buyers step back in.
Recovered and traded below 3374 , XAU today⭐️GOLDEN INFORMATION:
Gold (XAU/USD) came under renewed selling pressure in Thursday’s Asian session, stalling Wednesday’s solid rebound from the $3,311–3,312 zone, its lowest level in nearly three weeks. The release of the late-July FOMC minutes revealed a hawkish tilt, with policymakers voicing greater concern over inflation than labor market conditions. This has tempered expectations for a jumbo Fed rate cut in September, bolstered the U.S. Dollar, and diverted flows away from the non-yielding metal.
Further weighing on gold, optimism surrounding a potential resolution to the Russia–Ukraine conflict has dampened safe-haven demand. At the same time, political noise added uncertainty after President Donald Trump called for Fed Governor Lisa Cook to resign amid mortgage fraud allegations, raising questions over the central bank’s independence. This could limit aggressive USD buying and lend some support to bullion. Looking ahead, traders will eye global flash PMI readings for fresh cues before Fed Chair Jerome Powell’s highly anticipated remarks at the Jackson Hole Symposium.
⭐️Personal comments NOVA:
Short-term downtrend line, gold price maintains accumulation at 3300 - 3374, use fibo to find support reaction points
⭐️SET UP GOLD PRICE:
🔥SELL GOLD zone: 3373- 3375 SL 3380
TP1: $3366
TP2: $3354
TP3: $3344
🔥BUY GOLD zone: $3302-$3300 SL $3295
TP1: $3313
TP2: $3325
TP3: $3337
⭐️Technical analysis:
Based on technical indicators EMA 34, EMA89 and support resistance areas to set up a reasonable SELL order.
⭐️NOTE:
Note: Nova wishes traders to manage their capital well
- take the number of lots that match your capital
- Takeprofit equal to 4-6% of capital account
- Stoplose equal to 2-3% of capital account

SHORT ON EUR/NZDEUR/NZD has taken out a previous swing high and has started to consolidate.
There is plenty of liquidity to be collected to the downside.
I will be selling EUR/NZD to the next demand level looking to catch 300-400 pips.

SHORT ON GBP/CHFGBP/CHF has a nice double top and has just created a lower high confirming the pattern to complete price reversal to the downside.
Looking to catch 100-200 pips to the next level of demand.

Gold price drops to 3300, accumulation⭐️GOLDEN INFORMATION:
Gold prices fell on Tuesday as the U.S. Dollar extended modest gains for a second session, while geopolitical optimism weighed on safe-haven demand. XAU/USD is trading near $3,317, with markets eyeing the potential for progress in peace talks following U.S. President Donald Trump’s meetings with Vladimir Putin, Volodymyr Zelenskiy, and European leaders.
Speculation over a possible de-escalation of the Ukraine–Russia conflict has pressured bullion, which typically benefits during times of heightened uncertainty. Last Friday’s Trump-Putin talks laid the groundwork for further dialogue, and on Monday Trump met with Zelenskiy and European counterparts to push for a ceasefire and set the stage for trilateral negotiations between Kyiv and Moscow.
⭐️Personal comments NOVA:
Gold prices under selling pressure ahead of today's FOMC meeting, aiming to fall back to psychological support zone 3300
⭐️SET UP GOLD PRICE:
🔥SELL GOLD zone: 3339- 3341 SL 3346
TP1: $3330
TP2: $3320
TP3: $3310
🔥BUY GOLD zone: $3302-$3300 SL $3295
TP1: $3313
TP2: $3325
TP3: $3337
⭐️Technical analysis:
Based on technical indicators EMA 34, EMA89 and support resistance areas to set up a reasonable SELL order.
⭐️NOTE:
Note: Nova wishes traders to manage their capital well
- take the number of lots that match your capital
- Takeprofit equal to 4-6% of capital account
- Stoplose equal to 2-3% of capital account

Accumulate, price range 3341 decreases along the trend linePlan XAU day: August 19, 2025
Related Information:!!!
Gold (XAU/USD) has surrendered part of its intraday advance and moved lower during the American session on Tuesday, as the resilience of the US Dollar (USD) weighs on the precious metal. Earlier in the day, Gold rebounded from an overnight dip triggered in the wake of Monday’s White House summit between US President Donald Trump, Ukrainian President Volodymyr Zelenskyy, and key European leaders. Although the talks underscored diplomatic alignment, the absence of a ceasefire has sustained elevated geopolitical uncertainty, thereby offering a degree of support to safe-haven assets.
As of writing, XAU/USD is trading near $3,335, retreating from an intraday peak of approximately $3,345. A stronger US Dollar continues to cap bullish momentum, while slightly softer US Treasury yields—following three consecutive sessions of gains—provide only limited relief for the metal. Looking ahead, market participants will turn their focus to the Jackson Hole Symposium and Wednesday’s release of the FOMC meeting minutes for clearer guidance on the Federal Reserve’s policy outlook. With markets still pricing in a September rate cut, any dovish signals could help re-energize demand for Gold in the sessions to come.
personal opinion:!!!
Support zone 3327, gold price reacted to recover showing that gold trend today is still mainly accumulating and decreasing according to the formed H1 trend line
Important price zone to consider : !!!
Resistance zone point: 3341 zone
Sustainable trading to beat the market

SHORT ON GBP/USDGU is ready to fall after a CHOC to the downside from a major supply area.
Dollar is also strong pushing to the upside which will cause pound to fall in this pair.
Looking to catch 200-400 pips on GU.

SHORT ON GBP/AUDGBP/AUD has pulled back to a key supply zone and is currently respecting it with wick rejections.
I expect price to seek out buy side liquidity to the next demand level.
