Buy Citizens Financial GroupShort Term Trading Advice by Naranj Capital
Buy Citizens Financial Group
● Buy Range- 60 - 61
● Target- 64 - 65
● StopLoss- Below 58
● Potential Return- 5-7%
● Duration- 12-14 Trading Days
Shorttermtrading

(AAV) Fast Bounce Setup | Price:$11.28 →Target:$11.84(+ 5 %)💎 The Sleeping Giant of the Montney: Advantage Energy’s Bold Leap 🏔️🔋
Imagine a company that doesn’t just pull energy from the earth but is pioneering the technology to "clean" it as well. 🌍✨ Founded in the heart of Calgary, Advantage Energy is a dual-threat powerhouse in the prolific Montney formation. 🏗️❤️ While their core business pumps out record production, their subsidiary Entropy Inc. is revolutionizing Carbon Capture and Storage (CCS). They are proving that the future of fossils is clean, efficient, and highly profitable! 💎🔥
📉 Technical Setup: The "Quick Strike" Plan 🎯
We are tracking a classic support bounce within a long-term ascending trend channel. 🎢✅ Here is the tactical play for the short term:
🚩 Entry Point: $11.28. This level aligns with a recent technical support zone where buyers have historically stepped in. 🛡️📉
🏁 Exit Target: $11.84 (A clean +5% gain). 💰🎯 This target sits just below major overhead resistance, offering a high-probability "quick strike" for swing traders. ⚡📈
🔭 The Long-Term Vision: $15.00+ and Beyond? 🚀
While we take our profits at 5% for the short term, the "Big Picture" suggests this giant is just getting started. 🏔️💎
Production Surge: With the Progress Gas Plant set to commission in Q2 2026, production is expected to jump to 90,000 boe/d by the second half of the year. 📈🌊
Revenue Growth: Analysts forecast a massive 159% EPS growth for the coming year as high-margin liquids production ramps up. 💰🚀
Analyst Consensus: While we target $11.84 for a swing, professional analysts have a 12-month average price target of $14.14 – $15.15, with some "blue sky" estimates reaching as high as $21.00. 🎯✨
🏗️ Strategic Projects: The 2026 Catalyst 🕒
Entropy Glacier Phase 2: On track for commercial operations in Q2 2026, aiming to capture 160,000 tonnes of CO
2
annually. 🌪️❄️
The Shareholder Engine: Once debt targets are met, Advantage plans to funnel 100% of free cash flow into share buybacks, which could drive a 14% increase in production per share. 🔄🎁
What’s your strategy? 🧐 Are you taking the quick 5% profit at $11.84, or are you holding for the $15.00+ long-term transformation? Let me know in the comments! 👇💬

(DOTL) Fast Bounce Setup | Price:$ 11.67 → Target:$14 (+ 20 %)🚨 D2L (DTOL.TO): Whale Trap + RSI Oversold + The "Spring" Setup 🐋⚡
Ticker: TSX:DTOL Outlook: Bullish 🟢 Target: $14.00 🎯
1. The "Whale Trap" Signal 🕵️♂️ Yesterday, a massive 87,000 share block printed "Below Bid" at $11.10.
The Trap: Retail panic-sold seeing the red print. 🩸
The Reality: Smart money absorbed nearly $1M of stock in one second. The price instantly snapped back to $11.27.
Verdict: $11.10 is the new institutional floor. 🧱
2. RSI is Screaming "Oversold" 📉➡️📈 The Relative Strength Index (RSI) has dropped into deep oversold territory.
The Pattern: Historically, every time D2L’s RSI hits these lows, the stock acts like a stretched rubber band and snaps back violently.
The Signal: Sellers are exhausted. The elastic is pulled back. We are ready for the release. 🏹
3. The "$12 Springboard" (Year 3) 🧬 History is repeating on the yearly chart. This level is a loaded spring:
2024: Bounced from ~$12 ➡️ $20 🚀
2025: Bounced from ~$12 ➡️ $20 🚀
2026: We are back at the load zone. Load the Spring.
4. Sector Weakness vs. Strong Fundamentals 💎 The Education sector is weak and volume is low (boring), BUT D2L is getting stronger:
Wins: Recently stole Western University & NAIT from competitors. 🇨🇦
Value: Trading at ~3x Sales vs. Instructure (Canvas) buyout at ~7x.
Trade: Buy the "Boredom" to sell the "Euphoria."
📉 Trade Plan:
Entry: Under $12.00 (Deep Value Zone)
Stop Loss: Close below $10.80 (Invalidates the Whale floor) 🛑
Target: $14.00 (Gap Fill & Resistance) 💰
Summary: The Whale print at $11.10 was the clue. The RSI is the trigger. Don't let the low volume fool you—the move is loading. 🌊🚤
Not financial advice. Do your own DD!

(AFN) Long-Term Setup | Price: $ 23→ Target: Around $ 40📈🔭 Long-Term Forecast – AFN
⏳ This is a long-term outlook for AFN, which is currently trading near its lowest price levels since 2010 🕰️.
🔻 Price History & Pullback
📉 The stock declined from approximately $60 ➝ $20, representing around -66 % drop 🔻.
⚠️ This decline coincided with two consecutive years of revenue stagnation (2024–2025), showing .
💼 Fundamental Growth (Long-Term View)
🚀 Revenue expanded from $137M in 2007➝ $1.4B,in 2024 representing a +922% total increase over the long run 📊.
⛔ However, in 2024–2025 🕰️, revenue fell ~8–10% 🔻, leading to a bearish market reaction 📉.
🔮 Forward forecasts point to a return to +10–12% growth 📈, offsetting prior losses and supporting a bullish long-term outlook 🐂📊.
🧱 Major Long-Term Support Zone
📅 On the monthly timeframe, the $15 – $20 range represents a strong historical support zone 🛡️.
⏱️ This zone has held for 15+ years (0% breakdown rate), reinforcing its structural importance.
📊 Volume Profile Confirmation
🔵 The highest historical traded volume (100% peak volume node) is concentrated in this price range.
✅ This suggests maximum historical participation, confirming the area as a high-probability pullback zone.
📉➡️📈 Momentum & RSI Shift
📍 Monthly RSI reached ~30 (oversold) and has now started turning upward ⤴️.
⚡ This transition often precedes a positive momentum shift (%) after extended consolidation.
🔄 Cyclical Behavior & Seasonality
🔁 AFN historically forms major peaks every 1–4 years.
📆 Seasonality shows January–March frequently deliver 3 consecutive positive months, often producing double-digit % gains 📈📈📈.
🎯 Price Targets (2026)
🎯 Base target: $35 – $45 → +75% to +125% upside from $20
🚀 Extended target: $60 (previous high) → +200% upside, possible by late 2026, assuming forecasted growth resumes.
✅🧠 Conclusion
⭐ This setup represents a high-quality long-term opportunity, supported by:
✔️ –66.7% historical correction already priced in
✔️ 0% growth period fully absorbed by the market
✔️ Around 1000 % long-term revenue expansion
✔️ Oversold momentum + heavy volume accumulation
⏱️ At current levels, the risk-to-reward strongly favors long-term positioning (%) 💎📈

(RGCO)Fast Bounce Setup | Price:$ 20.80→ Target:$21.84(+ 5 %)📊🚀 RGCO – Demand Zone Bounce Setup 🚀📊
RGCO continues to look solid from a fundamental and technical perspective 👀💡.
💰📈 Fundamentals
The company has strong fundamentals, and revenue forecasts are growing, providing a positive outlook for the coming periods 🌱📊.
📉🔄 RSI Signal (Daily)
On the daily chart, RSI is showing a reversal from the oversold zone ⤴️📉. RSI divergence is also present, which often signals a potential pullback and bounce ⚡📊.
📐🧲 Price Action Insight
Historically, this stock tends to pull back and react strongly at these levels 🕰️✅. From a price action perspective, the current area is a clear demand zone, where buyers have previously stepped in 🧱📍.
🎯📍 Expectation
Price is currently around 20.8 💵. If this support level holds, a ~5% upside move 📈🎯 is possible in the short term.
⚠️📌 Reminder
This is a support-based pullback setup, not a breakdown scenario.

EURUSD H4 HTF Downtrend Pullback and Bullish Reaction Setup📝 Description
EURUSD after a sustained H4 bearish leg is showing a corrective pullback from HTF lows. Price is currently reacting from a local demand zone while holding above the recent H4 liquidity low, suggesting a short-term bullish correction within a broader corrective phase.
________________________________________
📈 Signal / Analysis
Primary Bias: Bullish while price holds above the H4 pullback low
Preferred Setup:
• Entry: 1.1635
• Stop Loss: Below 1.1616
• TP1: 1.1655
• TP2: 1.1672
• TP3: 1.1692
________________________________________
🎯 ICT & SMC Notes
• H4 BOS completed to the downside, current move classified as corrective
• Reaction from H4 demand and liquidity sweep supports short-term upside
• Downtrend structure remains intact unless HTF high is reclaimed
________________________________________
🧩 Summary
EURUSD is positioned for a controlled bullish correction as long as price holds above the recent H4 low. The move is considered corrective, targeting nearby HTF PD arrays before any potential continuation of the broader trend.
________________________________________
🌍 Fundamental Notes / Sentiment
With today’s focus on US Unemployment Claims, volatility risk remains elevated. As this data can quickly shift USD sentiment, positioning on EURUSD should be managed with tighter risk controls, allowing the market to confirm direction after the release rather than anticipating the outcome.
________________________________________
⚠️ Risk Disclosure
Trading involves substantial risk and may result in capital loss. This analysis is for educational purposes only and does not constitute financial advice. Always apply proper risk management, predefined stop-loss levels, and disciplined position sizing aligned with your trading plan.

Fast Bounce Setup | Price: 53.98 $ → Target: 56.67 $ (+5%)📈 Stock: MDLZ – Mondelez International 🍫🏭
🟢 Entry: 53.98 ⚡
🎯 Exit / Target: +5% → ~56.67 💰📈
🧱 Technical Support Strength
Price is holding a strong demand zone 🧱🟢
Repeated buyer reactions = solid support ✅✅
High-confidence base 🔒📉
📊 Weekly RSI Reset
RSI is deeply oversold, signaling potential rebound.
🔽⚡📈Momentum reset = fuel reload ⛽🔥
Often leads to next bullish push 🚀📈
📍 Pivot + Structure Confluence
Both Weekly & Dayly pivot support + prior structure 🎯
Confluence = higher bounce probability 📈💥
Bullish reaction favored 🟢❌
📉➡️📈 Short-Term Outlook
🚀 Expected move: ~5% upside
🔄 Mean reversion in progress
⚖️ Risk / reward favors longs 👍
📆 Mid / Long-Term Outlook
✔️ Higher-timeframe trend intact 📈
✔️ Healthy pullback, not a breakdown 🔄
✔️ Swing & position friendly 🟢📊
💼📊 Fundamental Strength
📈 Consistent revenue & earnings growth
💰 Strong cash flow & defensive business model 🛡️
🌍 Global brand power + pricing strength 🍫🏆
🔮 High expected future growth based on analyst forecasts 🚀
Fundamentals + technicals = high-conviction setup 💎
✅ Final Summary
🧱 Strong support
📊 RSI reset
🎯 Pivot confluence
💼 Solid fundamentals
🔮 Growth outlook strong
➡️ Entry: 54.03 ⚡
➡️ Target: 56.67$ 💰🚀
➡️ Bias: Bullish continuation 📈🔥

Range Expansion is Coming in BSE LtdNSE:BSE
This is a clean example of range expansion followed by orderly re-accumulation. The stock reclaimed a long-term horizontal level around 2800 and instead of rejecting, it’s holding above it while forming higher lows.
That rising trendline is the real tell. Big money is defending dips, not chasing highs.
This is how leaders behave before the next leg.
💡Entry: 2850–2870 zone or on a decisive close above 2900
⚠️Stoploss: 2720 (below rising trendline)
🎯Targets:
Target 1: 3100
Target 2: 3400
Above 3000, the stock enters a low-supply zone. Momentum traders usually join late there.

(AAV)Fast Bounce Setup | Price:$ 11.11→ Target:$11.66(+ 5 %)⚡📊 AAV – Pullback at Trendline with Strong Fundamentals 📊⚡
AAV continues to look interesting both fundamentally and technically 👀📈.
📰💰 Fundamental Outlook
Revenue forecasts remain very positive for the coming years 🚀, and the company maintains solid fundamentals, providing a strong long-term backdrop 🧱✅.
📉📊 Momentum Check (RSI)
On the daily timeframe, RSI recently pulled back from the oversold area, moving from around 34 to 39 over the past week 🔄📈. This signals improving momentum after a cooldown phase.
📐📍 Price Action Perspective
From a price action angle, the $11 zone is acting as a key pullback area 🧲. Price has once again touched the ascending trendline, showing respect for structure 📈✍️.
✅📉 Technical Confirmation
This pullback is supported by RSI confirmation on the daily chart, increasing the probability of a potential bounce from this zone ⚡🎯.
⚠️📌 Note
This looks like a technical pullback within structure, not a breakdown.

(AAPL)Fast Bounce Setup | Price:$ 260.92→ Target:$274(+ 5 %)AAPL is showing signs of a short-term pullback after a strong upside move 🚀. Price is currently testing the EMA 100, which is acting as a major resistance level on the daily timeframe 🧱⚠️.
🕯️🕯️🕯️ Candle Confirmation
Three or more candles have already confirmed rejection near this EMA zone ❌📉, strengthening the pullback scenario.
📊⚙️ Momentum Check (RSI)
On the daily chart, RSI previously dropped to around 26 😮💨 and has now bounced back to 31 🔄. This behavior usually confirms a healthy pullback, not a trend reversal ✅.
📰✨ Fundamentals in the Background
Positive news remains supportive:
📦⬆️ ~10% increase in iPhone 17 shipment demand
🤖🤝 Reported AI partnership with Google for iPhone 18
Despite the good news 🌞, price is still respecting technical resistance — suggesting much of this optimism may already be priced in 📌.
🎯📍 Short-Term Expectation
After this pullback completes ⏳, a short-term move toward the 274 area 🎯📈 is possible.
⚠️🔍 Reminder
This is a pullback within the trend, not a bearish trend change 🐂➡️🐂.

(QLYS)Fast Bounce Setup | Price:$133.36 → Target:$140 (+ 5 %) 🚀📊 QLYS — Short-Term Trade Setup (Daily) 📊🚀
💰 Entry: 133.36 (Current Price)
🎯 Target: 140.03 (+5%)
📈 Bias: Bullish continuation
💼 Fundamentals
✅ Strong & consistent EPS growth
📊 EPS trend: 3.72 → 6.13 → higher forward estimates
🔁 High-margin recurring SaaS revenue
🏦 Strong institutional-quality business
📌 Fundamentals continue to support higher prices
🧠 Behavioral Pattern
🔄 QLYS often pulls back → bases → pushes higher
📉 RSI reset after prior advance
🧲 Buyers historically step in near demand zones
📌 Current behavior matches previous continuation structures
📉➡️📈 Technical Structure
📍 Price sitting near key demand / value area
📊 RSI ~38–40 → historical bounce zone
📐 Rising structure still intact
📉 Selling pressure fading, not expanding
🚧 Key Resistance Zone — VERY IMPORTANT
🔴 $136 = Major resistance level
⚠️ Heavy supply previously appeared in this zone
🧱 Expect strong reaction / battle near this level
✨ Bullish scenario:
➡️ Clean break above $136 could open the path toward $140+
➡️ Demolishing this level likely triggers momentum continuation
⚡ Day Trading / Zone (Lower Timeframes)
🎯 $136 area = ideal scalp zone
⏱️ Best suited for 1–5 minute timeframe
📉📈 Potential sub-0.5% moves on rejection or breakout attempts
🧠 Excellent for quick reaction-based trading

CEATLTD - Breakout from Falling Channel with Trend ContinuationNSE:CEATLTD
📈Pattern & Setup:
CEAT has been consolidating inside a falling channel after a strong impulsive rally from the 3,200 zone to 4,300+. This correction has been healthy in nature, marked by lower highs and lower lows within a controlled structure — a classic bullish continuation pattern.
Price is now trading near the upper boundary of the falling channel around 3,850–3,900, indicating pressure building up for a potential breakout. The broader trend remains bullish, and this consolidation looks more like digestion rather than distribution.
A decisive close above the channel resistance can trigger the next leg of the uptrend.
📝 Trade Plan:
✍🏻Entry: Fresh entry above 3,900–3,950 on breakout confirmation with volume.
🚩Stop-Loss: 3,650 (below channel support and recent swing low).
🎯Targets:
Target 1 → 4,300 (previous swing high).
Target 2 → 4,760–4,800 (measured move projection, ~24% upside).
💡Pyramiding Strategy:
Enter first lot above 3,950 on breakout confirmation.
Add second lot above 4,150 once price sustains, trail SL to 3,800.
Add final lot above 4,300 breakout, trail SL to 4,050.
Ride the momentum toward 4,750+ as long as price holds above the breakout zone.
🧠Logic Behind Selecting this Trade:
CEAT is showing a textbook falling channel breakout setup within a strong primary uptrend. Such patterns often resolve to the upside when the prior move was impulsive. The consolidation has helped cool off indicators while maintaining structure, increasing the probability of a continuation rally once resistance is taken out.
Keep Learning. Keep Earning.
Let’s grow together 📚🎯
🔴Disclaimer:
This is not an investment advice. Always do your own due diligence before making any trading or investment decision.

Breakout Attempt from Long‑Term Trendline in LTIMindtreeBreakout Attempt from Long‑Term Trendline in LTIMindtree
NSE:LTIM
📈Pattern & Setup:
LTIMindtree is testing a major long‑term descending trendline on the weekly chart, which has capped price action since the 2022 peak. The stock has spent the last few years consolidating in a broad range, forming higher lows — a clear sign of gradual accumulation.
The recent move shows price pressing firmly into the trendline zone around 6,050–6,100. This area is a make‑or‑break level. A sustained weekly close above this trendline can trigger a powerful trend reversal and open the gates for a fresh long‑term rally.
📝 Trade Plan:
Entry: Fresh positional entry above 6,150–6,200 on a weekly closing basis.
🚩Stop-Loss: 5,600 (below recent swing support and range low).
🎯Targets:
Target 1 → 6,900 (previous supply zone).
Target 2 → 7,990–8,000 (long‑term breakout projection, ~30% upside).
💡Pyramiding Strategy:
Enter first lot on weekly close above 6,200.
Add on continuation above 6,600, trail SL to 5,900.
Add final lot above 6,900 breakout, trail SL to 6,400.
Ride the trend towards 8,000 levels if the breakout sustains with volume.
🧠Logic Behind Selecting this Trade:
This is a classic long‑term trendline breakout setup after multi‑year consolidation. Such structures often lead to strong directional moves once resistance is decisively cleared. The higher‑low structure shows institutional accumulation, and a breakout above the trendline can shift LTIMindtree back into a primary uptrend.
Keep Learning. Keep Earning.
Let’s grow together 📚🎯
🔴Disclaimer:
This is not an investment advice. Always do your own due diligence before making any trading or investment decision.

Buy Charles Schwab CorporationShort Term Trading Advice by Naranj Capital
Buy Charles Schwab Corporation
● Buy Range- 100 - 100.5
● Target- 106 - 107
● StopLoss- Below 97
● Potential Return- 5-6%
● Duration- 12-14 Trading Days

Fast Bounce Setup | Price: 536.00 → Target: 562.08 (+5%)Fundamentals 💼
MSCI maintains strong recurring revenue and solid margins. Earnings forecasts show steady growth, supporting a short-term bounce.
Repeated Behaviour 🔍
MSCI often rebounds 5–20% after clean corrections or oversold conditions.
Today’s setup mirrors previous quick-recovery cycles ⚡📈.
Volume & Price Action 📉➡️📈
Selling pressure is fading while accumulation volume is rising.
Price is sitting exactly on a historical rebound zone, where MSCI has shown multiple fast pops.
Entry: 536.00
Target: 562.08
Profit: +5% expected 💰🚀
Disclaimer:
Not financial advice. For educational purposes only.

Fast Bounce Setup | Price: 63.33 → Target: 66.49 (+5%)Fundamentals 📊
HALO continues to show strong revenue and profit forecasts, with steady growth expectations.
The fundamental outlook remains supportive for short-term upside.
Repeated Behavior 🔍
This stock has a repeated pattern of delivering at least a 5% bounce from similar oversold or congested zones.
The current structure matches previous cycles.
Price Action 📉➡️📈
Price action at this level is reacting to a resistance zone, which historically leads to a quick 5% reaction move before continuation or pullback.

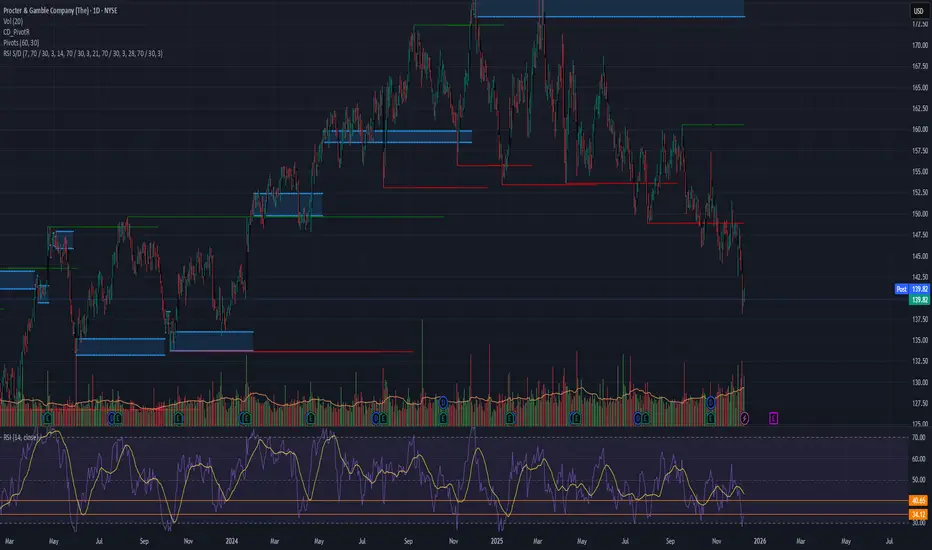
Fast Bounce Setup | Price: 139.78. → Target: 146.76 (+5%) 🌱 New Setup Forming on PG
⚡ Oversold Signal Triggered — Bounce Just Starting
📉 Strong fundamentals + behavioral dip pattern
📈 Watching for the first 3–5% move
#BehaviorBasedTrading 🔥 #LavinSignals 🚀
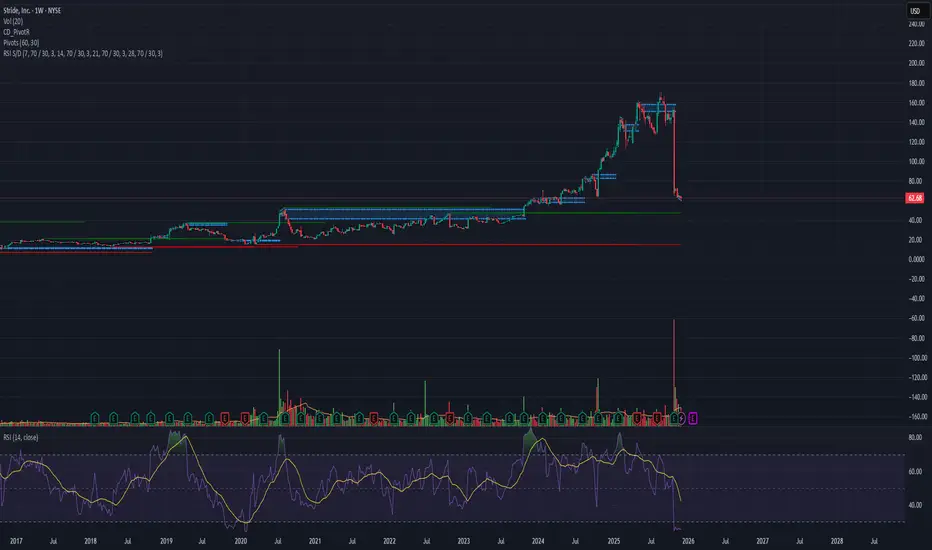
Fast Reversal Setup | Price: 62.68 → Target: 65.81 (+5%)
After the recent lawsuit-related news, LRN dropped sharply from $155 → $62 and is now deep in the oversold area 📉🔥
Volume Signal 📊
This week’s traded volume is higher than anything since its IPO, which often marks a reversal zone.
Repeated Patterns 🔍
Across the daily, weekly, and monthly intervals, the stock is showing its typical reversal pattern, matching previous bounce cycles.
Entry: 62.68
Target: 65.81
Profit: +5% 💰⚡
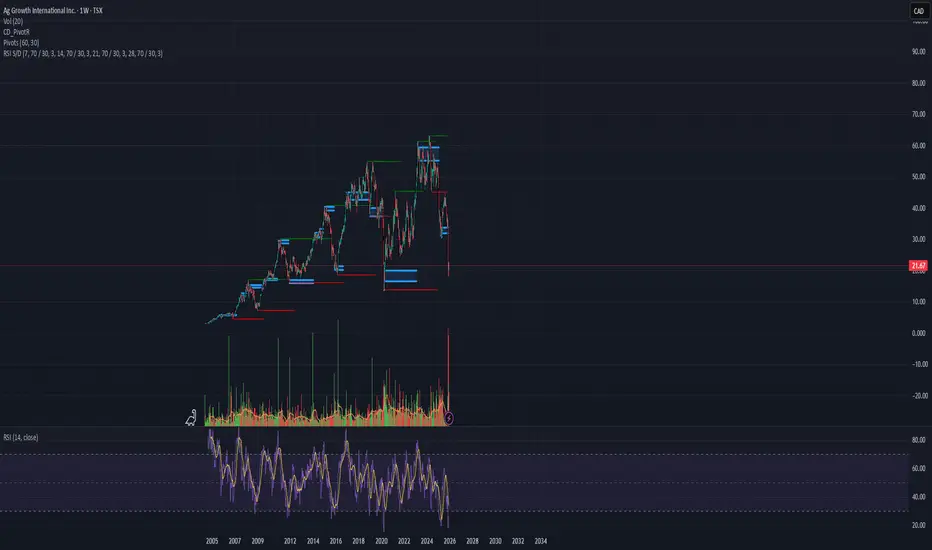
Weekly Trading Idea | AFN.AG 21.67 | Fast 5% Bounce TargetThis is my fast strategy for short moves (3–5%) ⚡
I publish these setups weekly with a win rate above 90% 📈🔥
Fundamentals are not bad 👍
The drop from ~$65 → ~$20 should be enough for a short bounce 🎯
📊 Forecast also shows an increase in revenue and profit in the coming years, which supports the upside 📈💵
From the technical side:
RSI oversold 📉
Strong support zone 🧱
Price action showing reversal signs 🔄
For a small quick profit, this looks like a good entry point 💰⚡
Fast Bounce Setup | Price: 3.61 → Target: 3.79 (+5%)Fundamentals 📊
STKL shows improving revenue and margin forecasts, indicating gradual recovery.
Even though long-term movement has been unstable, the short-term fundamental outlook supports a bounce.
Repeated Behaviour 🔍
Historically, STKL has shown a clear behavioural pattern:
after deep pullbacks or oversold conditions, it regularly produces 5%–1000% bounces before stabilizing.
Today’s setup matches those previous repeated cycles.
Volume & Price Action 🔥
Recent volume activity suggests seller exhaustion and early accumulation.
Price is sitting exactly in a zone where STKL has shown multiple fast rebounds in the past.
Entry: 3.61
Target: 3.79
Profit: +5% expected 💰⚡

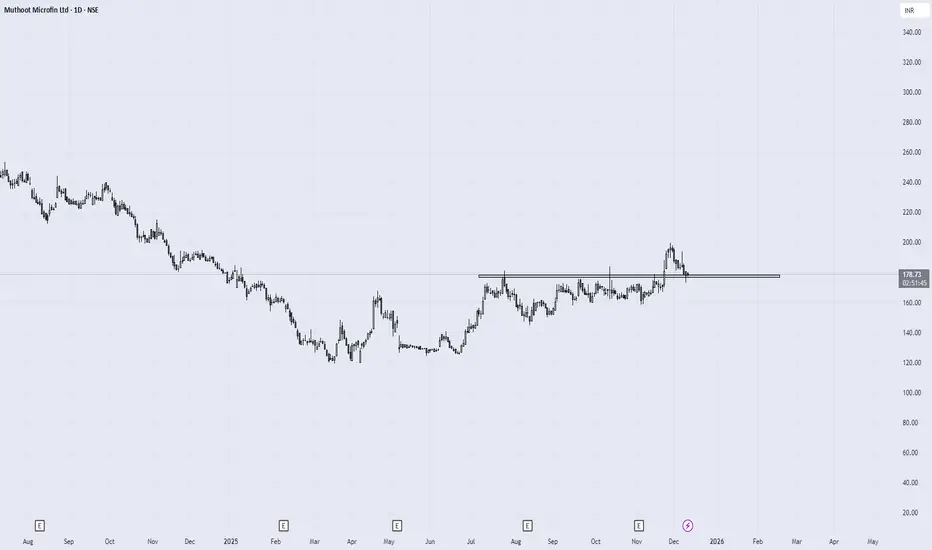
First partial entry#MUTHOOTMF
partial entry at 178
Remember this is early entry, hence not going fully in.
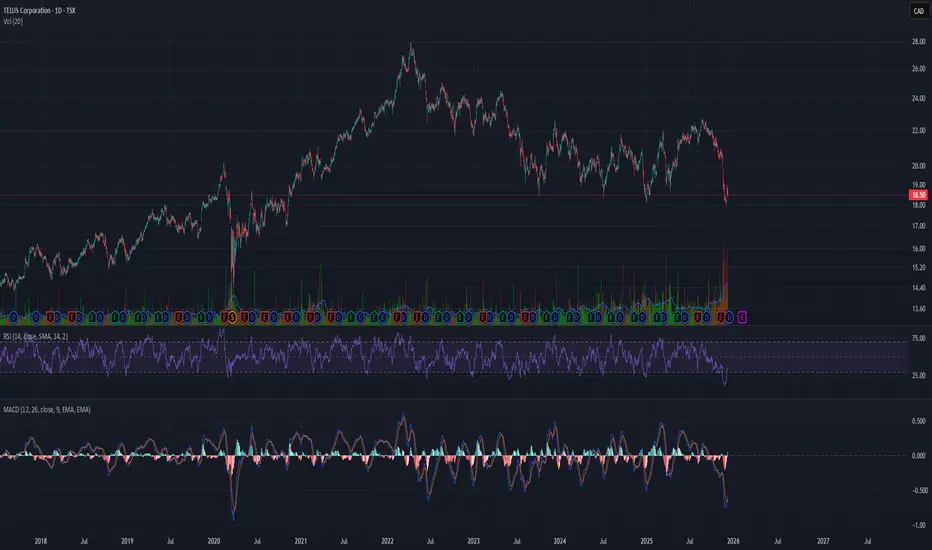
Fast Bounce Setup | Price: 18.53 → Target: 19.46 (+5%)
Fundamentals 📊💼
TELUS shows stable revenue forecasts and long-term growth in telecom and digital services.
Even during pullbacks, fundamentals remain supportive for short, quick moves.
Repeated Behavior 🔁📉➡️📈
Historically, T reacts with 5%–20% quick bounces after deep drops or oversold conditions.
Current pattern is similar to previous reversal cycles.
Volume & Price Action 🔥📊
Volume shows buyer interest, and price is sitting at a classic TELUS bounce zone.
Entry: 18.53 💵
Target: 19.46 🎯
Profit: +5% expected 💰⚡
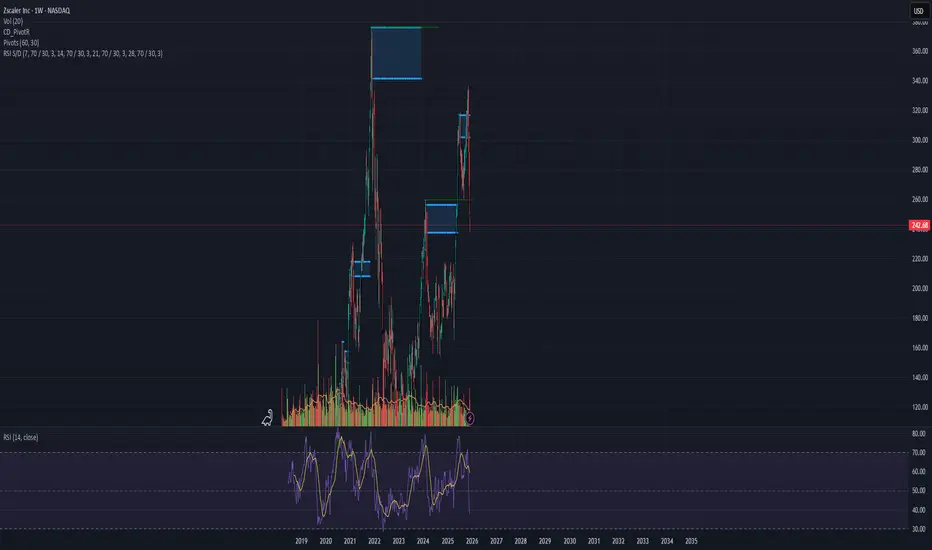
Fast Bounce Setup | Price: 242.68 → Target: 254.81 (+5%)Fundamentals 📊💼
Strong revenue growth from rising demand in cloud security and zero-trust solutions.
Forecasts support short-term upside momentum.
Repeated Behavior 🔁📉➡️📈
ZS often makes 5%–30% quick bounces after oversold drops.
The current pattern strongly matches earlier reversal cycles.
Volume & Price Action 🔥📊
Volume shows buyer accumulation, and price is sitting at a familiar bounce zone where ZS reacts quickly.
Entry: 242.68 💵
Target: 254.81 🎯
Profit: +5% expected 💰⚡