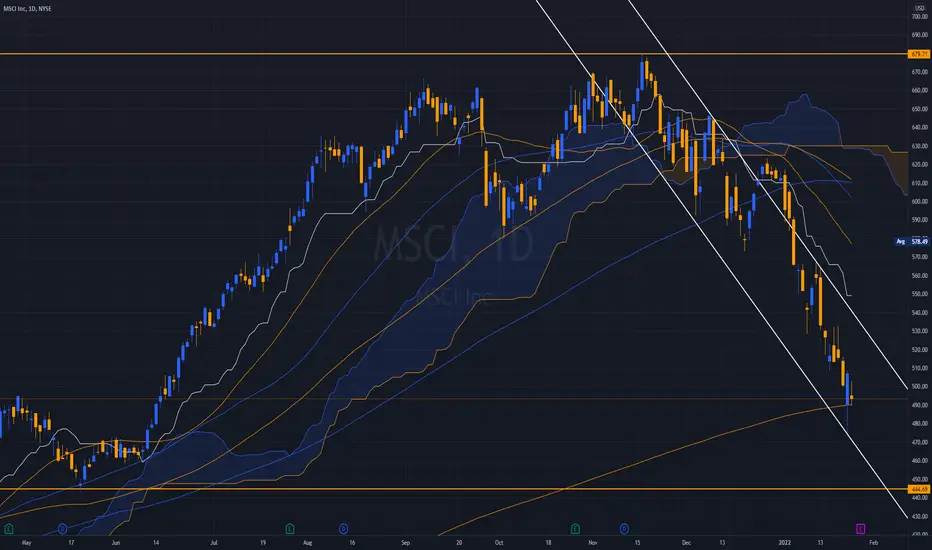
MSCI - awaiting for bullish signalTime and again the market has a way to play out the traders, they knew how you draw your charts and thus the manipulators or smart money will often went below the stop loss level to take you out and days or weeks later, push the price up again.
Let's see how it goes in a week or two time.
Key facts today
Next report date
—
Report period
—
EPS estimate
—
Revenue estimate
—
14.99USD
1.15 BUSD
2.53 BUSD
76.10 M
About MSCI Inc.
Sector
Industry
CEO
Henry A. Fernandez
Website
Headquarters
New York
Employees (FY)
5.79 K
Founded
1998
FIGI
BBG000RTDY25
MSCI, Inc. engages in the provision of investment decision support tools including indices, portfolio risk and performance analytics and corporate governance products and services. It operates through the following segments: Index, Analytics, ESG and Climate, and All Other-Private Assets. The Index segment focuses on the investment process, including developing indexed financial products. The Analytics segment offers risk management, performance attribution and portfolio management content, applications, and services. The ESG and Climate segment includes providing data, ratings, research, and tools to help investors navigate increasing regulation, meet new client demands and better integrate ESG and climate elements into their investment processes. The All Other-Private Assets segment refers to the business intelligence products to real estate owners, managers, developers, and brokers. The company was founded by Andrew Thomas Rudd in 1998 and is headquartered in New York, NY.

Unlocking Profit Potential with MSCI Inc. (NYSE: MSCI)Unlocking Profit Potential with MSCI Inc. (NYSE: MSCI)
Today, I bring forth an opportunity that's been making waves in the financial world: MSCI Inc. (NYSE: MSCI). As an expert in market analysis, I strongly recommend considering due diligence in this global leader in data and software services for

MSCI Holds Earnings BreakoutMSCI rallied on strong earnings last month, and some investors may look for the gains to continue.
The first pattern on today’s chart is the bullish price gap on January 30 after profit and revenue beat estimates. The move established prices above the December 29 peak, which was the stock’s highest

MSCI.... A Sheep in Wolfe's (Waves) Clothing ???I am seeing a Wolfe Wave formation, breaking today. The target is in early March to around the $530 level. That would be an approximate 1/3 drop of MSCI's runup since late October.
Note this is a 65-minute chart view. MSCI's current beta is 1.13
Insert #1 is the last Wolfe Wave in late 2022, wit

$MSCI with a Bullish outlook following its earnings #Stocks The PEAD projected a bullish outlook for $MSCI after a positive under reaction following its earnings release placing the stock in drift A with an expected accuracy of 62.5%.

$MSCI with a Bullish outlook following its earnings #Stocks The PEAD projected a Bullish outlook for $MSCI after a Negative over reaction following its earnings release placing the stock in drift C with an expected accuracy of 55.56%.


MCSI looks so obviousThe MSCI All Country World Index (ACWI) is a stock index designed to track broad global equity-market performance.
Sometimes its better to just sit back and wait.

MSCIThe RSI is near zero on the daily timeframe. On a weekly basis, you can see the reaction from ema100 and large hidden divergences. With a risk, you can take a long one.

MSCI - Daily Global IndexLooking like it's been run over and left for dead along with the NYSE COMP.
Nothing Bullish here and no signs of any Bid anywhere.
It may well reject anything the Raven spouts off about this
week as Central Banks Globally are in the sweet spot of their
Long Con.
__________________________________
See all ideas
An aggregate view of professional's ratings.
Trade directly on the supercharts through our supported, fully-verified and user-reviewed brokers.


Curated watchlists where MSCI is featured.

Frequently Asked Questions
The current price of MSCI is 540.55 USD — it has increased by 0.43% in the past 24 hours. Watch MSCI Inc. stock price performance more closely on the chart.
Depending on the exchange, the stock ticker may vary. For instance, on NYSE exchange MSCI Inc. stocks are traded under the ticker MSCI.
MSCI stock has risen by 8.33% compared to the previous week, the month change is a 11.51% rise, over the last year MSCI Inc. has showed a 2.64% decrease.
We've gathered analysts' opinions on MSCI Inc. future price: according to them, MSCI price has a max estimate of 650.00 USD and a min estimate of 500.00 USD. Watch MSCI chart and read a more detailed MSCI Inc. stock forecast: see what analysts think of MSCI Inc. and suggest that you do with its stocks.
MSCI reached its all-time high on Nov 16, 2021 with the price of 679.85 USD, and its all-time low was 11.06 USD and was reached on Nov 20, 2008. View more price dynamics on MSCI chart.
See other stocks reaching their highest and lowest prices.
See other stocks reaching their highest and lowest prices.
MSCI stock is 2.47% volatile and has beta coefficient of 1.07. Track MSCI Inc. stock price on the chart and check out the list of the most volatile stocks — is MSCI Inc. there?
Today MSCI Inc. has the market capitalization of 42.33 B, it has increased by 8.34% over the last week.
Yes, you can track MSCI Inc. financials in yearly and quarterly reports right on TradingView.
MSCI Inc. is going to release the next earnings report on Oct 22, 2024. Keep track of upcoming events with our Earnings Calendar.
MSCI earnings for the last quarter are 3.64 USD per share, whereas the estimation was 3.55 USD resulting in a 2.47% surprise. The estimated earnings for the next quarter are 3.75 USD per share. See more details about MSCI Inc. earnings.
MSCI Inc. revenue for the last quarter amounts to 707.95 M USD, despite the estimated figure of 696.41 M USD. In the next quarter, revenue is expected to reach 712.70 M USD.
MSCI net income for the last quarter is 266.76 M USD, while the quarter before that showed 255.95 M USD of net income which accounts for 4.22% change. Track more MSCI Inc. financial stats to get the full picture.
Yes, MSCI dividends are paid quarterly. The last dividend per share was 1.60 USD. As of today, Dividend Yield (TTM)% is 1.11%. Tracking MSCI Inc. dividends might help you take more informed decisions.
MSCI Inc. dividend yield was 0.98% in 2023, and payout ratio reached 38.37%. The year before the numbers were 0.98% and 42.73% correspondingly. See high-dividend stocks and find more opportunities for your portfolio.
As of Jul 27, 2024, the company has 5.79 K employees. See our rating of the largest employees — is MSCI Inc. on this list?
EBITDA measures a company's operating performance, its growth signifies an improvement in the efficiency of a company. MSCI Inc. EBITDA is 1.64 B USD, and current EBITDA margin is 61.14%. See more stats in MSCI Inc. financial statements.
Like other stocks, MSCI shares are traded on stock exchanges, e.g. Nasdaq, Nyse, Euronext, and the easiest way to buy them is through an online stock broker. To do this, you need to open an account and follow a broker's procedures, then start trading. You can trade MSCI Inc. stock right from TradingView charts — choose your broker and connect to your account.
Investing in stocks requires a comprehensive research: you should carefully study all the available data, e.g. company's financials, related news, and its technical analysis. So MSCI Inc. technincal analysis shows the buy rating today, and its 1 week rating is strong buy. Since market conditions are prone to changes, it's worth looking a bit further into the future — according to the 1 month rating MSCI Inc. stock shows the buy signal. See more of MSCI Inc. technicals for a more comprehensive analysis.
If you're still not sure, try looking for inspiration in our curated watchlists.
If you're still not sure, try looking for inspiration in our curated watchlists.