Gold Selloff EOYGold has reached a critical resistance structure around $3,880-$3,895. As in recent post the target for Goldman Sachs was $3,700 with an exhaust level of $3,880. Even with government shutdown, I believe cryptos and coming crypto ETF’s (XRP) will become dominant in “safe haven” assets. The price of gold is extremely overbought and the greed is at an all time high.
My targets will sound outrageous. But we will possibly see gold get reckoned in the next two months into the next 2 years. The stable price of gold is below $2,100 and is sitting at a support area of $1,742. With an actual price liquidation zone at $1,572. This is simple physics and realism. Everything that goes up has to come down. This gold price not only reflects fear, but extreme greed. Actuality will set in soon.
-Goodluck, This is NFA
R2C
Shutdown

GBPCAD breakout or rejection? All eyes on 1.8850!GBPCAD is testing a major technical zone as macro and price catalysts align. Here's what traders need to know:
Catalysts & Macro Drivers
GBP : Supported by USD weakness (US shutdown, weak data), sticky UK inflation, and Bank of England caution. November’s UK budget looms as a key event.
CAD : Under pressure from falling oil prices (oversupply/weak demand) and a dovish Bank of Canada. Further rate cuts are possible, especially if oil stays low.
Technical Outlook
Weekly chart : Strong impulsive rally past 61.8% Fibonacci (1.8310), with 1.9490 (78.6% Fib) as the next longer-term upside target.
4h chart : Ascending triangle with resistance at 1.8850. Breakout/close above 1.8850 confirms bullish momentum, with targets at 1.90 and then 1.93–1.95.
RSI : Long-term RSI above 60 signals strength, but divergence is a risk factor. Watch for RSI reset or failure at highs.
Trading Scenarios
Bullish : Hold above 1.8850 for 3 sessions +, look for upside extension to 1.90/1.93/1.95.
Bearish : Failure to break 1.8850 or drop below 1.8600 could trigger reversal to 1.84/1.81 support.
Levels to Watch
Key resistance: 1.8850, 1.9000, 1.9340, 1.9490
Key support: 1.8600, 1.8400, 1.8310
This content is not directed to residents of the EU or UK. Any opinions, news, research, analyses, prices or other information contained on this website is provided as general market commentary and does not constitute investment advice. ThinkMarkets will not accept liability for any loss or damage including, without limitation, to any loss of profit which may arise directly or indirectly from use of or reliance on such information.

Can gold smash through $4,000 this month?Gold is edging closer to the psychological $4,000 mark after reaching as high as $3,890 per ounce.
The rally has been fuelled by two main drivers: an unexpected drop in US private employment and the start of the federal government shutdown. With the shutdown delaying key releases such as this week’s nonfarm payrolls and this month’s CPI, the Federal Reserve may be forced to decide policy at its October 29 meeting without critical data, increasing the chances they leave rates unchanged.
Technically, gold’s trend remains constructive. Strong demand zones potentially sit near $3,760 and $3,720, while the next key resistance is the $4,000 psychological level. A sustained daily close above $4,000 would open the way toward Fibonacci extension targets at $4,025 and $4,101. On the downside, a break below $3,760 could trigger a deeper pullback toward $3,680.

BTC Tests Range Highs Below 120k: Wait for Confirmation __________________________________________________________________________________
Market Overview
__________________________________________________________________________________
BTC is back at the top of its range, pressing 116.8k–117.97k just beneath the 120k barrier. Higher timeframes (12H/1D) lean bullish, while mid-TFs still push back — confirmation is key before chasing strength.
Momentum: 📈 Cautiously bullish; above 115.2k, a clean close >117.97k would likely unlock 120k.
Key levels: Resistances: 116.8k–117.97k; 120k; 124.3k. Supports: 115.2k; 114k; 112.4k–111.1k.
Volumes: Very high on 6H→30m (mostly under resistance), normal on 1D.
Multi-timeframe signals: 1D/12H Up; 6H/4H/2H Down; 1H/30m/15m Up.
Risk On / Risk Off Indicator context: NEUTRE VENTE — slight risk-off, contradicting daily momentum.
__________________________________________________________________________________
Trading Playbook
__________________________________________________________________________________
With range highs overhead, stay constructive but disciplined: lean cautiously bullish while 115.2k holds and wait for confirmed breaks to avoid traps.
Global bias: Cautious bullish while 115.2k holds; major invalidation on a 1D close <114k.
Opportunities:
• Pullback buy if 115.2k holds, then confirm >116.8k.
• Breakout long on 1D close >117.97k; add if 120k flips to support.
• Tactical sell on rejection at 116.8k–117.97k toward 115.2k then 114k.
Risk zones / invalidations: Loss of 115.2k opens 114k/112.4k; a 1D close >120.6k invalidates top-shorts.
Macro catalysts: Fed −25 bps (supports risk), potential US data timing shifts (ISM/NFP) that can cluster volatility, and positive BTC spot ETF flows (Day +$430M) reinforcing dips.
Action plan: Entry >117.97k (≥2 closes + retest) / Stop <115.8k / TP1 120k, TP2 122.5k, TP3 124.3k / R:R ~1.8–2.5.
__________________________________________________________________________________
Multi-Timeframe Insights
__________________________________________________________________________________
Higher timeframes point up, but mid-TF supply still caps price near the range highs; intraday strength needs follow-through to avoid bull traps.
1D/12H: Holding above 115.2k preserves upside bias; convert 117.97k to open 120k then 124.3k.
6H/4H/2H: Seller pressure below 116.8k–117.5k; beware fake breaks without volume follow-through.
1H/30m/15m: Impulsive bounce is constructive, but requires break/hold (≥2 bars) to confirm trend continuation.
__________________________________________________________________________________
Macro & On-Chain Drivers
__________________________________________________________________________________
A supportive macro backdrop and improving flows help, but timing risks keep volatility elevated around resistance.
Macro events: Fed easing (−25 bps) underpins risk appetite; shifting ISM/NFP timing may concentrate moves around data windows.
Bitcoin analysis: 114k–115.2k defended; highest quarterly close; weekly ETF inflows turned positive.
On-chain data: STH cost basis ~111k; ETF inflows resumed; recent deleveraging cleans positioning.
Expected impact: Slight bullish tilt if 115.2k holds and 117.97k flips to support; otherwise risk of 114k/112.4k retests.
__________________________________________________________________________________
Key Takeaways
__________________________________________________________________________________
BTC is pressing range highs with active supply below 120k. The cleaner long is a confirmed breakout >117.97k with 120k turning into support; otherwise, fading rejections back into 115.2k remains valid. Macro support (−25 bps + positive ETF flows) helps, but confirmation at resistance matters most. Stay patient and execute only on validated signals.

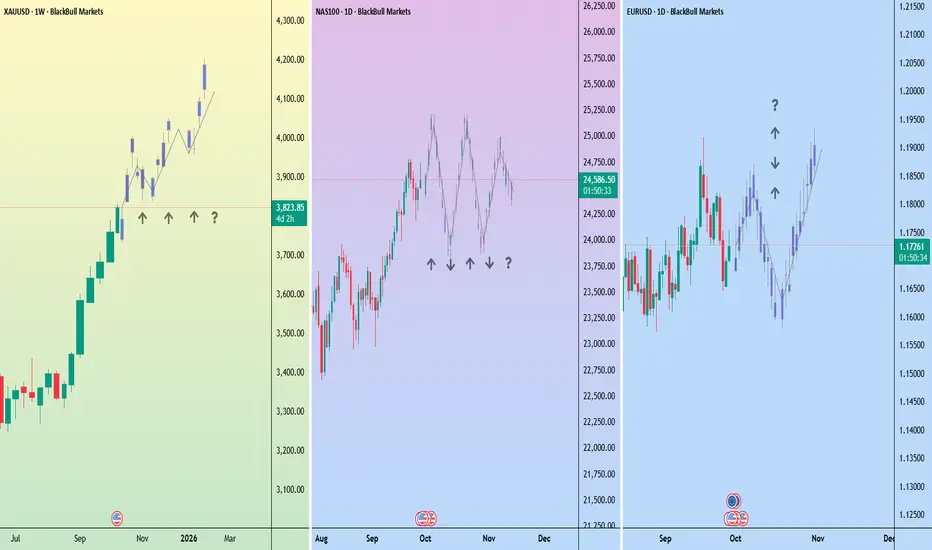
Positioning for a government shutdown: gold, Nasdaq 100, EURUSDUnless Congress can reach an agreement before 1 October, the federal government will shut down. The last major shutdown, during President Trump’s first term, lasted 34 days.
Markets are already weighing the risks of plummeting confidence in the US and its currency and disruptions to the release of important economic data. For traders, this can create volatility and opportunity across major asset classes.
Gold
Gold often benefits from political and fiscal uncertainty. If a shutdown occurs, safe-haven flows could push the metal higher.
Nasdaq 100
The Nasdaq 100 has been sensitive to swings in sentiment around government stability and interest rate expectations. A shutdown could amplify volatility. Traders should be mindful of potential gap moves at the weekly open if negotiations falter over the weekend.
EUR/USD
A shutdown that undermines confidence in U.S. fiscal management could weigh on the EUR/USD in the short term. However, Europe faces its own economic issues, potentially keeping the pair range-bound for now.
A Huge Technical Re-Test of This Important TL Has Just Occurred!Trading Family,
Tariff FUD is recking traders rn. After breaking important support which started in Nov. '24, I knew the SPY was in trouble. My first target down was 563. We hit that and broke it. My second target down was 550. We are there right now! Will it hold? I don't know. TBH, I don't think any analyst that is honest knows. Investors have never seen Tariffs levied like they have been recently by the Trump admin. Noone really knows how this is going to impact the current economy, which is now global (big diff from the last U.S. tariff econ in the late 1800's).
But I can say that this is a big support which is the neckline of our large long-term Cup and Handle pattern started all the way back in Jan. of 2022! We did have one retest already. Usually, this is all that is needed. But apparently, the market wants another. Though the support is strong, remember, every time it is tagged, it weakens. Thus, if it can't hold this current downturn, I suspect it will drop hard from here should it break, possibly dropping all the way to 460. Be prepared for this and watch your trendline closely!
On the other hand, if it holds, I see a huge bounce incoming! We'll probably then go all the way back up to test the underside of that support (red with two with lines) that we broke. Hold on to your hats! We are living in unprecedented times with unprecedented market volatility.
The last item to note is that, once again, this all seems to be occurring at the same time that U.S. congress and senate are voting on a continuing resolution. Correlation does not necessarily equal causation however, in this case, I would suggest that should a U.S. gov't shutdown occur, our support will break and down we'll go. Should a CR pass, big bounce incoming. Stay tuned and watch the news closely for this. It seems to be a news driven event.
✌️ Stew

What I Expect Through The New Year Absent A Government Shutdown.Traders, minus a government shutdown, I do expect another altcoin pump. However, the possibility of a shutdown is throwing a big wrench into my thesis. We'll talk about how price action would look in both scenarios as well as discuss the new crypto cycle rotation. You should get to know this new rotation to remain most successful in your trading.
As always, we'll start with the DXY, VIX, SPY, and NVDA and discuss future direction and what it means for our crypto space.

Republican-led shutdown: What's at Stake for the USD?? Republican-led shutdown: What's at Stake for the USD??
We are four days away from a potential partial government shutdown, and negotiations among lawmakers have yet to produce a resolution.
On Monday, Senate Majority Leader Chuck Schumer, Senate Minority Leader Mitch McConnell, House Speaker Mike Johnson, and House Minority Leader Hakeem Jeffries meet in the Oval Office with the president and vice president to negotiate the conditions to keep the government operational beyond March 1.
Senate Democrats have been expressing frustration, placing blame on House Republicans, particularly criticizing leader Mike Johnson, for the current impasse. Senator Jon Tester, a Montana Democrat, voiced displeasure, stating, "We're doing this every six months. This is bullsh*t.... we need to do what we were elected to do, fund the government, not shut it down," in an interview with CNN.
If no resolution is reached, a partial shutdown is set to commence at 12 a.m. on Saturday.
Notably, the last time the US government was on the precipice of a shutdown (Sept- Oct 2023), the USD kept strengthening against major partners like the Euro, with the USD being seen as a safe haven play.
But last year, there were a few other factors that could have been compounding this USD-buying activity, including the US interest-rate differential and comments from some Fed members making it clear that policy won’t be changing anytime soon. This time, it's maybe not as clear that there are as strong a set of factors pushing for a robust USD.

Christmas Crash, ReduxIn 2018 Congress failed to pass a budget and the US Gov't was shutdown. A monster dump ensued.
Now comes Congress unable even to elect a Speaker.
incompetence abounds. Expect the worst.
Trend is Down. Trend continues until the End at the Bend.

Bitcoin (BTC) technical and fundamental analysisThe price of Bitcoin has entered the 4-hour Imbalance zone, as we warned in all our recent ideas. Consequently, the price has broken above the global descending trendline and moved out of the previous price range. This BTC rally is associated with a significant accumulation of short positions, with the total volume of shorts reaching up to 85% compared to longs. During the upward impulse, short positions totaling over $100 million were liquidated.
Currently, we anticipate trading within the 4-hour Imbalance zone to fill gaps in horizontal trading volume levels. If the price fails to consolidate itself above the resistance block, it's likely go to correction of the recent upward impulse to the 0.61-0.78 Fibonacci levels. During this correction, it may also retest EMA50 and the descending trendline.
However, if buyers manage to maintain their strength and continue the upward movement, we anticipate a test of the next significant resistance block around the psychological level 30,000.
📉 Global view of the Bitcoin market
On the daily logarithmic chart, Bitcoin's price is testing the intersection of the 200-day and 200-week moving averages. If it consolidate above these moving averages, the next target for the upward movement could be a retest of the upward trendline above which lies the 1-week Imbalance zone. In this zone, gaps in horizontal trading volume levels need to be filled. However, to achieve this, buyers will need to overcome the significant resistance block at 30,000-32,000.
It's important to note that the RSI indicators on the 4-hour and 1-day timeframes are already entering the oversold territory, indicating a potential trend reversal on the horizon.
Additionally, it's worth remembering that the Bitcoin price has not yet fully played out the breakout from the bearish wedge pattern. Furthermore, there hasn't been a proper correction of the entire uptrend since the beginning of this year. These factors suggest that the market may still experience significant volatility and potential price movements in the near future. Traders should closely monitor these and be prepared for various scenarios.
Levels long positions:
23,000 - level of the cost zone control point (POC)
22,000 - 0.61 Fibonacci retracement level
20,000 - 0.78 Fibonacci retracement level
17000-19000 - Imbalance zone 1H
Levels for short positions:
29,000-30,000 - 0.78 Fibonacci retracement level
32 000-35000 - Imbalance zone 1W
36,000-38,000 - zone of possible retest of the trend line
40,000 - psychological resistance level
The index of fear and greed is in the neutral zone - 50.
The total capitalization of the cryptocurrency market increased to $1083 billion, and the Bitcoin dominance index increased to 50.53.
According to the analysis of the accumulation of large blocks in order books, the supply and demand zones are located at the following levels:
🟢 Demand zone: 20000 - 26000
🔴 Offer zone: 29000 - 32000
📊 Fundamental analysis
Historical data has shown that October has traditionally been a favorable month for Bitcoin price growth. Currently, there's an active hashtag campaign on social media called #Uptober, indicating optimism among cryptocurrency enthusiasts for a positive trend in October.
Large investors continue to accumulate Bitcoin. According to on-chain analysis, addresses holding between 10 and 10,000 BTC are accumulating coins. This suggests that institutional investors remain bullish on Bitcoin.
In the world of U.S. politics, a compromise bill was passed, preventing a government shutdown at least until November 17th. This news has provided support to all risk asset markets, including cryptocurrencies.
The American stock market initially responded to this news with a slight upward impulse in the S&P500 index, but it was later overshadowed by a decline. Meanwhile, the U.S. Dollar Index (DXY) continues to rise. These factors highlight the dynamic and interconnected nature of the financial markets, with political developments, institutional interest, and seasonal patterns all playing a role in influencing market sentiment and asset prices.
🌐 Upcoming macroeconomic events
The following dates are expected to bring increased volatility in both the stock and cryptocurrency markets:
➤ October 3rd at 17:00 - Job Openings and Labor Turnover Survey (JOLTS) data for August.
➤ October 12th at 15:30 - U.S. Consumer Price Index (CPI).
➤ November 1st at 21:00 - New Federal Reserve interest rate decision.

⚡️ Gov SHUTDOWN?! Market will tank?! What to do in this case? ⚠️⚡️Some shutdown insights with chart:
Chart shows longest shutdown: 12/22/18 - 1/25/19
The fear factor has always been PRE-shutdown. Not DURING or POST-shutdown.
⚡️ That means what?
If we shutdown, we may dip say 2-3%.
But what happens during shutdown?
You'd be surprised market actually RECOVERS during shutdown. BY A LOT.
During the shutdown in 2018-2019, the market recovered the ENTIRE DIP, whole +15%.
That's the same thing that happened in 2013. The market rose 3% during shutdown.
⚡️ So is shutdown really bad for markets?
No. Only shutdown fears really cause a dramatic effect BEFORE it happens.
Remember the psychology of "priced in". Once a shutdown happens and market reacts for a day or 2, it's priced in.
⚡️ But why?
After the shutdown happens, anything is good news.
If they announce a deal, that's good news.
If they vote, that's good news.
Thus, market does well during shutdowns.
Good luck. 🙂
AMEX:SPY NASDAQ:QQQ NASDAQ:TSLA NASDAQ:AAPL AMEX:DIA

USDJPY Short? BoJ Intervention and US Gov Shutdown RisksOn Monday, the USDJPY dollar hit an 11-month peak, a move triggered by the Federal Reserve's recent signaling of another potential interest rate hike and an intention to maintain higher rates for longer.
Then, (counter to expectations) the yen faced pressure when the Bank of Japan, on the preceding Friday, decided to maintain its ultra-low interest rates and its commitment to support the economy until sustainable inflation reaches its 2% target. This decision indicated that the central bank was in no hurry to phase out its extensive stimulus program. Traders had been looking for some kind of hint as to when the BoJ would start to dial back its support. Wishful thinking, I guess.
The Japanese yen is currently hovering near the 150 mark, a level some traders consider critical to prompt intervention by Japanese authorities, similar to actions taken last year.
But can the USDJPY even reach 150 with a potential US shutdown on the horizon?
Starting on October 1, hundreds of thousands of US government workers face furloughs if Congress fails to pass a funding bill. The House is set to reconvene after last week's recess, aiming to continue budget negotiations.
If a federal government shutdown occurs, the publication of crucial US economic data, such as employment and inflation report vital for policymakers and traders, will be indefinitely suspended too.
So maybe the downside risk is ever-present even without the threat of BoJ intervention? 145.164 is the immediate support that might fall to the bears. 138.312 is the next target, but can a US government shutdown force the price down to this level over one day like an intervention might? Maybe this level is an intermediate term risk rather than short term?


Daily Crypto Update - This 1 news story may be influencing priceIn this video:
* I discuss what the crypto market might be waiting for
* On Monday, we must observe the stock market's reaction to this news item
* The stock market's reaction and confluent price action will likely spill over into the crypto market

BTC's Possible Double-TOP ⚠️ 🐻 ⚠️Hi everyone 👋🏽
🕊 Wish y'all have a profitable lifestyle 🍀
📌 BITCOIN /USDT H:4 Chart - Heiken-ashi
📌 PRICE ACTION - Fibbo - Double-Top
📍 Bitcoin may create a double-top after filling the first target of bullish-flag
✍🏼 Straight to the point, Bitcoin may create a possible double-top in H:4 and daily time-frame which can lead the price again to the 44-45k zone
✍🏼 After the vast internet shutdown and failure of centralized plat-forms such as Facebook , WhatsApp and Instagram; Bitcoin and other crypto currencies pumped big in just less than a day.
⚠️ However, from technical-analysis point of view I am just concerned about a double top at 53k price zone.
✍🏼 If the scenario 1 fails, of course BTC is going to see the 57-58k price zone more easily than everyone thinks.
⚠️ RSI in H:4 looks so much in overbought position; more than 80-85 RSI is such a dangerous zone.
LINK OF MY BULLISH-FLAG TA IS AVAILABLE BELOW, PLEASE CHECK IT OUT
THIS IS NOT A FINANCIAL ADVICE, IT IS JUST MY OPINION

US Markets to See Big PullbackWe've been on quite the bullrun this year. I think it's time to go short.
Technically:
For the first time this year, we have fallen below the 50ema on the Daily and failed to recover above it. We normally recover same day or next but its been 6 trading days below the 50ema. We made a lower low in June which signaled a sign of weakness in the uptrend. Now we are again making another low below August 19th low. I think its time we retest some support levels.
Fundamentally:
- Fed has talked about tapering and possibly raising rates buy EOY/early next year
- Covid Delta variant is on the rise, raising fear in multiple countries
- US Congress has not yet voted on the Federal Budget and will most likely go into a Government Shutdown next month.
- China cracking down on Tech + Evergrande 300b default is likely to make some waves globally
Levels to watch:
- ~34000 (July Low)
- ~33200 (May High, June Low, 200 ema)
- ~31200 (New year consolidation range)
- ~29600 (Pre-covid High, Feb Low)

COVER SHUTDOWN(5th Sept 2021) Cover Protocol will be shut down following the sudden departure of the core developers.
BINANCE:COVERETH For more information please read: defited.medium.com
BINANCE:COVERBUSD OKEX:COVERUSDT SUSHISWAP:COVERWETH

Overproduction, greed and a lack of shippingThis is a production chart and the last of my economic charts. I want to take a second to think back to 2020 here. The world shut down, when it reopened the Suez Canal got blocked, shipping is still no where near recovered. The rich are pulling PMs off the Comex as a silver squeeze happened, and a lack of shipping on top of this and scalpers lead to SO MUCH tech not being available. Is till can't get a new GPU or PS5 AT ALL. then you had massive food issues, droughts, oil pipeline attacks in America and the middle east, incompetent world leaders and fighting between nations and soooooo much more. It's of no surprise to me that bond investors my be getting spooked, on the other hand, with great risk comes the potential for great reward. Just something to think about the next time you order fast food and find only one person working 60+ orders or order something from amazon and find it got lost in that black hole never to be seen until you get on their case.
My next charts will be a few TA on some of my favorite crypto, MEME coins and stocks and what I have been looking at for trades afterwards

It's cold in the US and EU 🥶! 1 year covid crash anniversary.The market prices info in a few days or weeks before it happens (not surprises obviously - only politicians trade those see Nancy Pelosi and Tesla for reference, as well as Hilary Clinton making 10 million percent or something on cattle futures making her the greatest trader of all time).
If there is no advantage to predicting things when they are being talked about by decision makers, 10 days before they are announced, we have to predict it even earlier! Before the clueless decision makers even talk about it.
We speculate on what speculators are going to speculate in the future.
So, obviously this MAY happen.
Last time there was a covid surge everything dropped to the ground 📉.
And so I'm not sure how viruses work, well no one knows honestly, lots of ignorant journalists THINK they do but they know the least of them all.
But what I saw is that states and countries in the north or far south (Argentina etc) generally had more deaths than those closer to the equator.
What is happening is that since the Biden inauguration - just stating a fact, not speculating on why this is the case chill - the US & EU have relaxed their covid measures.
And it is getting so cold, all of a sudden, it's hard for bodies to adapt, plus colder places have more deaths.
And funny thing is the states that took less restrictive measures, and who for now have less deaths than surrounding states with economic shutdown, are located in areas that are going to get cold 🌨️🌨️🌨️.
So what may happen is this:
1- The cold might lead to a spike in deaths
2- Oklahoma, Texas, Arkansas, and more, will get hit hard, and people that "take covid seriously" and paranoid people will tell them "told you so" and push for an economic shutdown, Biden has already signed dozens of executive orders so he might sign a few others what difference does it make at that point?
3- France that said "ok for now we are not restricting your liberties more, restaurants might re-open" will now say "hey it's getting worse so let's do like we did last year", the UK that already got hit hard with "their" variant (less severe BUT more contagious) will get hit even harder and so it will go into complete panic mode, spread fear to Europe and the US, lots of decisions will be taken in hindsight AFTER the worse is over (which will confirm in their eyes the measures are efficient 🤦♂️)
4- Markets will crash
5- Typical confirmation bias & anchoring bias & neglect of probability & oversimplification tendency & all the trading bias: If clueless politicians keep taking hindsight decisions AFTER cases & death waves it will always look like it was efficient and stopped the spread, good luck to the 150+ IQ top scientists explaining them that, way too subtle for the average voter to understand, so you already know this will be the dogma and become a recurring thing.
Since I mentioned biases, this is the list 😀:
Taken from here: www.magellangroup.com.au
Good article
I'm already short Bitcoin, and I'm getting ready to exit my Tech100 long if things go south.

Analysis GJ Basic StructureHello traders, GJ is going back up to the top after coming from retesting from the support. The effect was from the Government shutdown from last week due market decrease. Thank you for reading!


100 YEARS OF GLOBAL CRISES, PANDEMIA, RECESSION and DEPRESSIONHere is the modern 100 years history of Human Being. Starting from WW1-Depression-WW2-ColdWar-DotComBubble-FinancialCrisis-COVID
Will the history repeats again with Crash and Recovery?
On chart I pointed with 1&2 phases of history is from 1915 to 2001 and from 2001 to current.
Chart as image:
1. The Great Depression, World War II, Cold War, Dot Com Bubble
The Great Depression began in the United States after a significant drop in stock prices, which began around September 4, 1929, and became world news after the stock market crash on October 29, 1929 (known as Black Tuesday). Between 1929 and 1932, global gross domestic product (GDP) declined by about 15%. In comparison, global GDP fell by less than 1% from 2008 to 2009 during the Financial Crisis. Some economies began to recover by the mid-30s. However, in many countries, the negative effects of the Great Depression continued until the outbreak of World War II.
The Great Depression had devastating consequences in both rich and poor countries. Personal income, tax revenue, profits and prices fell, and international trade fell by more than 50%. Unemployment in the United States rose to 23%, and in some countries rose to 33%.
Cities around the world have been hit hard, especially those that depend on heavy industry. Construction was virtually halted in many countries. Agricultural communities and rural areas suffered as crop prices fell by about 60%. Faced with a sharp drop in demand with several alternative sources of jobs, the most affected areas are those dependent on primary sector industries such as mining and logging.
What stocks survived the Great Depression?
Electric Boat Company gained +55,000% from 1932 to 1954, topping this interesting list of the top-10 performing Great Depression Stocks.
Electric Boat (Defense; +55,000% Return) ...
Truax Traer Coal (Coal; +30,503%) ...
Spicer Manufacturing (Auto; +26,221%) ...
Zenith Radio (Radios, Televisions; +24,146%)
World War II , also called Second World War, conflict that involved virtually every part of the world during the years 1939–45. The principal belligerents were the Axis powers—Germany, Italy, and Japan—and the Allies—France, Great Britain, the United States, the Soviet Union, and, to a lesser extent, China. The war was in many respects a continuation, after an uneasy 20-year hiatus, of the disputes left unsettled by World War I. The 40,000,000–50,000,000 deaths incurred in World War II make it the bloodiest conflict, as well as the largest war, in history.
Cold War , the open yet restricted rivalry that developed after World War II between the United States and the Soviet Union and their respective allies. The Cold War was waged on political, economic, and propaganda fronts and had only limited recourse to weapons.
The result in 1989 was a wave of revolutions that (with the exception of Romania) peacefully overthrew all of the communist governments of Central and Eastern Europe. The Communist Party of the Soviet Union itself lost control in the Soviet Union and was banned following an abortive coup attempt in August 1991.
The dot-com bubble (also known as the dot-com boom, the tech bubble, and the Internet bubble) was a stock market bubble caused by excessive speculation in Internet-related companies in the late 1990s, a period of massive growth in the use and adoption of the Internet.
There are various ways to measure the amount of wealth that was annihilated when the bubble burst. As early as November 2000, CNNFN pegged the losses at $1.7 trillion
What companies survived the dot com bubble?
Here are some companies which survived the dot-com bubble.
Amazon (NASDAQ: AMZN) +45000% Return since 2001
eBay (NASDAQ: EBAY) +1700% return
Apple (NASDAQ: APPL) +36000% return
2. The Financial Crisis of 2007–08, COVID-19 recession, the Great Shutdown
Financial crisis of 2007–08 , also called subprime mortgage crisis, severe contraction of liquidity in global financial markets that originated in the United States as a result of the collapse of the U.S. housing market. It threatened to destroy the international financial system; caused the failure (or near-failure) of several major investment and commercial banks, mortgage lenders, insurance companies, and savings and loan associations; and precipitated the Great Recession (2007–09), the worst economic downturn since the Great Depression (1929–c. 1939).
The U.S. government then came out with National Economic Stabilization Act of 2008, which created a corpus of $700 billion to purchase distressed assets, especially mortgage-backed securities. Different governments came out with their versions of bailout packages, government guarantees and outright nationalization.
The financial crisis of 2007-08 has taught us that the confidence of the financial market, once shattered, can't be quickly restored. In an interconnected world, a seeming liquidity crisis can very quickly turn into a solvency crisis for financial institutions, a balance of payment crisis for sovereign countries and a full-blown crisis of confidence for the entire world. But the silver lining is that, after every crisis in the past, markets have come out strong to forge new beginnings with some kind of turnaround. A small selection of investors even profited from the crisis.
The coronavirus recession, also known as the COVID-19 recession, the Great Shutdown, or the Great Lockdown , is a major global recession which arose as an economic consequence of the ongoing COVID-19 pandemic. The first major sign of the coronavirus recession was the 2020 stock market crash on 20 February, and the International Monetary Fund (IMF) reported on 14 April that all of the G7 nations had already entered or were entering into a "deep recession" and that there had already been a significant slowdown of growth in emerging economies. IMF projections suggest that the coronavirus recession will be the most severe global economic downturn since the Great Depression, and that it will be "far worse" than the Great Recession of 2009.
The pandemic has led to more than a third of the world's population being placed on lockdown to stop the spread of COVID-19. It has caused severe repercussions for economies across the world, following soon after a global economic slowdown during 2019 that saw stagnation of stock markets and consumer activity worldwide.
This recession has seen unusually high and rapid increases in unemployment in many countries, and the inability in the United States for state-funded unemployment insurance computer systems and processes to keep up with applications. The United Nations (UN) predicted in April 2020 that global unemployment will wipe out 6.7 per cent of working hours globally in the second quarter of 2020—equivalent to 195 million full-time workers. In western nations, unemployment is expected to be at around 10%, with more severely affected nations from the COVID-19 pandemic having higher unemployment rates. The developing world is also being affected by a drop in remittances.
The recession saw a drop in the price of oil triggered by the 2020 Russia–Saudi Arabia oil price war, the collapse of tourism, the hospitality industry, the energy industry and a significant downturn in consumer activity in comparison to the previous decade. Global stock markets crashed around 20 to 30% during late February and March 2020, respectively. During the crash, global stock markets made unprecedented and volatile swings, mainly due to extreme uncertainty in the markets.
👉 So many people claiming for next crisis/recession and global shit to happen, but:
👉 General question, are you really want this to happen?
Stay profitable
this is Artem Crypto

BITCOIN APRIL UPDATEDo you like Coins? Do you like Bitcoins? Do you like Gains, maybe even sick gainz?
Then I welcome you to this April update!
I expect to visit 8600 area, to continue a bear motivated sideways trend, until we retest the latest low of 3600! Maybe we will bounce, go sideways and climb up again- or maybe we will bounce, restest the already weakened support of 3600 and dip lower...But important: 8600 area, the go down and see at least a 5 as the first number of the BTC price!
We are discussing the current situation of Bitcoin in the perspective of the global economy, but also not missing on Technical Analysis!
I hope you enjoy this one, I was thinking about getting more into major world indexes and making like all-around summary videos about the world economy and/or specific stocks and assets? What do you think, let me know in the commentary section or simply DM me,
best,
you german quality trader
