It could be an Head & Shoulders insteadIt could be an Head & Shoulders instead of a Bullish Shark Pattern.
Let's see.
Sidewayconsolidation

Bullish Shark Pattern on NZDUSD M15 ChartI love trading sideways consolidation breakout trades, but since I missed the initial move, I've been patiently waiting for a retest. Now, an even better opportunity has presented itself!
What's Happening?
- Bullish Shark Pattern : A Bullish Shark Pattern is forming on the M15 (15-minute) chart at 0.6046 on the NZDUSD.
Why is this Exciting?
- Combo Trade Management : This setup allows for a combination of strategies that can significantly reduce initial risk while increasing potential returns.
How to Approach This Trade?
1. Wait for Confirmation : I'll be waiting for a Magic Candle Confirmation at the pattern completion point before entering the trade.
2. Risk Management : Include our stop-loss buffer just below the pattern completion to manage risk effectively.
3. Potential Upside : With the pattern forming and the potential retest, this setup could offer a great risk-to-reward ratio.
Final Thoughts
Sometimes, missing an initial trade isn't a setback but an opportunity to find an even better setup. Patience pays off! 🎯
What’s your take on this NZDUSD setup? Have you spotted similar opportunities? Share your thoughts and let's discuss!
Happy trading, everyone! 🚀

IOLCP Showing Change in Structure can go towards 52 Week HighNSE:IOLCP
......................................................................................................................
......................................................................................................................
The Company’s turnover
increased to ₹ 2,133 crore in
FY24 from ₹ 983 crore in FY18
at a CAGR of 13.77%
......................................................................................................................
......................................................................................................................
The share of regulated
market sale has increased
to ₹ 300 crore in FY24 from
₹100 crore in FY18
......................................................................................................................
......................................................................................................................
Increased contribution
of non-Ibuprofen drugs
from ₹35 crore in FY18
to ₹431 crore in FY24,
showing a steady upward
trend over the years
......................................................................................................................
......................................................................................................................
Added more than 10
products since 2017 in
APIs and chemical segments.
The Company has
recently commenced a new
plant of Acetic Anhydride
......................................................................................................................
......................................................................................................................
• The Indian API market is expected to grow at a
CAGR of 13.7% over the four years.
• India hosts 500 API manufacturers, contributing
approximately 8% to the global API Industry.
• As the largest supplier of generic medicines,
India manufactures around 60,000 different
generic brands across 60 therapeutic categories.
• In FY24 India saw a 4.12% increase in the total
imports of bulk drugs and intermediates,
amounting to ₹ 37,721.88 crore, compared to ₹
36,229.15 crore in FY23.
• Indian medicines are preferred worldwide due to
their combination of low price and high quality,
earning India the title of "pharmacy of the
world."
......................................................................................................................
......................................................................................................................
Positive factors
• Strongly improving operating performance, resulting in growth of more than 15% in total operating income and sustained
EBIDTA margin of more than 20%, on a sustained.
• Diversifying product portfolio and reducing dependency on its main product Ibuprofen and ethyl acetate to below 65% in the
overall revenue.
• Improving total debt to gross cash accruals (TD/GCA) and TD to profit before interest, lease rentals, depreciation, and taxation
(TD/PBILDT) to below unity.
......................................................................................................................
......................................................................................................................
Established market position and diversified product offering
The company was incorporated, 1986 with the commencement of business in chemical segment.
In 2000, the company started
production of Ibuprofen.
IOLCPL is one of the largest manufacturers of Ibuprofen with significant global share and the company
is backward integrated for manufacturing Ibuprofen.
IOLCPL has a market presence across more than 50 countries with sales
contribution from exports forming around 28% of total sales in FY24 (PY: 29%).
The company’s overseas customers are spread
across Switzerland, Bangladesh, Spain, Indonesia, Hungary, United Kingdom, Nepal, China, Turkey and Japan, among others.
The company is one of the largest manufacturers of Ibuprofen (capacity of 12000 MTPA) and has the second largest manufacturing
capacity (12000MTPA) for Iso Butyl Benzene (key raw material for Ibuprofen)

GBPUSD Breakout and Bullish Shark Pattern!I hope you’re all doing well and staying sharp in the markets. I wanted to share an interesting setup I’ve been eyeing on GBPUSD that could be a great opportunity for both new and experienced traders alike.
What’s Happening?
- Weekly Chart:
- GBPUSD has finally broken out from its sideways consolidation, which is super exciting! This breakout could mean we’re in for some upward action.
The Plan:
On the 1-hourly chart, I’ve spotted a Bullish Shark Pattern. This pattern is a fantastic tool for identifying potential buying opportunities.
- Key Level: 1.2873
- What to Do: I’m waiting for a “Magic Candle Confirmation” at this level. This confirmation will give me the green light to enter a long position.
Why This Setup is Cool:
- Breakout: The breakout on the weekly chart signals a possible trend change, which is a big deal!
- Bullish Shark Pattern: This pattern helps us pinpoint a precise entry, making our trading plan more reliable.
How to Trade It:
1. Wait for Confirmation: Don’t rush! Wait for the Magic Candle to form at 1.2873.
2. Set Your Stop-Loss: Place it just below the pattern completion level to manage risk.
Final Thoughts:
Trading can be tricky, but by using patterns and waiting for confirmations, we can make more informed decisions. Keep learning and stay patient. Good things come to those who wait (and plan well)!
What do you think about this setup? Do you have any insights or questions? Drop a comment below and let’s discuss!
Happy trading, everyone! 🚀

About The FX Crash & Cash IndicatorThe FX Cash & Crash Breakout indicator is a powerful Forex trading indicator on TradingView. Crash (consolidation or ranging market) and Cash (breakout from consolidation into a long or short trade).
It uses Heikin Ashi candle bars in combination with real price on the hourly chart to smooth price fluctuations and identify early range-bound price action breakouts. Consecutive gray bars indicate a crash move into a sideways market. A breakout occurs when it goes from a sideways market to either either green or red bars indicating the opportunity to cash in on a trending short or long market opportunity. While primarily designed for intraday trading, it can also be utilized for swing trading. It's crucial to use strict trading discipline, gain basic knowledge of trading practices, and focus on risk management. This indicator was created to enhance your marketing strategy.

GBPUSD Sideways Consolidation and Potential Breakout MovesGBPUSD is currently in a sideways consolidation on the 1-hourly chart, presenting a potential for an expansion move or breakout in the coming week. Should the market break out to the upside, there are two potential shorting opportunities to consider.
Analysis:
- Sideways Consolidation: GBPUSD is in a range-bound phase on the 1-hourly chart.
- Potential Breakout: Watch for an expansion move.
Shorting Opportunities:
Traditional Resistance Level:
- Level: 1.2662
Strategy: Look for Magic Candle Confirmation around this resistance level to enter a short position.
Bearish Gartley Pattern:
- Completion Level: 1.2677
- Strategy: Monitor for the Bearish Gartley pattern completion and confirm with bearish signals to enter a short position.
Strategy:
- Monitor Breakout: Pay close attention to the price action for a breakout, should the market breakout to the upside, there are 2 resistance level you have to take note.
Shorting Levels:
- 1.2662: Traditional resistance level.
- 1.2677: Bearish Gartley pattern completion.
- Confirmation: Ensure to look for confirmation signals (such as bearish candlestick patterns or other technical indicators) before entering a short position.
- Risk Management: Use appropriate stop-loss levels to manage risk, and not risking more than 1% of your equity.
- Stay alert and be ready to act on these potential setups. What’s your take on GBPUSD?
Do you see any other potential setups or insights? Share your thoughts and strategies below!

GBPUSD Sideways Consolidation with Potential Upside BreakoutTimeframe : Weekly and 4-Hourly Charts
Predicted Move : Potential Upside Breakout
Analysis :
On the weekly chart, GBPUSD is currently in a sideways consolidation phase. Although the pair is near the top of this range, there seems to be a tendency for the market to break towards the upside. This observation is based on my 18 years of trading experience and intuition.
Key Points :
- Sideways Consolidation : GBPUSD is trading within a defined range on the weekly chart.
- Near Top of Range : Price is approaching the upper boundary of the consolidation.
- Potential Upside Breakout : Market tendencies suggest a possible break to the upside.
- Trading Experience : This analysis is supported by my 18 years of trading experience and gut feeling.
Strategy:
- Retest and Buying Opportunity : If you share my perspective, I'm looking for a retest within the buy zone on the 4-hourly chart at 1.2666 for a buying opportunity.
- Understanding the Buy Zone : It may seem like the buy zone has been broken, but with professional chart reading, it's evident it hasn't.
Note: This analysis is based on my personal trading experience and should not be followed blindly. Always conduct your own research and analysis before making any trading decisions.
Stay cautious and trade wisely!

EURUSD Sideways Consolidation with Key Levels for TradingTimeframe : Weekly and 1-Hourly Charts
Predicted Move: Sideways Consolidation with Specific Levels for Trading Opportunities
Analysis :
On the weekly chart, EURUSD is in a sideways consolidation phase and is currently at the bottom of this range. For precise entry points, I'll be closely monitoring the 1-hourly chart.
Key Points:
- Sideways Consolidation : EURUSD is consolidating within a defined range on the weekly chart.
- Bottom of Range : Price is at the lower boundary of the consolidation, suggesting potential buying opportunities.
Key Levels on 1-Hourly Chart:
- Shorting Opportunity : 1.0739 is my preferred level for considering short positions.
- Buying Opportunity : 1.0668 is my preferred level for considering long positions.
Strategy:
- Monitor Key Levels : Watch the price action around 1.0739 for shorting and 1.0668 for buying opportunities.
- Confirmation : Look for confirmation signals on the 1-hourly chart before entering trades.
Discussion:
Potential for Parity: The question of whether EURUSD might hit parity again is intriguing. While the current consolidation phase doesn't indicate an immediate move to parity, significant macroeconomic events or shifts in market sentiment could drive the pair towards parity. It’s essential to stay updated on fundamental factors and market news that could impact EURUSD.
Note: This analysis is based on my trading experience. Always conduct your own research and analysis before making any trading decisions.
What’s your take on EURUSD? Do you see the potential for it to hit parity again? Share your thoughts!

EURUSD Analysis: Multi-Timeframe Shorting OpportunityHere’s a detailed look at the EURUSD across multiple timeframes:
Weekly Chart:
- The market is in a sideways consolidation phase.
- The upper trendline has been respected, indicating a potential downside movement.
Daily Chart:
- Watch for a retest of the Fib-3 Bat Pattern, which could offer a prime shorting opportunity.
1-Hourly Chart:
- I’m eyeing a retest of the resistance at 1.0863 for a shorting opportunity.
What’s your trade plan for EURUSD? Comment down below and share your insights!
Happy trading!

EURUSD: A Sideway Consolidation with Bearish SignalsEURUSD is currently showing a sideway consolidation on the weekly chart, but the daily chart is painting a different picture:
- Bearish Fib-3 Bat pattern with RSI Divergence
I'm eyeing two potential entry points on the 1-hourly chart:
1. Resistance retest at 1.0852
2. Type 2 retest of the Bearish Bat Pattern at 1.0879
What's your take on this setup? Share your trade plans and thoughts in the comments!

EURUSD Analysis: Strategic Approach in Volatility PhaseOn the Weekly Chart, this looks like a regular day strolling down the road of simple support and resistance trading.
This is when new traders got it all wrong!
On the Weekly Chart, sideway consolidation occurred. When sideway consolidation happens, market expansion, known as a volatility increase phase, will definitely follow.
From what we had, at this moment, I'll be more inclined to take a buying opportunity at 1.0842 on the 1-hourly chart than to short at 1.0852.
Of course, this is not a sure thing; always plan and follow your trade plan.

Sideways Setup on GoldHere is a classic set it and forget it trade for any sideways market.
Just remember to take a small risk and only trade this strategy in a sideways market.
I have this entire strategy written out with step by step instructions.
Click the link in my profile and I will send it to you.
Enjoy!
Chris Juliano
TrendCloud Trading

Best Strategy For Trading Gold! Whenever you see Gold in a sideways pattern its always best to use this winning strategy.
TrendCloud can be use specifically as a tool to trade any sideways pattern.
If you want the full details and free mini course on how to trade gold then click the link in my profile for immediate access.
Use this strategy this month and let me know how it worked for you.

Open to OpportunitiesEURUSD maintains a Weaker Bull Trading setup on the Weekly Chart.
This week, I'm flexible and ready to engage any compelling trading setup.
Eyeing the 1-hourly chart, I'm particularly interested in a sideway consolidation trade, anticipating the completion of a Bullish Gartley Pattern.
What's your take on EURUSD? Any specific strategies in mind? Share your thoughts!

A definite move on BitcoinOften not, traders love to say that the market goes Up or Down. That's the movement of the market but what will definitely happen on market is that it will go through the expansion and contraction phases and when the market goes into contraction, the expansion will be next.
As a trader, I will be waiting for a break and close BEYOND the trendline, but as a Bitcoin collector, now could be a time you can consider buying some in case the market moves against your wish. However, in a 51% scenario, BTC is most likely to have its first break towards the downside, but I won't bet on this.
It depends on your capital and your mindset. Are you okay with missing this and waiting for the next setup(that's me), or do you want to buy some due to FOMO(I used to be that way).
So when I'm caught in such a dilemma, I will buy one-third of whatever I'd set aside for this and the remaining two-third for future purchases.
What will you be doing?

We could have an opportunity to earn BIGIf you have been reading my analysis, you would know that I have my eyes on NZDJPY and waiting to long it to the completion of the Head and Shoulders formation that completes at 86.23.
Previously, I was waiting for the completion of the Bullish Bat Pattern, which I knew chances were slim(links within the TradingView post).
Now, another opportunity presents itself. The better way is the wait for a retest on the 1-hourly chart at 83.65 and wait for a Double Bottom with an RSI Divergence before engaging the buy; should the market go above the red line and close above 84.26, I would wait for a retest and recent support to long NZDJPY.

EURUSD-Weekly Market Analysis-Oct22,Wk3Do you agree that the simplest analysis is often the toughest to spot?
I'm looking for shorting opportunity on the red dotted line and buying opportunity on the blue dotted line.
This is 1 of the classic chart pattern and 1 of my favourite that I've been trading for the past 17years.

USDJPY-Weekly Market Analysis-Jun22,Wk1USDJPY, a sideway consolidation best present itself as a trading opportunity, in order for the break to happen on the upside, the candlestick has to break and close above 127.25. Towards the downside is much easier, provided there isn't any candlestick wick danging like what we saw on the current chart.
Sideway consolidation is my favourite breakout setup.

USDCAD - Bearish BatUSDCAD is in a sideway movement. Harmonic Pattern traders could wait for a trading opportunity at 1.2818 on the emerging Bearish Bat Pattern.

1711 Sidways before new leg up USDCAD will break 1.2700Hello traders,
USDCAD is still on the bullish trend on daily chart.
On 6h chart, looking for sideways before new leg to bull again to break fibo 1.27 1.27000.
For last idea, USDCAD did not go that low to make a double bottom. Buyers are likely to push price up again this week.
RISK LOWER THAN YOUR TOLERANCE:
Suggested Risk <5%
Your Real Entry Position Will Make Different RR for Your Trade.
GOOD LUCK!!!
LESS IS MORE!

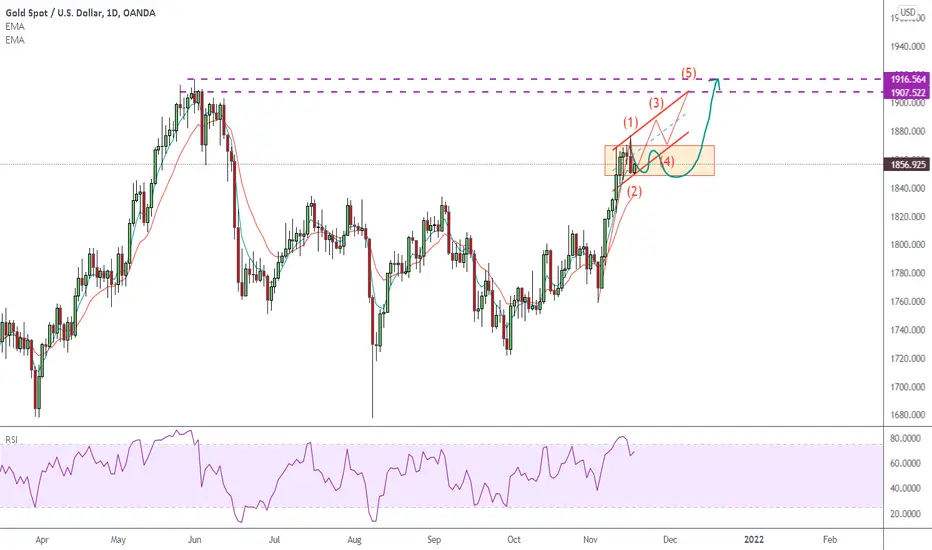
1711 How GOLD to continue its uptrend to 1900-1911?Hello traders,
GOLD is facing two ways to reach 1900-1911 zone on daily chart.
It would go sideways inside the red rectangle to consolidate before new leg up to test new high.
Or
it would continue to rise in a rough way insidw a flat red channel till it hit the 1900-1911 zone.
Both ways would need you to setup in a lower timeframe chart .
The correction idea in my last idea is not valid anymore with new price action.
RISK LOWER THAN YOUR TOLERANCE:
Suggested Risk <5%
Your Real Entry Position Will Make Different RR for Your Trade.
GOOD LUCK!!!
LESS IS MORE!
Hidden range, Similar movementBtc needs to cool down and have a rest for a period of time. New Ath is possible after some up and down movements similar to the one on September Crash.
Let’s see what happens.

EURJPY - Bullish Gartley PatternThe Deep Bullish Gartley Pattern on the 4-hourly chart happens to complete at the same level as the Deep Gartley Pattern on the daily chart. If you had missed the 1st trading opportunity, this might be a second chance to engage in the trade on this counter-trend setup.
For trend traders, there is a red slanted line, and that is known as the trendline. It was the same trendline you can see from the link within the tradingview post below, resulting after the market has broken and closed below the sideways consolidation.
