Gold breaks above structure, bulls eye 4,320$Hello, Traders! It's Leo. Are you following XAUUSD?
Chart Analysis:
Price continues to respect the ascending structure, showing steady bullish pressure.
Breakout Confirmation: The breakout above 4,060$ marks a shift from consolidation to trend continuation.
Targets: Next resistance sits at 4,320$, with 4,080$–4,040$ acting as the new demand zone.
Softer U.S. yields and weaker Dollar tone ahead of key CPI data are helping bulls regain traction, keeping price biased toward 4,320$.
💬 Share your view in the comments — are you watching for continuation or a pullback setup?
(Gold gains ground as traders await U.S. inflation data this week)
Signals

Is gold about to return to a bullish trend?On Monday, the US dollar index remained below the 100 level as signs that the US government might resume operations boosted market risk sentiment.
Spot gold rebounded sharply, surging over $100 intraday and returning above $4100, reaching a new high in over two weeks.
So far, gold has reached a high near $4150.
Looking at the hourly chart:
The two most crucial support levels for gold are currently around 4120-4115 and the $4000 level.
The 4120-4115 level coincides with the hourly moving average (MA20), and 4115 is also the opening price today. Therefore, if it holds above this level, gold is likely to maintain a consolidation and upward trend today.
Secondly, there's the $4000 level, which is the hourly MA30. It's possible that the price might break through the MA20 and directly reach the MA30.
Therefore, I think it's best to wait until at least 4120-4115 before considering long positions.
If the price breaks through the morning high of 4150, it may continue to reach the high near 4180.

SOLANA entered into bearish territory, targeting $105.Solana (SOLUSD) closed last week below its 1W MA50 (blue trend-line) for the first time since July 28 2025. This is an extension of the downtrend that started following the September 15 High, which took place right below the Resistance Zone that started back on the November 2021 Cycle Top.
This is a critical Resistance as it rejected the price another 2 times during this Bull Cycle, with the most recent causing the January - April correction to the 1W MA200 (orange trend-line).
Given the huge 1W RSI Bearish Divergence for almost 2 years now (Lower Highs), we expect last week's closing below the 1W MA50 to initiate the bearish extension towards the 1W MA200 (at least) again. Our Target is $105.00.
---
** Please LIKE 👍, FOLLOW ✅, SHARE 🙌 and COMMENT ✍ if you enjoy this idea! Also share your ideas and charts in the comments section below! This is best way to keep it relevant, support us, keep the content here free and allow the idea to reach as many people as possible. **
---
💸💸💸💸💸💸
👇 👇 👇 👇 👇 👇

SILVER Will Go Down! Short!
Here is our detailed technical review for SILVER.
Time Frame: 9h
Current Trend: Bearish
Sentiment: Overbought (based on 7-period RSI)
Forecast: Bearish
The market is testing a major horizontal structure 5,097.6.
Taking into consideration the structure & trend analysis, I believe that the market will reach 4,922.1 level soon.
P.S
We determine oversold/overbought condition with RSI indicator.
When it drops below 30 - the market is considered to be oversold.
When it bounces above 70 - the market is considered to be overbought.
Like and subscribe and comment my ideas if you enjoy them!

USDCHF Is Very Bullish! Buy!
Here is our detailed technical review for USDCHF.
Time Frame: 4h
Current Trend: Bullish
Sentiment: Oversold (based on 7-period RSI)
Forecast: Bullish
The market is on a crucial zone of demand 0.803.
The oversold market condition in a combination with key structure gives us a relatively strong bullish signal with goal 0.807 level.
P.S
The term oversold refers to a condition where an asset has traded lower in price and has the potential for a price bounce.
Overbought refers to market scenarios where the instrument is traded considerably higher than its fair value. Overvaluation is caused by market sentiments when there is positive news.
Like and subscribe and comment my ideas if you enjoy them!

GBP/JPY Rejection at Resistance – Potential Drop AheadOn the GBP/JPY 15-minute chart, the price has reacted strongly from the resistance zone around 202.95. If the market fails to break and hold above this level, we could see a bearish move toward the support zone around 201.02. A break below that level could open the way toward 199.50. Watching for a clear confirmation before entering a sell setup. Trading with patience and discipline is key.

XAU/USD: Rally Tests 4,155 as Pullback Risk BuildsXAU/USD extended its rally after breaking out of the range zone, now testing a confluence area near 4,155 within resistance. The structure forms a steep upward channel, with signs of short-term exhaustion near the upper boundary.
If price fails to hold above 4,150, a pullback toward 4,065–4,000 may follow. While the broader trend remains bullish, momentum appears stretched, hinting at a pause before continuation.
❗️ Risks:
– Break above 4,150 could extend gains to 4,220.
– Soft U.S. inflation may weaken USD and lift gold.
– Geopolitical tension could boost safe-haven flows, limiting downside.

EUR/USD Rejection at Resistance Bearish Move AheadPrice rejected the 1.1550–1.1590 resistance zone and failed to hold support. If momentum continues, a drop toward 1.1500 looks likely. Watching for bearish confirmation on lower timeframes.

GOLD surpasses $4,140/ounce, signaling a new cycleOANDA:XAUUSD continued to climb in the Asian session on November 11, trading around $4,148/ounce, up $32 in the morning alone, after rising nearly 3% in the previous session. The two-day rally, the strongest since May, reflects the defensive sentiment of global investors in the face of a weakening US economic outlook and the possibility of the Federal Reserve (Fed) soon shifting monetary policy.
Bloomberg said gold maintained its gains after the US Senate approved a bipartisan deal to end the longest government shutdown in history, supported by President Donald Trump. The bill is expected to pass the House of Representatives this week by a 60-40 vote, paving the way for the resumption of work for hundreds of thousands of federal workers and stalled food aid.
The political situation has eased somewhat, but investors remain cautious. The reopening of the government means that a slew of delayed economic data will soon be released, which could shed more light on the growth picture. Bloomberg analysts said the upcoming data “are likely to show a worsening economic outlook,” reinforcing expectations for a Fed rate cut sooner than expected.
The probability of a 25 basis point cut in December is now above 65%, according to CME's FedWatch tool. Falling bond yields and a weak dollar have pushed money back into gold, the traditional safe haven, especially as the global rate-hike cycle ends and US fiscal risks emerge.
In the international market, gold is still up more than 50% since the beginning of the year, despite a short-term correction last month. Net buying from central banks, especially in Asia and the Middle East, and increased physical gold investment in the private sector, continue to be the core drivers for the prolonged bull cycle.
Commentary: Gold’s Return as a Barometer of US Economic Confidence
Gold’s November rally was more than a short-term political response. It reflected a deeper shift in global market sentiment: that the US dollar is losing its primacy amid rising debt, fiscal spending and domestic political divisions.
While U.S. stock markets hover around historic highs, institutional investors are beginning to rebalance their portfolios in a defensive direction, increasing their exposure to precious metals and government bonds. At the same time, central banks in China, India and Turkey continue to accumulate gold, a move that makes both financial and geopolitical sense, as they seek to reduce their dependence on the dollar payment system.
If the Fed does ease later in the year, gold could consolidate above $4,000 an ounce as a new price level, while risk assets face correction pressure. In an era where U.S. financial stability is no longer a given, the precious metal is returning to its old role as a gauge of confidence in the U.S. currency and government.
Technical analysis OANDA:XAUUSD
Gold prices are consolidating above the $3,970–$3,850/oz support zone, after bouncing back from the 0.382 Fibonacci line ($3,972) and remaining within the rising price channel (channel a) formed since July. The price structure suggests that a correction has been completed, as the recovery in buying pressure pushed the price above the short-term MA around $4,055, towards the 0.236 Fibonacci level at $4,128, which is currently a key short-term resistance zone.
The RSI has recovered from the 40 zone to near 60, indicating a return of bullish momentum, while recent daily candles have all closed above the medium-term uptrend line. A firm close above $4,130 could confirm the bullish trend, opening a new bullish cycle with the next target at $4,216, and further to the $4,380/oz zone, the upper end of the current price channel. Conversely, a loss of $3,940 would weaken the bullish structure and send gold back to the $3,850–$3,870 accumulation zone.
• Observation:
Gold is showing signs of forming a new base above the $4,000 area, reinforcing the scenario of a medium-term bullish cycle if it breaks the $4,130 resistance. Short-term profit-taking pressure may appear, but the main trend is currently leaning positive in the second half of November.
SELL XAUUSD PRICE 4180 - 4178⚡️
↠↠ Stop Loss 4184
→Take Profit 1 4172
↨
→Take Profit 2 4166
BUY XAUUSD PRICE 4088 - 4090⚡️
↠↠ Stop Loss 4084
→Take Profit 1 4096
↨
→Take Profit 2 4102

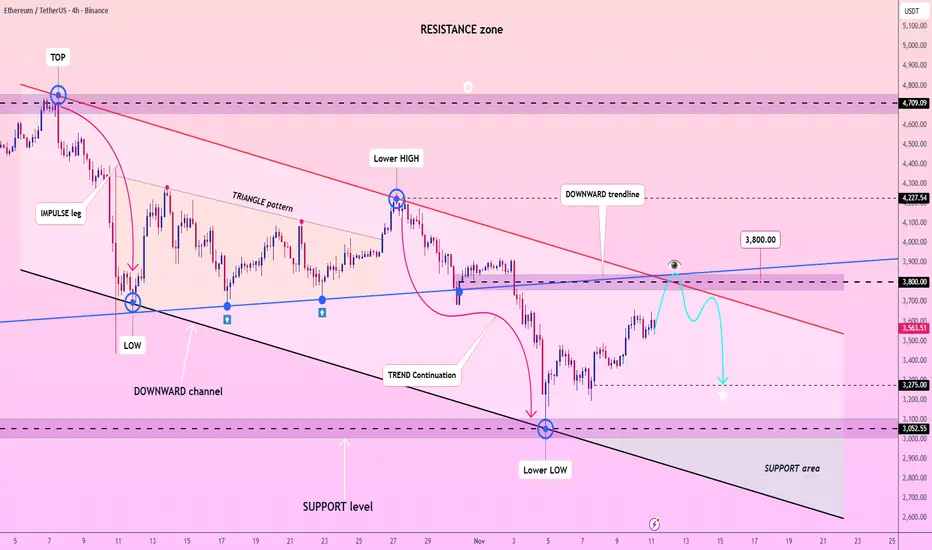
Lingrid | ETHUSDT Pullback Sell Downside ExtensionBINANCE:ETHUSDT is approaching the $3,800 resistance after testing the lower boundary of the downward channel. The market structure forms a clear lower-high sequence beneath a descending trendline, confirming the persistence of bearish pressure. As long as the price remains below $3,800 and inside the channel, bearish movement toward the $3,275–$3,100 support area remains likely. This corrective phase reflects a broader continuation of the bearish trend that began near the $4,700 resistance zone.
⚠️ Risks:
A break above $3,800 could invalidate the bearish setup.
Softer U.S. inflation data could weaken the dollar and lift crypto sentiment.
Unexpected strength in Ethereum network activity may trigger a rebound rally.
If this idea resonates with you or you have your own opinion, traders, hit the comments. I’m excited to read your thoughts!
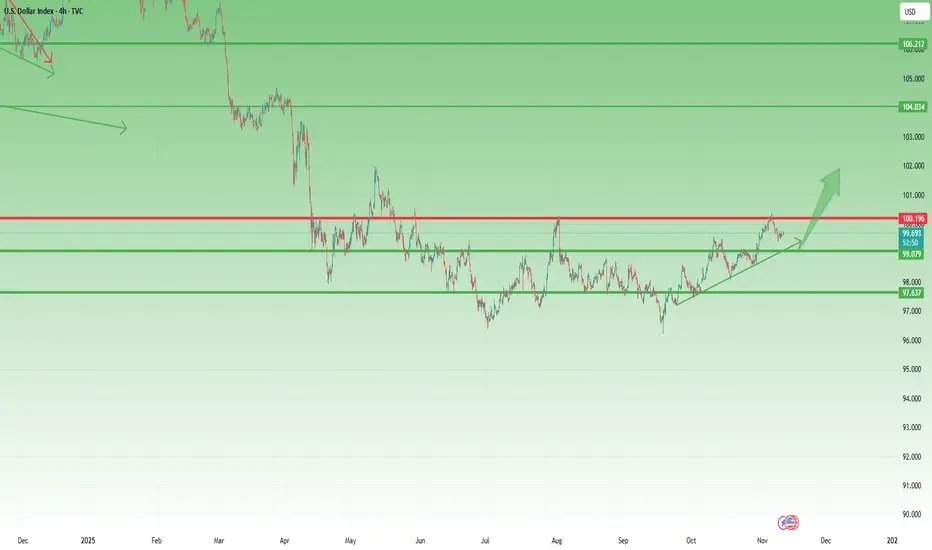
DXY Pulls Back from 100 – A Healthy Correction, Not a Reversal1. What Happened Since Last Week
In last week’s DXY analysis, I warned that although the U.S. Dollar Index remains in a broader uptrend, the 100.00 level represents both a strong technical and psychological resistance that could trigger a short-term retracement.
That scenario played out almost perfectly — after a brief spike above 100, DXY rolled over and is now trading near 99.70.
2. Market Context
The pullback so far looks orderly, not impulsive, suggesting that this move is a correction within an ongoing bullish structure, rather than the start of a major reversal. The market is simply digesting gains after a move higher.
3. Technical Outlook
The area between 99.00 and 99.20 stands out as a key confluence support zone, combining horizontal structure with the up trend line. This is where I expect buyers to reemerge if the index continues to drift lower.
4. Trading Plan
If DXY dips into 99.00–99.20, I’ll look for signs of USD strength resuming — specifically by considering short setups on GBP/USD and EUR/USD.
5. Conclusion
The dollar remains in an uptrend, and this pullback appears to be healthy, not bearish. As long as DXY holds above 99.00, the broader bullish bias remains intact, and traders should prepare for a possible rebound in the next sessions. 💵
Silver Builds Momentum: Break Above 49.50 in Sight1. What Happened Recently
After rebounding from the 45.50 recent low, Silver rallied strongly into the 49.30–49.50 resistance zone, where it faced short-term selling pressure. A healthy correction followed, taking price back to the 47.00 support area.
2. Market Reaction
From that zone, bulls stepped back in. Since Wednesday last week, the market has been climbing in a constructive and steady manner, suggesting that the correction phase might be complete.
3. Technical Outlook
At the time of writing, Silver is attempting to break above the 49.30–49.50 resistance. If successful, this move could trigger a continuation toward the 50.50 zone, which represents the next meaningful resistance on the chart.
The broader structure remains bullish as long as price stays above 48.00, while dips below 49.00 offer good buying opportunities within the trend.
4. Trading Plan
My preferred approach is to buy dips under 49, with a protective invalidation under 48. First profit targets lie near 50.50, with potential extensions if momentum persists.
5. Conclusion
Momentum has shifted firmly back in favor of the bulls. As long as 48 holds, Silver remains in a bullish phase, and buying dips is the rational play. ⚡️

Gold Finally Moves —Breakout Above 4020 Signals Bullish Momentum1. What Happened Last Week
Gold has spent most of last week consolidating in a narrow range 3960 and 4020, with only a short-lived downside spike on Wednesday. This range reflected market indecision , as traders waited for a clearer direction.
2. What’s Happening Now
The Asian session open this week brought the first meaningful breakout in days — price moved decisively above 4020 resistance and is now holding around the 4050 zone. This is the first clean bullish signal after multiple failed attempts last week.
3. Technical Outlook
From a technical perspective, the breakout opens room for an upside continuation. The next major target for buyers stands around the 4150 resistance.
As long as the 4000 level remains intact, bulls retain full control. That zone now acts as the line in the sand for short-term momentum.
4. Trading Plan
My plan is to buy dips near support and targets near 4150.
If the market closes back below 4000, the bullish bias would weaken, signaling a potential false breakout.
5. Conclusion
Gold has finally chosen direction — and as long as we stay above 4k, buying dips remains the smart play. The next few sessions will confirm if bulls have the strength to push toward 4150. 🚀

EUR/USD at the Edge: Bounce Before Breakdown?🧩 Macro & COT Context
(Note: data frozen as of September 23 due to CFTC shutdown)
The latest available COT report showed non-commercial traders still net long on EUR (≈ +114K contracts), but with a steady increase in both commercial longs (+4.9K) and commercial shorts (+3.3K) — signaling a more balanced positioning. Meanwhile, the USD Index showed a slight pickup in long exposure (+1.5K), hinting at a gradual shift toward USD strength until updated data resumes.
💭 Sentiment
Retail traders are 67% short vs 33% long, a typical contrarian setup where the crowd is selling the pullback. This supports a short-term bullish bounce, but only until the next supply zone is reached.
📈 Seasonality
Historically, November has been a neutral-to-bearish month for EUR/USD (-0.0021 on 20Y average; -0.0063 on 10Y). The pair tends to weaken during the second half of the month, before recovering into December.
📊 Technical Structure (Daily Chart)
Price remains inside a descending channel since late September, recently retesting the upper boundary and supply area at 1.1570–1.1710, where a clean rejection formed.
RSI holds below the midline (~45), confirming weak momentum.
The overall structure stays bearish, with room for continuation toward the 1.1380–1.1400 demand zone, aligning with both channel projection and liquidity targets.
Main Bias: Short continuation
Sell Zone: 1.1570–1.1620 (upper channel + supply)
Target 1: 1.1400
Target 2: 1.1350 (weekly liquidity pool)
Invalidation: Daily close above 1.1715
Summary
📊 COT (last update): EUR still net long → neutral bias until new data
📉 Seasonality: Historically weak November
📈 Sentiment: Retail short → short-term bullish bounce possible
🧭 Technical Bias: Bearish below 1.1715

EURGBP FREE SIGNAL|LONG|
✅EURGBP formed a clean liquidity sweep below the equal lows, tapping into a defined demand block before showing displacement to the upside. Targeting the imbalance left behind by impulsive selling.
—————————
Entry: 0.8770
Stop Loss: 0.8762
Take Profit: 0.8785
Time Frame: 2H
—————————
LONG🚀
✅Like and subscribe to never miss a new idea!✅

SILVER Strong Supply Area Ahead! Sell!
Hello,Traders!
SILVER tapped into a major supply zone, where liquidity above previous highs got engineered for smart money entries. The structure suggests a bearish continuation toward the next target zone. Time Frame 5H.
Sell!
Comment and subscribe to help us grow!
Check out other forecasts below too!
Disclosure: I am part of Trade Nation's Influencer program and receive a monthly fee for using their TradingView charts in my analysis.

USD-CHF Free Signal! Sell!
Hello,Traders!
USDCHF is retracing from a horizontal supply area after internal liquidity sweep. Smart money traders may look for a bearish continuation toward 0.8017 as liquidity below equal lows gets targeted.
---------------------
Stop Loss: 0.8077
Take Profit: 0.8017
Entry: 0.8048
Time Frame: 5H
---------------------
Sell!
Comment and subscribe to help us grow!
Check out other forecasts below too!
Disclosure: I am part of Trade Nation's Influencer program and receive a monthly fee for using their TradingView charts in my analysis.

META entering Bear Cycle territory.Meta Platforms (META) has been on a steady decline since its August All Time High (ATH) that is lately accelerating. The reason the breaking below its 1W MA50 (blue trend-line) last week for the first time since April 2025. That was the time that the market formed the bottom of the Tariff War Crisis.
The key characteristic here (and most worrisome) is the Huge Bearish Divergence of the 1W RSI (Lower Highs) against the price's Higher Highs since February 2024. This indicates a loss of strength for the bullish trend and potential reversal.
The same kind of RSI Bearish Divergence was seen in 2017 - 2018, leading to the eventual July 2018 market Top and strong multi-month correction to the 0.236 Fibonacci retracement level that found Support exactly on the 1W MA250 (red trend-line).
Just like then, the stock price has reached now the top of its historic Channel Up, the pattern that has been trading within since its IPO and only broke once marginally at the bottom of the 2022 Inflation Crisis.
As a result, given the strong similarities between the two fractals, META may be entering a Bear Cycle (since the 1W MA50 break) that could last for about a year. Our 0.236 Fibonacci Target is $480.
---
** Please LIKE 👍, FOLLOW ✅, SHARE 🙌 and COMMENT ✍ if you enjoy this idea! Also share your ideas and charts in the comments section below! This is best way to keep it relevant, support us, keep the content here free and allow the idea to reach as many people as possible. **
---
💸💸💸💸💸💸
👇 👇 👇 👇 👇 👇

SILVER WILL KEEP GROWING|LONG|
✅SILVER is rallying from a refined demand zone, showing bullish orderflow continuation. With liquidity swept below previous lows, institutions may target the next imbalance near $51.00. Time Frame 3H.
LONG🚀
✅Like and subscribe to never miss a new idea!✅

BTCUSDT.P - November 11, 2025BTCUSDT.P is showing potential for a short-term bullish reversal after rebounding from the $100,238–$100,616 support zone. A buy limit is positioned near $100,983, targeting a move toward the $112,833 partial profit zone and the $121,599 profit level. A confirmed breakdown below the $94,111–$98,115 stop zone would invalidate this bullish setup and indicate renewed downside momentum.
Risk Assessment: Moderate — Price action suggests early bullish recovery signs, but confirmation depends on holding above $100,900 and sustaining momentum past $112,800.

CAD-CHF Short From Supply Area! Sell!
Hello,Traders!
CADCHF is reacting from a premium supply zone where liquidity was previously engineered. Expect a short-term drop toward the next demand imbalance as smart money rebalances the range.Time Frame 5H.
Sell!
Comment and subscribe to help us grow!
Check out other forecasts below too!
Disclosure: I am part of Trade Nation's Influencer program and receive a monthly fee for using their TradingView charts in my analysis.

GBPCHF LOCAL SHORT|
✅GBPCHF is tapping into a clear supply level after an inefficient move upward. Institutional traders may look to rebalance the range by driving price toward the liquidity resting below 1.0590. Time Frame 3H.
SHORT🔥
✅Like and subscribe to never miss a new idea!✅

GBP-NZD Bullish Bias! Buy!
Hello,Traders!
GBPNZD has retested a bullish demand zone after breaking structure to the upside. Smart money may engineer a deeper pullback before pushing toward the next liquidity pool above. Time Frame 3H.
Buy!
Comment and subscribe to help us grow!
Check out other forecasts below too!
Disclosure: I am part of Trade Nation's Influencer program and receive a monthly fee for using their TradingView charts in my analysis.
