EURNZD LONG FROM TRENDLINE|
✅EURNZD is approaching the rising trendline after a clean liquidity sweep beneath the prior low, but hasn’t reacted yet. Expect algorithmic buying to step in once we tap the discounted zone, setting up a push toward the higher buy-side liquidity.Time Frame 3H.
LONG🚀
✅Like and subscribe to never miss a new idea!✅
Signals

Bitcoin Drops Sharply – Is This Bounce Only Temporary?Hello everyone, Bitcoin continues to show weakness on the 4H chart: the bearish structure remains intact, with overlapping red FVGs above and nearly every rebound being rejected quickly. After the sharp fall from the 100,000 USD region, the price is now hovering around 85,000 USD — a level that clearly reflects persistent selling pressure.
Digging deeper into the technicals, BTC remains below the Ichimoku cloud and under several unfilled FVG zones, especially the 87,500–89,000 USD region. This forms a “lower ceiling” where any upward attempt is met with immediate selling pressure. Volume also leans heavily toward the sellers, reinforcing the view that the short-term trend is still firmly bearish. Just beneath the price, the 84,500–84,000 USD area is acting as temporary support; it’s also the nearest liquidity pocket, suggesting a technical rebound may occur.
The broader environment is not helping Bitcoin either. The USD has strengthened following a series of stronger-than-expected US economic reports, from employment data to Big Tech performance. This has pulled capital away from risk assets. US equities continue to attract speculative money, while the Fed has yet to provide any clear signal about rate cuts. Market sentiment isn’t extremely risk-off, but it is discouraging enough to limit Bitcoin’s chances of staging a meaningful reversal.
With all these factors combined, I lean toward one main scenario: Bitcoin may see a technical rebound toward the 87,000–88,000 USD region, where the nearest FVG and an unfinished supply–demand balance lie. However, I still expect this bounce to act merely as a liquidity-grab move before BTC faces renewed selling pressure and revisits the 84,000–82,500 USD zone.
What do you think — is this rebound just a trap before the next leg down?

GBP-AUD Local Short! Sell!
Hello,Traders!
GBPAUD swept the supply-zone highs in a classic liquidity grab, reclaiming the range and signalling distribution. If bearish order flow holds, price may rotate toward the unmitigated demand below. Time Frame 5H.
Sell!
Comment and subscribe to help us grow!
Check out other forecasts below too!
Disclosure: I am part of Trade Nation's Influencer program and receive a monthly fee for using their TradingView charts in my analysis.

BTCUSDT.P - November 24, 2025Bitcoin recently formed a short-term ascending channel, showing improving momentum after a strong prior selloff. Price is currently consolidating near 86,900, with key support at 85,900 and 84,400, and resistance at 88,100 and 91,900. A breakout above 88,100 would signal additional bullish momentum toward 91,900, while any failure to hold above the rising trendline could trigger a retest of lower support levels. The current structure suggests neutral to slightly bullish momentum in the immediate term.

USDCHF WILL KEEP GROWING|LONG|
✅USDCHF taps the demand block and shows displacement, suggesting bullish order-flow returning after liquidity sweep beneath the short-term low. Expect a corrective pullback into the imbalance before targeting the higher buy-side liquidity. Time Frame 1H.
LONG🚀
✅Like and subscribe to never miss a new idea!✅

GOLD MARKET ANALYSIS AND COMMENTARY - [Nov 24 - Nov 28]This week, the international OANDA:XAUUSD price continued to hold above the support level of 4,000 USD/oz, but the risk of price decline is increasing due to geopolitical tensions and expectations that the FED will cut interest rates at the December meeting is not enough to create a strong rebound for gold prices.
The gold price next week may continue to fluctuate in a narrow range, waiting for US economic data to clarify the FED's interest rate reduction roadmap.
Retail sales and producer price index (PPI) reports, along with other data due next week, could help us get a better idea of the US economic situation. If the US economic data is below expectations, it could increase expectations for a Fed rate cut in December, pushing gold back above $4,100/oz next week. However, if these data continue to reduce expectations for a Fed rate cut, gold could break the important support level of $4,000/oz next week, opening the door to $3,845-$3,800/oz.
However, in the long term, gold prices are still expected to continue to rise as central banks continue to buy, although the pace of buying may slow down due to the high gold price. Moreover, gold has proven its value, even when compared to other stores of value such as cryptocurrencies, due to the sharp decline of bitcoin and many other cryptocurrencies. Therefore, the appeal of gold is still very large and has no rivals in the financial investment environment.
📌Technically, on the H4 chart, an important support level is established around the 4,000 USD/oz threshold. If this level is broken, the gold price is at risk of falling deeply to 3,900 or even 3,850 USD/oz. In case the gold price forms a double bottom pattern at 4,000 and breaks through the 4,132 resistance level, there is a chance to recover above the 4,200 USD/oz threshold.
SELL XAUUSD PRICE 4176 - 4174⚡️
↠↠ Stop Loss 4180
BUY XAUUSD PRICE 3964 - 3966⚡️
↠↠ Stop Loss 3960

NZD-JPY Local Long! Buy!
Hello,Traders!
NZDJPY tapped the discount zone inside horizontal demand after sweeping liquidity, signalling accumulation. If bullish order-flow sustains, expect a repricing toward the premium buy-side target above. Time Frame 3H.
Buy!
Comment and subscribe to help us grow!
Check out other forecasts below too!
Disclosure: I am part of Trade Nation's Influencer program and receive a monthly fee for using their TradingView charts in my analysis.

CADJPY DEMAND LEVEL AHEAD|LONG|
✅CADJPY is pulling into the higher-timeframe demand after clearing sell-side liquidity, setting up a bullish reaction. If displacement confirms, algos may reprice toward the next buy-side liquidity target above. Time Frame 10H.
LONG🚀
✅Like and subscribe to never miss a new idea!✅

USD-JPY Bearish Breakout! Sell!
Hello,Traders!
USDJPY broke down from the horizontal supply, leaving clear signs of distribution. A corrective pullback into the zone may precede continuation toward the next sell-side liquidity level below.Time Frame 1H.
Sell!
Comment and subscribe to help us grow!
Check out other forecasts below too!
Disclosure: I am part of Trade Nation's Influencer program and receive a monthly fee for using their TradingView charts in my analysis.

AUDUSD Is Very Bearish! Sell!
Here is our detailed technical review for AUDUSD.
Time Frame: 4h
Current Trend: Bearish
Sentiment: Overbought (based on 7-period RSI)
Forecast: Bearish
The market is testing a major horizontal structure 0.645.
Taking into consideration the structure & trend analysis, I believe that the market will reach 0.641 level soon.
P.S
We determine oversold/overbought condition with RSI indicator.
When it drops below 30 - the market is considered to be oversold.
When it bounces above 70 - the market is considered to be overbought.
Like and subscribe and comment my ideas if you enjoy them!

GBPAUD Is Going Down! Short!
Take a look at our analysis for GBPAUD.
Time Frame: 6h
Current Trend: Bearish
Sentiment: Overbought (based on 7-period RSI)
Forecast: Bearish
The market is approaching a key horizontal level 2.033.
Considering the today's price action, probabilities will be high to see a movement to 2.022.
P.S
Overbought describes a period of time where there has been a significant and consistent upward move in price over a period of time without much pullback.
Like and subscribe and comment my ideas if you enjoy them!

XAU/USD ANALYSIS 11/25/20251. Fundamental Analysis:
a) Economy:
• USD:
The USD is slightly weakening due to expectations that the FED will keep rates unchanged and may deliver more dovish signals in speeches this week.
• U.S. Stocks:
Wall Street inched higher last night, with the market leaning toward a risk-on sentiment, which usually weighs on gold. However, the gains were not strong → gold is not under heavy pressure.
• FED:
The FED continues to emphasize a “data-dependent” stance, but the market is starting to believe in the possibility of rate cuts in the coming months. This supports gold in the medium term.
• TRUMP Administration:
The new administration prioritizes economic recovery, deregulation, and tax cuts → which may stimulate the stock market, but geopolitical risks still linger → gold benefits whenever volatility rises.
• Gold ETF (SPDR):
SPDR has been buying and selling alternately with no clear trend. However, recent selling volume is not large → no major bearish pressure on gold. On Nov 24, the fund bought 0.29 tons—small, likely probing while waiting for upcoming news and market reactions.
b) Politics:
Tensions in the Middle East remain unresolved; additionally, U.S.–China trade competition still holds the potential for new conflicts → gold maintains its safe-haven appeal.
c) Market Sentiment:
The market is slightly risk-on, but within a narrow range and lacking strong momentum → reversal risks are always present.
The “waiting for FED this week” sentiment makes gold move more technically.
2. Technical Analysis:
The 30-minute timeframe gives extremely clear signals:
• Price has broken above the descending trendline extending from the Nov 17 high.
• A new uptrend (short- to medium-term) is forming.
• Extended targets if momentum holds: 4,244 – 4,276.
• RSI is in the mid-high zone but not overbought → still room for upside.
• MA20 has crossed above MA50 nicely, supporting the bullish trend.
Overall: Gold is likely retesting the breakout and continuing the upward trend.
RESISTANCE: 4,193 – 4,244 – 4,276
SUPPORT: 4,096 – 4,040 – 4,029 – 4,000
3. Previous Market Session:
• Gold surged strongly from the 4,040 zone, breaking the descending trendline and the ascending triangle.
• Price closed above all short-term EMAs → buying pressure dominates.
• Volume increased during the breakout → confirming the trend.
4. Strategy for Today (Nov 25, 2025):
🪙 SELL XAUUSD | 4195 – 4193
SL: 4199
TP1: 4187
TP2: 4181
🪙 BUY XAUUSD | 4084 – 4086
SL: 4080
TP1: 4092
TP2: 4098

XAUUSD continues to rise after the Adam & Eve patternOANDA:XAUUSD is really interesting right now. The price seems likely to rise further after the formation of the Adam & Eve pattern. With such an easy-to-remember name, the Adam & Eve pattern is one of the most memorable. I will explain below the reasons and how to recognize it easily.
The Adam pattern is characterized by a sharp drop, followed by a quick recovery, forming a "V" on the chart. High, sharp, and aggressive! One could say it's more "masculine."
On the other hand, the Eve pattern develops more slowly. The price becomes more rounded, forming a wider and smoother base before rising again, creating a shape similar to the letter "U." Softer, more curved, and more "feminine."
Combining these two elements gives us the Adam & Eve pattern, which often signals a potential trend reversal. Especially when accompanied by fundamental analysis or other strong technical indicators.
This pattern will stick in your mind when you connect its shapes to the male and female aspects. A pattern that is truly hard to forget.

Latest Gold Update Today!Hey traders,
As we kick off this new week, XAUUSD is holding steady, hovering around the 4,050-dollar level with barely any noticeable volatility.
This calm price action comes as the market keeps a close eye on what the Federal Reserve plans to do next. More and more participants are expecting the Fed to shift toward a more dovish stance and potentially move closer to a rate cut by the end of the year. With bond yields slipping, the dollar gradually losing strength, and safe-haven demand picking back up, gold is getting a solid foundation for a possible short-term push higher.
From a technical standpoint, XAUUSD is tightening inside a triangle pattern — a classic setup that usually signals accumulation before a stronger impulsive move. If price manages to break above the upper boundary, the next target could stretch toward the 4,500-dollar region, supported by the strength of the previous bullish leg.
From my perspective, market sentiment is slowly leaning toward the buyers, especially if upcoming U.S. data continues to ease pressure on gold.
What about you? How do you see things playing out? Are you expecting more upside, or do you think a correction is coming?
Wishing you a smooth, confident, and profitable trading week ahead.

ZS Zscaler Options Ahead of EarningsIf you haven`t bought ZS before the rally:
Now analyzing the options chain and the chart patterns of ZS Zscaler prior to the earnings report this week,
I would consider purchasing the 260usd strike price Puts with
an expiration date of 2026-1-16,
for a premium of approximately $11.75.
If these options prove to be profitable prior to the earnings release, I would sell at least half of them.

IMPP Imperial Petroleum Options Ahead of EarningsIf you haven`t bought IMPP before the rally:
Now analyzing the options chain and the chart patterns of IMPP Imperial Petroleum prior to the earnings report this week,
I would consider purchasing the 7usd strike price Calls with
an expiration date of 2026-4-17,
for a premium of approximately $0.85.
If these options prove to be profitable prior to the earnings release, I would sell at least half of them.

DXY LOCAL SHORT|
✅DXY is stalling inside higher-timeframe supply after sweeping buy-side liquidity, hinting at distribution. If rejection holds, expect a move toward the downside imbalance and sell-side liquidity below.Time Frame 6H.
SHORT🔥
✅Like and subscribe to never miss a new idea!✅

USDJPY Will Go Down From Resistance! Short!
Here is our detailed technical review for USDJPY.
Time Frame: 6h
Current Trend: Bearish
Sentiment: Overbought (based on 7-period RSI)
Forecast: Bearish
The market is on a crucial zone of supply 156.909.
The above-mentioned technicals clearly indicate the dominance of sellers on the market. I recommend shorting the instrument, aiming at 155.044 level.
P.S
The term oversold refers to a condition where an asset has traded lower in price and has the potential for a price bounce.
Overbought refers to market scenarios where the instrument is traded considerably higher than its fair value. Overvaluation is caused by market sentiments when there is positive news.
Like and subscribe and comment my ideas if you enjoy them!

Gold Fluctuates in Support Range; Accumulation Signals Rise⏰ Timeframe: 30m
📅 Update: 24/11/2025
🔍 Market Context
After a corrective decline from the 4,104 USD area, gold is moving within a range-bound structure with strong support at the 4,003–4,023 USD area.
The market is in a short-term re-accumulation phase, as consecutive CHoCH movements appear around the bottom area — reflecting the buying side's effort to absorb liquidity.
The selling side temporarily controls, but balancing signals are becoming clearer as the price continuously rejects breaking deeply below the Demand Zone.
📊 Technical Structure
Resistance Zone (4,090–4,104 USD): main supply area, confluence with Fibo 1.0, where profit-taking reactions are likely if the price rebounds.
Support Zone (4,023 USD): intermediate support, playing a key role in the current sideways structure.
Demand Zone (4,003 USD): potential demand area, confluence with previous liquidity bottom – main BUY Zone area.
Structure Bias: still inclined towards accumulation – recovery, as long as the price maintains above 4,003 USD.
🎯 Market Outlook
1️⃣ Priority Scenario (Buy setup):
• The price may continue to retest the Demand Zone (4,003–4,023 USD).
• When a clear reaction signal appears, expect a recovery to the Fibo 0.618 → 1.0 area, corresponding to 4,075–4,104 USD.
2️⃣ Secondary Scenario (Breakdown):
• If the price breaks below 4,003 USD, the recovery structure will be invalidated, bringing gold back to the lower liquidity area around 3,985 USD.
💎 Key Zones
BUY Zone: 4,003 – 4,023 USD
SELL Zone: 4,090 – 4,104 USD
🧠 Analyst’s View
Gold is currently in a liquidity re-accumulation phase, as both sides are testing the lower boundary of the main support area.
The buying side needs confirmation with a break above 4,075 USD, while the selling side still holds the advantage if the price cannot maintain above the balance area.
In the current context, price behavior leans towards the “Sweep – Retest – Expansion” model, with the potential for forming a short-term technical recovery wave.
🛡️ Risk Note
The market is in a low volatility area – avoid emotional actions without clear structural confirmation.

XAU/USD ANALYSIS 11/24/20251. Fundamental Analysis:
a) Economy:
• USD:
The USD is stabilizing after a recent period of weakness as markets expect the Fed to maintain lower interest rates in 2025, reducing pressure on gold.
• US Stock Market:
U.S. equities are seeing slight corrections, reflecting cautious sentiment ahead of this week’s FOMC minutes. When stocks stall, gold often benefits.
• FED:
Recent weak economic data has increased expectations that the Fed will cut rates earlier in 2025. Any dovish signals from the Fed will support gold prices.
• TRUMP Administration:
The Trump administration is considering a new economic stimulus package and adjustments to import taxes. Protectionist-leaning policies may cause volatility in the USD, but generally increase safe-haven demand — supporting gold.
• Gold ETF (SPDR):
SPDR has recently shown mixed buying and selling, indicating capital flows are not yet surging but also no longer experiencing heavy outflows. This is a neutral signal but slightly supportive of price stability.
b) Politics:
Tensions in the Middle East and concerns about the upcoming EU elections keep defensive capital flows active. These factors help support gold and limit the risk of deep declines.
c) Market Sentiment:
The market is in a mild risk-off state, with capital shifting toward safe assets, though not strongly yet. This aligns with gold maintaining its base and having the potential to break out if key technical levels are breached.
2. Technical Analysis:
• Price is maintaining a long-term uptrend line from early November.
• A compression triangle pattern has been broken to the upside — a clear bullish signal.
• The 4,064 level is a key retest zone currently being tested.
• If this zone holds, upside targets will expand.
• RSI on the M30 timeframe is in a balanced zone, not overbought — favorable for further upside movement.
Conclusion: The trend leans bullish as long as price does not break below the trendline and the 4,029 zone.
RESISTANCE: 4,096 – 4,125 – 4,193
SUPPORT: 4,029 – 4,000 – 3,964
3. Yesterday’s Market (21/11/25):
• Gold fluctuated strongly from the 4,029 support area and bounced back along the trendline.
• Buyers dominated late in the session, setting up a foundation for today’s recovery.
• Volatility has been narrowing, signaling a potential breakout.
4. Strategy for Today (24/11/25):
🪙 SELL XAUUSD | 4147 – 4145
SL: 4153
TP1: 4137
TP2: 4129
🪙 BUY XAUUSD | 3964 – 3966
SL: 3960
TP1: 3972
TP2: 3978

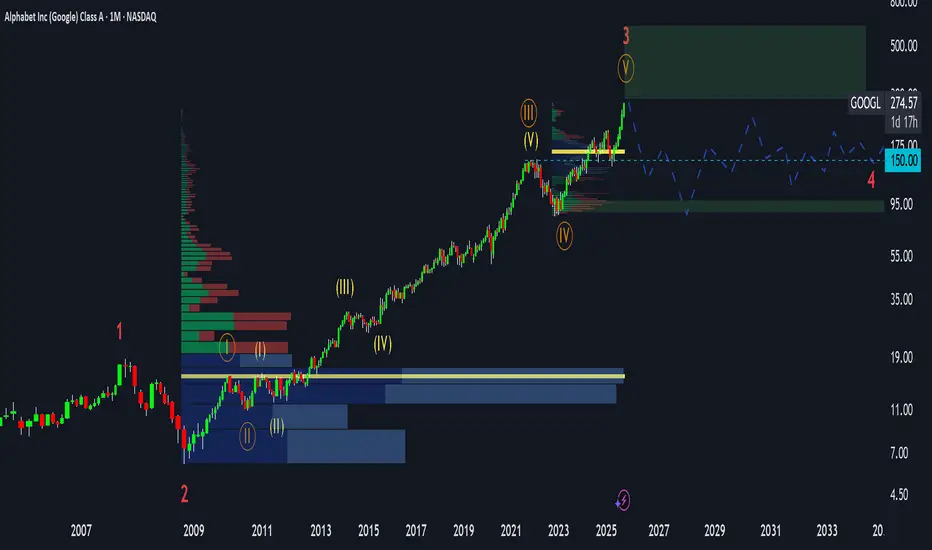
Is Google Entering Distribution? (GOOG, GOOGL Analysis)⚡ Overview
Recently, the charts of all major tech giants — Apple, Amazon, Google, Meta, and Microsoft — have started to look almost identical.
Each of them seems to be either topping out or entering what looks like a distribution phase.
In this post, I’ll share my technical and fundamental outlook on Google (GOOG, GOOGL), along with the key risks and price zones I’m watching as a trader.
💡 Fundamental View
From a fundamental perspective, Google still looks strong:
The P/E ratio has been growing steadily.
Revenue continues to rise.
The company has been aggressively buying back shares for years.
So fundamentally, this is not a bubble.
By Peter Lynch’s fair value formula, Google remains fairly valued, maybe even with a modest upside left.
However, strong fundamentals don’t always mean big growth ahead — especially when the market has already priced in perfection.
And that’s typically when the distribution phase begins.
📈 Technical View
According to Elliott Wave Theory, Google seems to be completing the fifth sub-wave within a larger third wave —
a structure that often marks the final stage before a distribution or correction phase.
On the long-term chart, price is now approaching the upper boundary of the rising channel,
with limited upside potential — possibly up to $430–$450, which represents the top zone.
Beyond that, the probability of continued growth drops sharply, while correction risk increases significantly.
⚙️ Market Structure
When analyzing the volume profile, the largest accumulation zone sits around $15 – $16 —
that’s where long-term investors entered 15 years ago.
Those early buyers are now sitting on massive unrealized profits,
and many are gradually distributing (selling) positions into current strength.
Meanwhile, retail traders often see the ongoing move as “more upside ahead.”
But in reality, this could be the final buying climax before a deeper correction.
🧩 Cycle Context
Interestingly, the same pattern is visible across Apple, Meta, Amazon, and Microsoft.
It’s not just about one stock — the entire Big Tech segment appears to be entering a similar maturity stage of the cycle.
That’s why I believe Google could soon transition from markup to distribution,
followed by a potential multi-quarter sideways or corrective phase.
💬 What’s your take? Do you think Google will reach $400 before correcting — or has the top already formed?
👇 Share your view in the comments.
EURUSD Will Move Higher! Buy!
Here is our detailed technical review for EURUSD.
Time Frame: 1h
Current Trend: Bullish
Sentiment: Oversold (based on 7-period RSI)
Forecast: Bullish
The market is testing a major horizontal structure 1.151.
Taking into consideration the structure & trend analysis, I believe that the market will reach 1.155 level soon.
P.S
Please, note that an oversold/overbought condition can last for a long time, and therefore being oversold/overbought doesn't mean a price rally will come soon, or at all.
Like and subscribe and comment my ideas if you enjoy them!

EURNZD Is Bearish! Short!
Take a look at our analysis for EURNZD.
Time Frame: 1D
Current Trend: Bearish
Sentiment: Overbought (based on 7-period RSI)
Forecast: Bearish
The market is approaching a key horizontal level 2.052.
Considering the today's price action, probabilities will be high to see a movement to 2.025.
P.S
The term oversold refers to a condition where an asset has traded lower in price and has the potential for a price bounce.
Overbought refers to market scenarios where the instrument is traded considerably higher than its fair value. Overvaluation is caused by market sentiments when there is positive news.
Like and subscribe and comment my ideas if you enjoy them!
