EURUSD Keeps Its Uptrend, Eyes 1.1780–1.1820EURUSD remains in a well-defined bullish structure on the H4 timeframe, driven less by speculative enthusiasm and more by a steady shift in relative monetary expectations. The pair continues to benefit from a softening USD backdrop while the euro holds its ground.
Recent Fed communication has reinforced a dovish bias, pulling US yields and the Dollar Index lower as US macro data increasingly point to slowing momentum. In contrast, the ECB has avoided committing to aggressive easing, allowing the policy gap to tilt modestly in favor of EUR.
From a price-action perspective, EURUSD is displaying a classic bullish consolidation. Pullbacks remain shallow, value gaps are gradually absorbed, and price stays comfortably above an expanding Ichimoku cloud. The former resistance near 1.1700 has transitioned into a key support zone, while volume distribution suggests selling pressure remains below current levels.
As long as the pair holds above 1.1710–1.1730, upside continuation toward 1.1780 and potentially 1.1820 remains the dominant scenario. A sustained break below 1.1660 would be required to invalidate the short-term bullish structure.
Signals

ETHUSDT Enters a Consolidation PhaseOn the 6H chart, ETHUSDT is stabilising after the drop from 3,350. Selling pressure has eased, but demand remains insufficient to establish a fresh uptrend. Price action suggests a pause rather than a reversal, with the market waiting for clearer direction.
From a broader perspective, Bitcoin’s inability to break key resistance levels continues to cap upside across altcoins. A steady DXY also limits risk appetite, while Ethereum lacks a new catalyst following EIP-4844. As a result, rebounds remain slow and are quickly met with supply.
As long as ETH holds above the 3,050–3,120 area, sideways accumulation between 3,080 and 3,200 is the base case. A break above 3,280–3,330 would be required to confirm a broader bullish continuation.

ETHUSDT – Technical Rebound or the Start of a New Bullish Wave?Hello everyone, ETH has just bounced back — but is this the beginning of a new bullish wave, or simply a technical pullback before the market chooses its true direction? Let’s break it down together!
ETH recently experienced a sharp dump from 3,150 down to 2,780, sweeping liquidity below and forcing the market into a technical “reset.” The long bearish candle accompanied by high volume suggests a real sell-off, but right after that, ETH reversed upward and is now hovering around 3,050, pressing against the EMA 89 while the EMA 34 begins to curl upward.
This rebound is essentially a technical pullback within a broader downtrend — price is trying to rebalance around the EMAs after a deep drop. Volume has picked up slightly, but there’s no real FOMO yet; it’s mostly short covering and early dip-buyers stepping in. Market structure still leans bearish: lower highs, lower lows, a downward-sloping EMA 89, and ETH still hasn’t secured a strong 4H close above 3,100–3,150.
However, this bounce does have a foundation: expectations of a softer Fed stance, Bitcoin recovering slightly and dragging altcoins up, and Ethereum’s long-term narrative continuing to attract investors — turning the 2,800 zone into a “discount zone” for gradual accumulation. Still, the rebound isn’t strong enough to confirm the start of a new uptrend.
My personal view:
ETH is likely to continue rising toward the 3,080–3,120 region — a confluence of the EMA 89, previous highs and a prior supply area. If selling pressure reappears — upper-wick candles, rising volume — ETH could face rejection and retrace lower. The support levels I’m watching are 2,950–2,900, with a deeper zone at 2,820–2,780 where ETH may form a higher low before attempting another push upward.
Conditions required to confirm a true bullish wave:
A clean, stable 4H close above 3,150–3,180.
EMA 34 crossing above EMA 89, with both EMAs starting to slope upward.
Clear buying volume expansion during breakout attempts.
Only when these criteria are met can upside targets extend to 3,260 – 3,380, and potentially 3,520, depending on Bitcoin’s strength and overall market sentiment.
Wishing everyone disciplined and effective trading — pay close attention to how ETH reacts around these key EMA zones!

SOLUSDT – Gains Limited, Price Faces a Key Decision ZoneHello everyone, SOL experienced an impressive upward move over the past weekend, but the current momentum has noticeably weakened as the price hits the EMA 89 (blue), an area that has previously created strong selling pressure last month.
After bouncing around the 145 USD mark, SOL retraced to test both EMA 34 (red) and EMA 89, forming a critical convergence zone to determine the next direction. Recent candles show long upper wicks accompanied by decreasing volume, indicating that buyers are losing strength compared to the previous breakout while profit-taking pressure is rising. The market structure has yet to confirm an uptrend, as SOL has only slightly broken local highs without forming a clear higher-high, explaining why the price was rejected at EMA 89.
From a macro and capital flow perspective, over the past 48 hours, the Solana ecosystem has shown a positive recovery, with several DeFi projects and memecoins rallying. However, capital inflows into altcoins have paused as investors await updates from the Fed and US economic data. Bitcoin is currently moving sideways, meaning the primary market momentum supporting altcoins, including SOL, is insufficient to drive a breakout. Therefore, even positive news is not yet strong enough to establish a new trend.
Wishing everyone successful trading!

Bitcoin Could Fade Into Irrelevance in the Next Bear MarketIf you haven`t sold BTC recently:
Now you need to know that Bitcoin (BTC) has been trading in a corrective phase after failing to sustain above $100,000 earlier this year.
Strategy (formerly MicroStrategy), led by Michael Saylor, holds over 671,000 BTC – acquired at an average cost basis of approximately $74,972 per BTC.
The company's aggressive accumulation has been funded through a combination of convertible debt, equity issuance, and at-the-market offerings, creating significant leverage.While Saylor frames this as "Bitcoin yield," it amplifies downside risk.
A sustained drop below the ~$75K average cost basis would flip unrealized gains into losses, potentially triggering margin pressures on debt covenants, forced dilution to raise capital, or – in a worst-case spiral – partial liquidations to service obligations.
MSTR stock already trades as a highly correlated, leveraged proxy to Bitcoin (historical beta often 1.5x–2x). A
BTC breakdown below $74K could compress MSTR's premium to NAV dramatically, sparking retail and institutional selling.
This, in turn, would pressure Bitcoin further if Strategy is forced to slow purchases or (unlikely but possible in extreme scenarios) sell holdings.
This setup creates a classic self-fulfilling prophecy: bearish sentiment drives price lower → crosses key psychological/technical level at $74K → leverage unwind in the largest corporate holder → accelerated selling → deeper correction.
Technical Outlook: Path to Sub-$74KFrom a chart perspective: BTC has rejected the $100K–$126K highs and is forming lower highs.
Key support cluster sits around $80K–$82K (prior resistance turned support).
A break below $80K opens the door to $74K retest – aligning perfectly with Strategy's average cost.
Further downside targets: $70K (38.2% Fibonacci retracement of the 2024–2025 rally) and the $62K–$72K zone, a major demand area from mid-2025 consolidation.
Bear Case Target: Sub-$74K, potentially triggering the leverage feedback loop described above.
Buy Area: If we see capitulation, the $62K–$72K zone represents strong historical support and a potential accumulation range for long-term holders.
This area coincides with prior cycle highs and significant on-chain volume.

$ARLO, Long, TP>30-40%NYSE:ARLO , Long, TP>30-40%
This stock is interesting.
Choose an entry point and do not forget about a protective order if you are trading with leverage.
Don't risk it if you're not sure.
Good luck to everyone.

BB BlackBerry Limited Options Ahead of EarningsIf you haven`t bought BB before the rally:
Now analyzing the options chain and the chart patterns of BB BlackBerry Limited prior to the earnings report this week,
I would consider purchasing the 4.50usd strike price Puts with
an expiration date of 2027-1-15,
for a premium of approximately $1.04.
If these options prove to be profitable prior to the earnings release, I would sell at least half of them.

JBL Jabil Options Ahead of EarningsIf you haven`t bought JBL before the rally:
Now analyzing the options chain and the chart patterns of JBL Jabil prior to the earnings report this week,
I would consider purchasing the 220usd strike price Puts with
an expiration date of 2025-12-19,
for a premium of approximately $8.45.
If these options prove to be profitable prior to the earnings release, I would sell at least half of them.

LEN Lennar Corporation Options Ahead of EarningsIf you haven’t exited LEN before the selloff:
Now analyzing the options chain and the chart patterns of LEN Lennar Corporation prior to the earnings report next week,
I would consider purchasing the 115usd strike price Puts with
an expiration date of 2025-12-19,
for a premium of approximately $1.62.
If these options prove to be profitable prior to the earnings release, I would sell at least half of them.

PLCE The Children's Place Options Ahead of EarningsAnalyzing the options chain and the chart patterns of PLCE The Children's Place prior to the earnings report this week,
I would consider purchasing the 8usd strike price Calls with
an expiration date of 2026-1-16,
for a premium of approximately $0.85.
If these options prove to be profitable prior to the earnings release, I would sell at least half of them.

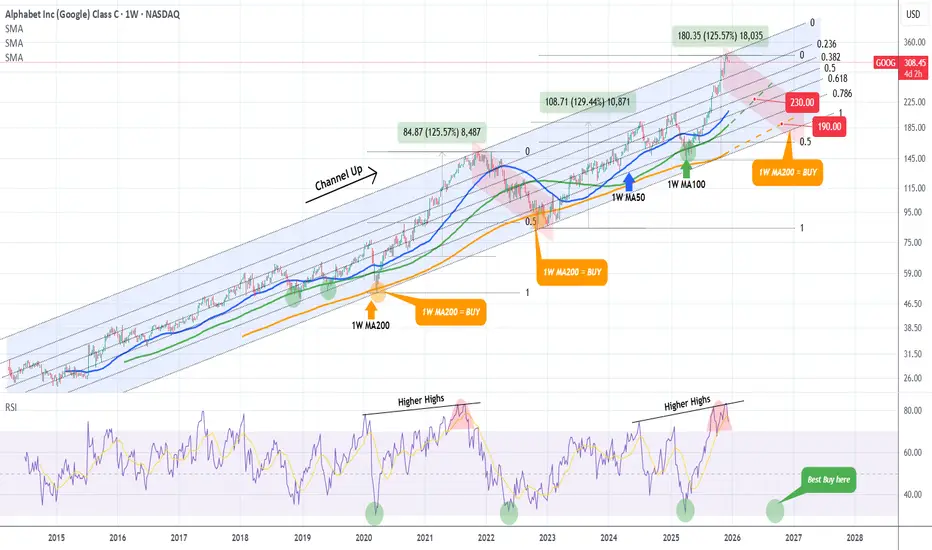
GOOGLE Bear Cycle has started and this is its ultimate blueprintWe made this chart on Google (GOOG) a little more than a month ago, warning of a potential market top on the Higher Highs trend-line of the multi-year Channel Up.
Well 3 weeks ago, the market hit that trend-line and we have a legitimate technical reason to expect that the Bull Cycle has topped. The 1W RSI has even printed the same kind of peak formation it did in September 2021.
We have extended the Channel Up on today's analysis all the way back to Google's IPO and the Fibonacci retracement levels serve absolute justice since the beginning to identify tops and bottoms.
You can see that the 1W MA200 (orange trend-line) has acted as the ultimate Support, thus best buy entry, on the last three major market corrections: the March 2020 COVID crash, the October 2022 Inflation Crisis bottom and the April 2025 (almost) Tariff War.
Before that, it was the 1W MA100 (green trend-line) that gave two excellent buy opportunities back-to-back.
As a result, even though the 2022 Bearish Leg correction bottomed on the 0.5 Fibonacci retracement level, this time we will 'limit' the new Bear Cycle to those MA trend-lines, the MA100 and MA200. If the price is contained on the MA100, its current trajectory shows a potential 'fair' contact around $230. If the market fails to rebound there, we expect a Q3 2026 bottom on the 1W MA200 around $190.
Regardless of that, we will also be looking closing at the 1W RSI. Since the 2020 COVID crash, and those 3 in total major corrections that the Alphabet stock had, when the RSI hit the 32.00 level, it presented an objective buy opportunity, even though in 2022 it dipped even lower.
---
** Please LIKE 👍, FOLLOW ✅, SHARE 🙌 and COMMENT ✍ if you enjoy this idea! Also share your ideas and charts in the comments section below! This is best way to keep it relevant, support us, keep the content here free and allow the idea to reach as many people as possible. **
---
💸💸💸💸💸💸
👇 👇 👇 👇 👇 👇
TESLA BULLISH BREAKOUT|LONG|
✅TESLA strong ICT bullish continuation as price breaks and holds above a key institutional demand level, confirming a valid breakout. Acceptance above prior highs suggests smart money participation, with upside liquidity resting above the range and favoring continuation into premium targets. Time Frame 2H.
LONG🚀
✅Like and subscribe to never miss a new idea!✅

GBPAUD FREE SIGNAL|SHORT|
✅GBPAUD taps into a premium supply zone after a corrective bullish leg, with bearish ICT confluence showing rejection from institutional highs. Weak follow-through above supply signals distribution, favoring a downside continuation toward the discounted liquidity pool below.
—————————
Entry: 2.0144
Stop Loss: 2.0171
Take Profit: 2.0106
Time Frame: 2H
—————————
SHORT🔥
✅Like and subscribe to never miss a new idea!✅

EUR-NZD Free Signal! Buy!
Hello,Traders!
EURNZD rejects a well-defined horizontal supply, printing bearish displacement after internal liquidity is swept. This move confirms distribution from premium, with sellers in control and a continuation expected toward the lower liquidity pool.
--------------------
Stop Loss: 2.0351
Take Profit: 2.0234
Entry: 2.0297
Time Frame: 4H
--------------------
Sell!
Comment and subscribe to help us grow!
Check out other forecasts below too!
Disclosure: I am part of Trade Nation's Influencer program and receive a monthly fee for using their TradingView charts in my analysis.

EURJPY | Long IdeaEURJPY testing my zone once again.
the zone lines up with the Previous Monthly High and has been testing a few times last week.
Kind of surprised that EURJPY is here once again that quick.
Looking for price to hold this level and find it's way back up.
If price closes under on the 2-4h chart I don't really see another zone I would be interested in in buying so I'll let it do it's thing and see if any price action later this week looks interesting to me.

GBP-JPY Will Go Down! Sell!
Hello,Traders!
GBPJPY reacts from a clear supply cluster after a trendline break, with buy-side liquidity already taken. The impulse lower shows bearish displacement and market structure shift, suggesting distribution and continuation toward the next downside liquidity pool. Time Frame 3H.
Sell!
Comment and subscribe to help us grow!
Check out other forecasts below too!
Disclosure: I am part of Trade Nation's Influencer program and receive a monthly fee for using their TradingView charts in my analysis.

Lingrid | GOLD Sideways Movement Ahead of FOMC DecisionOANDA:XAUUSD perfectly played out my previous trading idea . Price is holding inside a well-defined consolidation after its prior surge, with price rotating above the rising channel base. The trend remains constructive, but momentum has cooled, suggesting participants are waiting for a catalyst rather than committing aggressively.
If buyers continue to defend the trendline and the lower boundary of the range, gold could attempt another gradual push toward the upper resistance near 4,300. A brief dip toward the channel support may occur to gather liquidity, potentially offering a better positioning point before any renewed upside attempt.
➡️ Primary scenario: support holds near 4,160 → rotation higher toward 4,300.
⚠️ Risk scenario: a sustained breakdown below the channel could weaken the bullish structure.
If this idea resonates with you or you have your own opinion, traders, hit the comments. I’m excited to read your thoughts!

Lingrid | ETHUSDT Expecting Short-Term CorrectionBINANCE:ETHUSDT perfectly played out my previous trading idea . Price appears to be losing traction after tagging the upper resistance band near 3,500, where price was firmly rejected along the rising red trendline. The push into this zone followed an extended recovery from the lows, but the rejection candle and subsequent slowdown suggest buyers may be running out of strength. Structure still leans corrective, with the recent rally resembling a mean reversion rather than a fresh expansion phase.
If price fails to reclaim the 3,225–3,250 area and sellers remain active below that former support, Ethereum could unwind toward the ascending base around 2,900, where the higher-low structure and long-term support intersect. That region may attract bids again, but only after a deeper reset plays out.
➡️ Primary scenario: rejection below 3,250 → pullback toward 2,900.
⚠️ Risk scenario: a decisive hold above 3,300 may neutralize downside pressure and reopen the path toward 3,500.
If this idea resonates with you or you have your own opinion, traders, hit the comments. I’m excited to read your thoughts!

XAUUSD Same sell signal for 3rd time in past 2 months.Gold (XAUUSD) got rejected and turned sideways just before hitting the Higher Highs trend-line of the underlying rising channel. In the past 2 months we've seen this exact same Sell Signal another 2 times. Even the current 4H RSI sequence matches those peaks.
Those previous Sell Signals eventually made the price pull-back below the 4H MA100 (green trend-line). This time the current Support is the Higher Lows trend-line and of course the 1D MA50 (red trend-line) which continues to keep the long-term bullish trend intact.
As a result, we are targeting 4180 at least in the coming days, which is still above the 0.618 Fibonacci retracement level which supported the previous -5.84% Bearish Leg.
---
** Please LIKE 👍, FOLLOW ✅, SHARE 🙌 and COMMENT ✍ if you enjoy this idea! Also share your ideas and charts in the comments section below! This is best way to keep it relevant, support us, keep the content here free and allow the idea to reach as many people as possible. **
---
💸💸💸💸💸💸
👇 👇 👇 👇 👇 👇

USDJPY WILL GO UP|LONG|
✅USDJPY reacts strongly from a well-defined higher-timeframe demand zone, with sell-side liquidity already swept. Price shows bullish displacement and structure support holding, suggesting smart money accumulation. A continuation move higher is favored toward premium liquidity above. Time Frame 6H.
LONG🚀
✅Like and subscribe to never miss a new idea!✅

EUR-USD Local Short! Sell!
Hello,Traders!
EURUSD taps into a well-defined higher-timeframe supply zone after strong bullish displacement. Smart money distribution is evident with buy-side liquidity taken and momentum stalling at premium. A corrective move lower is expected. Time Frame 7H.
Sell!
Comment and subscribe to help us grow!
Check out other forecasts below too!
Disclosure: I am part of Trade Nation's Influencer program and receive a monthly fee for using their TradingView charts in my analysis.

$MRKR, Long, TP>50%NASDAQ:MRKR , Long, TP>50%
For short-term trading, this stock is interesting.
Choose an entry point and do not forget about a protective order if you are trading with leverage.
Don't risk it if you're not sure.
Good luck to everyone.

BTCUSDT.P - December 16, 2025Price has extended a sharp downside leg and is now approaching a major support cluster around 84,700–85,200, where the planned long entry sits in alignment with previous reaction lows. The broader structure reflects a corrective downswing within a wider range, so a sustained hold above this zone could fuel a recovery toward 88,500–89,800, matching the projected profit area. A decisive breakdown through the stop level near 83,300 with strong momentum would confirm continuation of the downtrend and invalidate the bullish setup.
