CRUDE OIL Free Signal! Buy!
Hello,Traders!
CRUDE OIL has delivered a clean sell-side liquidity sweep into a well-defined horizontal demand area, followed by a strong bullish reaction. This displacement suggests smart money mitigation and absorption, favoring a corrective push higher toward the next liquidity pool.Time Frame 5H.
--------------------
Stop Loss: 56.98$
Take Profit: 58.07$
Entry: 57.47$
Time Frame: 3H
--------------------
Buy!
Comment and subscribe to help us grow!
Check out other forecasts below too!
Disclosure: I am part of Trade Nation's Influencer program and receive a monthly fee for using their TradingView charts in my analysis.
Signals

US30 Will Move Lower! Short!
Please, check our technical outlook for US30.
Time Frame: 9h
Current Trend: Bearish
Sentiment: Overbought (based on 7-period RSI)
Forecast: Bearish
The price is testing a key resistance 48,497.6.
Taking into consideration the current market trend & overbought RSI, chances will be high to see a bearish movement to the downside at least to 47,110.8 level.
P.S
The term oversold refers to a condition where an asset has traded lower in price and has the potential for a price bounce.
Overbought refers to market scenarios where the instrument is traded considerably higher than its fair value. Overvaluation is caused by market sentiments when there is positive news.
Like and subscribe and comment my ideas if you enjoy them!

USDCAD Is Bullish! Buy!
Here is our detailed technical review for USDCAD.
Time Frame: 1D
Current Trend: Bullish
Sentiment: Oversold (based on 7-period RSI)
Forecast: Bullish
The market is trading around a solid horizontal structure 1.377.
The above observations make me that the market will inevitably achieve 1.395 level.
P.S
We determine oversold/overbought condition with RSI indicator.
When it drops below 30 - the market is considered to be oversold.
When it bounces above 70 - the market is considered to be overbought.
Like and subscribe and comment my ideas if you enjoy them!

BTCUSDT.P - December 14, 2025Price is consolidating in a tight range after a prior decline, with the short entry positioned just under minor intraday resistance around 90,300–90,400. The stop level near 90,700 caps the recent lower high, preserving the short-term bearish structure while this zone holds. As long as price remains below that resistance and intraday momentum stays soft, the setup favors continuation toward the downside objective around 89,600–89,700, where stronger support is located.

GOLD Will Keep Growing! Buy!
Hello,Traders!
GOLD strong bullish displacement confirms a successful mitigation of the horizontal demand area, following a clear sell-side liquidity grab. Market structure remains bullish, with smart money defending the zone and favoring continuation toward the next overhead liquidity pool and marked target. Time Frame 5H.
Buy!
Comment and subscribe to help us grow!
Check out other forecasts below too!
Disclosure: I am part of Trade Nation's Influencer program and receive a monthly fee for using their TradingView charts in my analysis.

NZDCAD LOCAL LONG|
✅NZDCAD is reacting from a well-defined discount demand zone after a sell-side liquidity sweep. Bullish displacement from demand signals smart money accumulation, with structure favoring a continuation higher toward the next internal liquidity pool and marked target. Time Frame 5H.
LONG🚀
✅Like and subscribe to never miss a new idea!✅

EURCAD FREE SIGNAL|SHORT|
✅EURCAD is reacting from a well-defined premium supply zone after a clean buy-side liquidity sweep. Bearish displacement and rejection from the supply suggest smart money distribution, with price now seeking internal sell-side liquidity below. Expect continuation toward the marked target.
—————————
Entry: 1.6175
Stop Loss: 1.6194
Take Profit: 1.6145
Time Frame: 4H
—————————
SHORT🔥
✅Like and subscribe to never miss a new idea!✅

USDCAD REBOUND AHEAD|LONG|
✅USDCAD has swept sell-side liquidity and is reacting from a clean demand zone. Strong rejection and displacement suggest institutional buying, with price trading in discount and targeting next internal liquidity above. Expect a corrective push higher from this base. Time Frame 8H.
LONG🚀
✅Like and subscribe to never miss a new idea!✅

EUR-NZD Free Signal! Buy!
Hello,Traders!
EURNZD after a deep sell-side liquidity sweep, price taps into a well-defined horizontal demand area. Strong bullish displacement suggests smart money accumulation, with structure shifting bullish. Expect continuation toward upside liquidity and prior imbalance.
--------------------
Stop Loss: 2.0195
Take Profit: 2.0269
Entry: 2.0225
Time Frame: 3H
--------------------
Buy!
Comment and subscribe to help us grow!
Check out other forecasts below too!
Disclosure: I am part of Trade Nation's Influencer program and receive a monthly fee for using their TradingView charts in my analysis.

NZD-USD Bullish Bias! Buy!
Hello,Traders!
NZDUSD reacts cleanly from a rising demand cluster, holding bullish structure and protected higher lows. Smart money defended the ascending support, suggesting accumulation on the pullback. Expect continuation toward overhead liquidity and previous highs. Time Frame 3H.
Buy!
Comment and subscribe to help us grow!
Check out other forecasts below too!
Disclosure: I am part of Trade Nation's Influencer program and receive a monthly fee for using their TradingView charts in my analysis.

GBPUSD RISING TRENDLINE|LONG|
✅GBPUSD is respecting a clean rising trendline with strong bullish structure intact. Recent pullback shows mitigation into dynamic support, suggesting smart money accumulation. As long as the trendline holds, continuation toward higher liquidity and upside targets remains favored. Time Frame 6H.
LONG🚀
✅Like and subscribe to never miss a new idea!✅

$SIDU, Long, TP>50%NASDAQ:SIDU , Long, TP>50%
This stock is interesting.
Choose an entry point and do not forget about a protective order if you are trading with leverage.
Don't risk it if you're not sure.
Good luck to everyone.

EURUSD bullish retracement before continuing the bearish pushQuick Summary
EURUSD is expected to continue rising toward 1.16620 on the hourly chart, before potentially resuming its downward move toward 1.16145.
Full Analysis
On the 15m, EURUSD is likely to extend its upward move toward 1.16620. From this level, a reversal could take the pair down toward 1.16145, which is a key target. A break below this low would confirm further bearish pressure but will wait for confirmation first. On the 4-hour chart, the ascending trendline break supports the expectation of continued downside. you should monitor these levels for potential short entries and confirmation of trend continuation. Overall, while short-term bullish moves may occur, the bias turns bearish after a clear confirmation at 1.16620.

AUDJPY Is Very Bullish! Long!
Please, check our technical outlook for AUDJPY.
Time Frame: 1h
Current Trend: Bullish
Sentiment: Oversold (based on 7-period RSI)
Forecast: Bullish
The market is on a crucial zone of demand 102.249.
The oversold market condition in a combination with key structure gives us a relatively strong bullish signal with goal 102.716 level.
P.S
Please, note that an oversold/overbought condition can last for a long time, and therefore being oversold/overbought doesn't mean a price rally will come soon, or at all.
Like and subscribe and comment my ideas if you enjoy them!

GOLD Is Bullish! Buy!
Take a look at our analysis for GOLD.
Time Frame: 4h
Current Trend: Bullish
Sentiment: Oversold (based on 7-period RSI)
Forecast: Bullish
The market is approaching a significant support area 4,188.16.
The underlined horizontal cluster clearly indicates a highly probable bullish movement with target 4,233.29 level.
P.S
Overbought describes a period of time where there has been a significant and consistent upward move in price over a period of time without much pullback.
Like and subscribe and comment my ideas if you enjoy them!

NZDCAD Will Move Lower! Short!
Here is our detailed technical review for NZDCAD.
Time Frame: 1h
Current Trend: Bearish
Sentiment: Overbought (based on 7-period RSI)
Forecast: Bearish
The market is approaching a key horizontal level 0.805.
Considering the today's price action, probabilities will be high to see a movement to 0.803.
P.S
We determine oversold/overbought condition with RSI indicator.
When it drops below 30 - the market is considered to be oversold.
When it bounces above 70 - the market is considered to be overbought.
Like and subscribe and comment my ideas if you enjoy them!

BITCOIN Is Very Bullish! Long!
Take a look at our analysis for BITCOIN.
Time Frame: 1h
Current Trend: Bullish
Sentiment: Oversold (based on 7-period RSI)
Forecast: Bullish
The market is testing a major horizontal structure 90,218.38.
Taking into consideration the structure & trend analysis, I believe that the market will reach 91,478.05 level soon.
P.S
Overbought describes a period of time where there has been a significant and consistent upward move in price over a period of time without much pullback.
Like and subscribe and comment my ideas if you enjoy them!

USDJPY Is Going Down! Sell!
Please, check our technical outlook for USDJPY.
Time Frame: 1h
Current Trend: Bearish
Sentiment: Overbought (based on 7-period RSI)
Forecast: Bearish
The market is approaching a key horizontal level 155.844.
Considering the today's price action, probabilities will be high to see a movement to 155.434.
P.S
Please, note that an oversold/overbought condition can last for a long time, and therefore being oversold/overbought doesn't mean a price rally will come soon, or at all.
Like and subscribe and comment my ideas if you enjoy them!

AUDUSD Will Fall! Short!
Here is our detailed technical review for AUDUSD.
Time Frame: 1D
Current Trend: Bearish
Sentiment: Overbought (based on 7-period RSI)
Forecast: Bearish
The market is approaching a significant resistance area 0.665.
Due to the fact that we see a positive bearish reaction from the underlined area, I strongly believe that sellers will manage to push the price all the way down to 0.652 level.
P.S
The term oversold refers to a condition where an asset has traded lower in price and has the potential for a price bounce.
Overbought refers to market scenarios where the instrument is traded considerably higher than its fair value. Overvaluation is caused by market sentiments when there is positive news.
Like and subscribe and comment my ideas if you enjoy them!

XAUUSD in Uptrend, Awaiting Technical PullbackHi everyone, Domic here. Let’s take a closer look at gold today!
Overall, both news and technicals favor buyers. Gold has surged to around $4,270/oz, up $32 from yesterday, reaching its highest level in over a month. The Fed’s 0.25% rate cut, lowering the benchmark to 3.5–3.75%, has clearly weakened the USD — a positive catalyst for gold. Meanwhile, silver also hit a new high around $64.22/oz. According to Edward Meir, silver’s strong momentum is lifting gold and other precious metals, signaling a return of capital to safe-haven assets.
Looking ahead, the market eyes the Nonfarm Payrolls report on December 16 for clues on the next rate moves. Discussions over the next Fed chair, with front-runner Kevin Hassett supporting rate cuts, further strengthen expectations of a prolonged low-rate environment, keeping gold in a favorable position among safe-haven assets.
On the H4 chart, XAUUSD’s uptrend is clear. Price sits above both EMAs, with the short EMA (red) near 4,221 and the long EMA (blue) near 4,188, confirming the medium–long-term uptrend. The recent breakout pushed gold to 4,270–4,280 with rising volume, indicating active buying rather than a random spike. However, the gap between price and the short EMA is wide, making a technical pullback likely.
Preferred scenario:
Gold may retrace to a nearby support zone before resuming its uptrend. The first support is around 4,240–4,250, where price previously consolidated before the breakout — a potential shallow pullback before bouncing higher.
If selling intensifies, the 4,220–4,225 zone near the red EMA offers a good retest point, aligning with the broken resistance. In a stronger pullback, the long EMA (blue) near 4,188 acts as the next safety net, preserving the medium-term uptrend.
→ As long as price stays above this zone on H4, any dips are just pullbacks within the uptrend.
Wishing you successful trades!

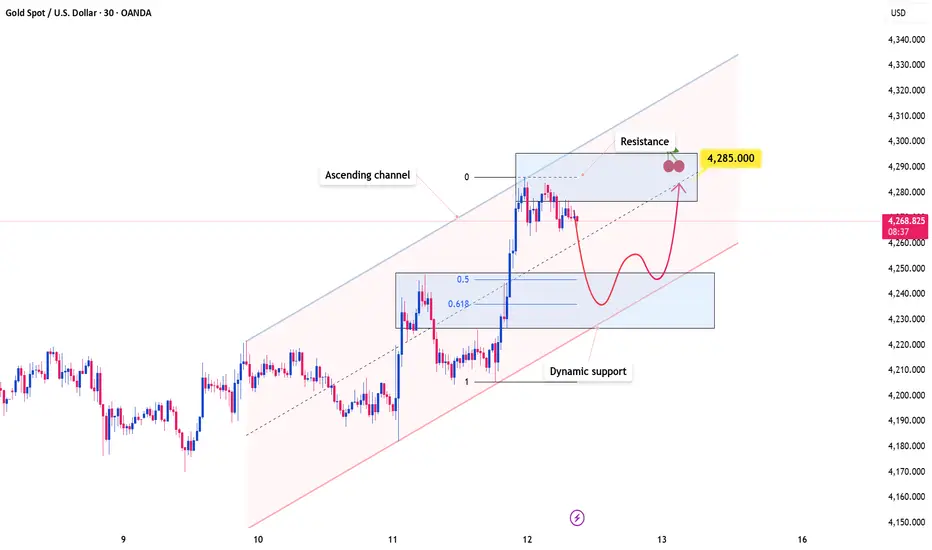
Gold Holds a High Ground While the Market Reprices RiskOANDA:XAUUSD continues to trade within a well-defined ascending channel, with price action consistently respecting both the upper and lower boundaries. This structure highlights strong bullish control, suggesting that buyers remain firmly in charge and that upside continuation is still favored.
Price has recently broken above a key resistance zone and may return to retest this level. If it holds as support, it would further validate the bullish structure and significantly increase the probability of a move toward the 4,285 target. This level aligns closely with the midline of the ascending channel as well as a previous resistance area, reinforcing its technical importance.
As long as price remains above this support zone, the bullish outlook stays intact. However, a failure to hold this level could weaken the current structure and open the door for a deeper pullback toward the lower boundary of the channel.
On the fundamental side, gold’s recent surge has been driven by an unexpected shift from the U.S. Federal Reserve toward monetary easing, including a return to bond purchases. This move pressured the U.S. dollar and effectively removed prior concerns over a prolonged hawkish policy stance, prompting renewed inflows into gold.
While short-term pullbacks remain possible due to overbought conditions, the broader trend continues to look constructive, supported by ongoing central bank buying and sustained demand for safe-haven assets.
Gold Bear Flag Ready for a Bullish BreakoutHello everyone, Helene here! XAUUSD is currently showing a more positive outlook as price structure starts shifting into a bullish direction.
The latest market interaction is particularly interesting. We’re seeing an early recovery phase, weakening bearish momentum, and low-volume candles suggesting seller exhaustion. This often acts as an early signal for a potential bullish move developing.
Based on the current pattern, my target is around 4,330 – a reasonable level aligned with the market structure. Should price continue in this direction, the next move could become a beautiful extension of the bullish story in Gold we’ve been following.
This setup looks very appealing. It’s a developing scenario, although it still requires patience and proper confirmation before fully validating the upside.
Even though a bearish scenario is still possible due to the clear support zone below, I personally lean toward additional bullish continuation as the pattern forming here supports that outlook.
Wishing you a successful trading session and the best of luck.

Gold’s Next Big Move: 4,350 Is Within Reach!Hello everyone, it's Helene here!
Gold is looking pretty interesting right now. As mentioned in the previous analysis, the price shot up. But guess what? Right now, it's slightly pulling back, moving in the opposite direction to the previous uptrend, which looks like a familiar bullish flag pattern. In this case, there's a scenario that could play out, and considering the market conditions are still bullish, I'm leaning toward the possibility that the price will break the flag pattern to the upside.
My target is 4,350.
Do you agree? Leave a comment below. Joining the TradingView community is always helpful to improve and develop your trading skills.
