BTC Trade Idea: Short from 117,850 at previous resistance level
Bitcoin is currently at a previous resistance level 117,500 where the price has bounced down before.
Personally, I will enter a short trade from the current price with a tight stop-loss.
✅ My Personal Strategy:
Entry: Sell from current price 117,850
🎯 Target 1: 116,000
🎯 Target 2: 115,500
Stop Lose : Daily close above the resistance level 117,500
Please note:
This is not financial advice – I’m only sharing my personal trades.
Always do your own research before taking action.
👍 Don’t forget to like if you found this useful, and feel free to follow me for more analysis of this kind.
Best of luck 🌹
Signalservice

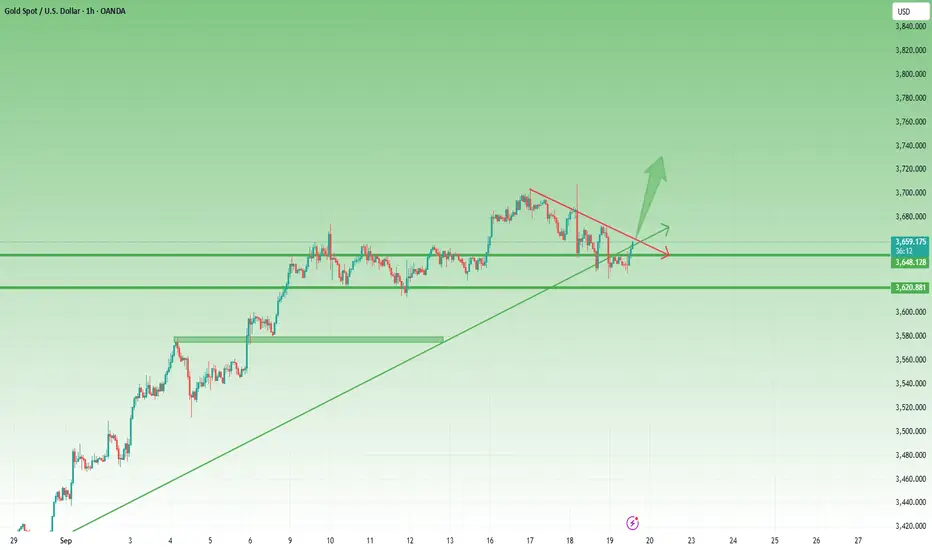
Bulls Defend 3630 zone – Is the Reversal Already Starting?In my yesterday’s analysis, I argued that Gold could extend its correction towards 3620 and even 3570 if the move deepened.
Indeed, during the day, price reached a new local low at 3628 before reversing sharply higher.
For several sessions now, I have been pointing out the risk of a correction. But the main message remained clear: this is only a correction within a much larger bullish trend.
So the key question today is: Is the correction over?
📊 Chart observations:
• The structure is corrective, with overlapping price action.
• After the Fed-triggered drop to 3635, price dipped again to 3628, and once more last night to 3632. Each of these dips has been quickly bought back, showing strong bull interest around the 3630 zone.
• Despite this, we are still under the falling trendline, which means caution is required.
⚖️ Trading stance:
This type of price action prompted me to close my short trades with around +550 pips profit. For now, I am adopting a wait-and-see approach but with a bullish bias in mind.
🟢 Two bullish scenarios I’m working with:
1. A fresh dip towards 3620 could provide a buying opportunity, as I would expect bulls to step in again.
2. If the price stabilizes above 3665–3670, I will consider the correction complete and start looking for long entries on strength.
At this stage, patience is key. Let the market show its hand, but the evidence suggests that the bullish trend is preparing for another leg higher. 🚀
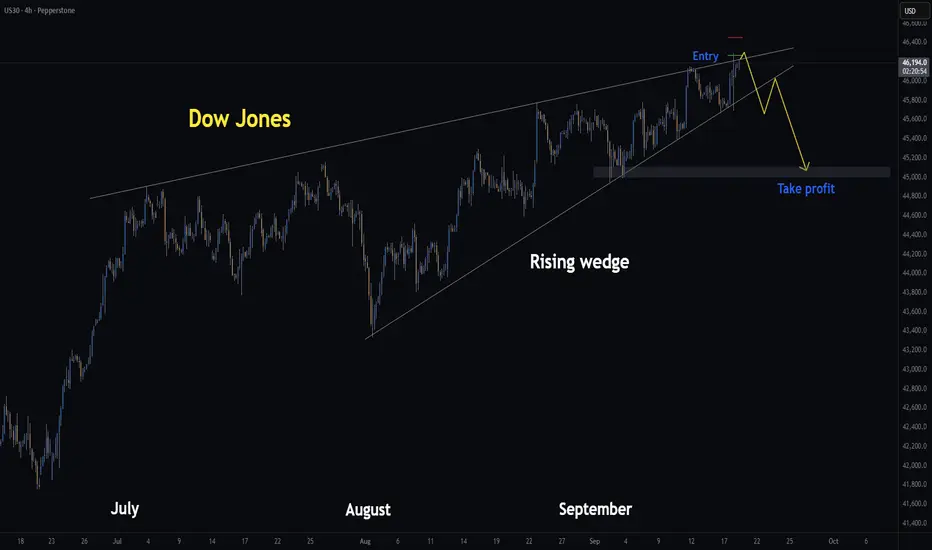
DowJones | H4 Rising Wedge | GTradingMethodHello Traders,
Yesterday I shared a short setup on the Dow Jones using the rising wedge pattern. I entered at 46,267 and exited with a small profit at 46,179. I exited because I did not like the reaction at that level and anticipating a better entry.
Today, I’m looking to re-enter if price reaches 46,343, which could form a potential double top on the chart.
🧐 Market Overview:
Rising wedges generally act as bearish reversal patterns, that said, the broader market remains bullish following the FOMC, so I’ll be risking less and proceeding with caution.
However, the VIX has been sitting near multi-month lows, which often precedes sharp moves. If volatility picks up post-FOMC, rising wedge patterns could act as early warning signs of a pullback.
So I am willing to risk a small amount and potentially be rewarded BIG!
📊 Trade Plan:
Risk/Reward: 6.7
Entry: 46,343
Stop Loss: 46,539
Take Profit 1 (50%): 45,000
Take Profit 2 (50%): 45,000
Also, if this plays out, I expect NAS and S&P to fall too which will likely drag crypto with it.
Thanks for checking out my post!
I would love to hear if you have any rising wedge trading tips? And if you are trading the Dow Jones or S&P today?
Please note: This is not financial advice. This content is to track my trading journey and for educational purposes only.
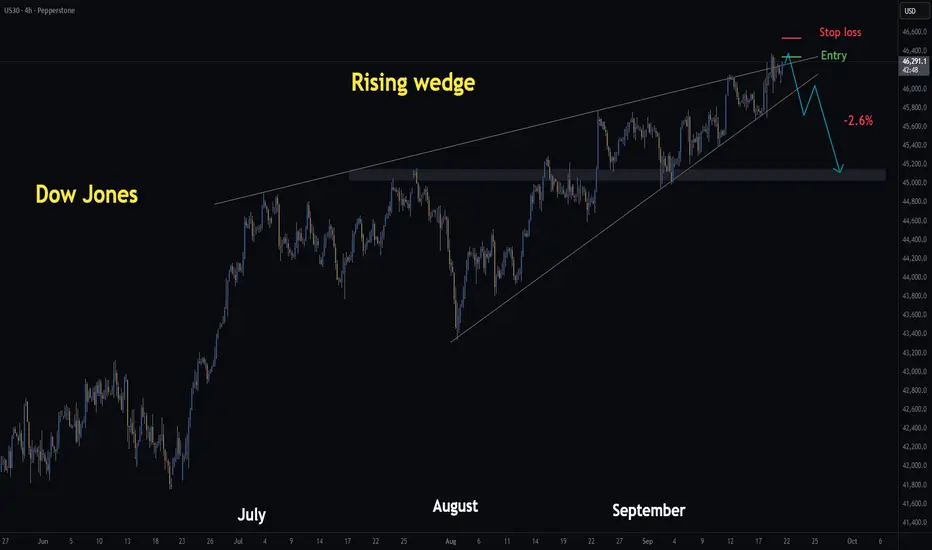
Dow Jones | H4 Rising Wedge | GTRadingMethod👋 Hello Traders.
Yesterday I mentioned I’d be watching for a breakout and retest setup — that plan still stands. However, I’ve also taken a short position off the diagonal resistance line.
🧐 Market Overview:
I’m currently seeing rising wedge structures across Nasdaq, S&P, Russell 2000, and Dow Jones. These patterns typically lean bearish, and I can’t ignore the confluence. That said, wedges can fail, and with the market leaning bullish after of the FOMC announcement, I’m aware this is swimming against the trend.
📊 Trade Plan:
Risk/Reward: 6.7
Entry: 46 267
Stop Loss: 46 450
Take Profit 1 (50%): 45 000
Take Profit 2 (50%): 45 000
(I’m already short from 46 267 and will look to add if price retests that level.)
💡 GTradingMethod Tip:
Bearish patterns like rising wedges can offer high R/R setups, but always remember — strong bullish backdrops (like major data events) can cause them to fail. Risk management is everything.
🙏 Thanks for checking out my post!
Make sure to follow me to catch the next idea and share your thoughts on what you think the markets will do today and how you would trade rising wedges :)
📌 Please note:
This is not financial advice. This content is to track my trading journey and for educational purposes only.
S&P 500 | H1 Rising Wedge | GTradingMethodHello Traders,
Similar to the Dow Jones setup, the US500 is also showing a rising wedge pattern. Yesterday, price broke to the downside and is now retesting the wedge — a classic technical setup.
📊 Trade Plan:
Risk/Reward: 5.4
Entry: 6 653.6
Stop Loss: 6 676.8
Take Profit: 6 526
🧐 Market Overview:
Rising wedges are typically bearish continuation/reversal patterns, and the current retest provides an opportunity to align with that probability. That said, wedges can fail, especially around major news events, so risk management is key specially with markets being bullish after the fomc announcement.
💡 GTradingMethod Tip:
When trading wedge retests, always allow the market to confirm direction. A strong rejection on the retest adds confluence and avoids false breakouts.
🙏 Thanks for checking out my post!
Make sure to follow me to catch the next idea and please share your thoughts — I’d love to hear them.
📌 Please note:
This is not financial advice. This content is to track my trading journey and for educational purposes only.

Lingrid | GOLD Potential Pullback from 3700 Psychological LevelOANDA:XAUUSD faced rejection at the 3,700 resistance zone, signaling exhaustion in the recent bullish leg. The divergence at the highs supports a potential reversal, with price already slipping back toward the mid-range of the upward channel. If momentum continues lower, a breakdown under 3,635 could open the way toward 3,570 as the next key support. Sellers remain favored while price trades below 3,700, keeping the bias tilted downward.
⚠️ Risks:
A sudden risk-off move or geopolitical tension could revive safe-haven demand for gold.
Any dovish Fed shift or weaker US data may fuel a breakout above 3,700 instead.
Strong ETF inflows or central bank demand could limit downside pressure.
If this idea resonates with you or you have your own opinion, traders, hit the comments. I’m excited to read your thoughts!

Lingrid | EURAUD 50% Fibo Rejection Short SignalFX:EURAUD is trading around 1.7820 after a strong rebound from the 1.7598 support and a breakout from the downward channel. The pair is now testing the 1.7872 resistance area, which aligns with the 50% Fibonacci retracement level. A rejection here could trigger a pullback toward 1.7730, while a sustained breakout above 1.7872 may open the way toward the broader resistance zone at 1.8158. The short-term bias remains cautious, with sellers watching this level closely.
⚠️ Risks:
A breakout above 1.7872 may shift control to buyers, invalidating the bearish setup.
Eurozone inflation or ECB policy surprises could strengthen the euro.
Shifts in risk sentiment or AUD volatility may trigger unexpected moves.
If this idea resonates with you or you have your own opinion, traders, hit the comments. I’m excited to read your thoughts!

Lingrid | TONUSDT Channel Border Challenge Potential LongOKX:TONUSDT is consolidating near 3.15 after holding above the key 3.10 upward trendline support. The recent flag structure suggests buyers are preparing to regain momentum, with the projection aiming for 3.30 as the next target. A sustained break above 3.30 would strengthen bullish momentum toward the 3.40 resistance zone. As long as 3.10 holds firm, the bias remains tilted to the upside.
⚠️ Risks:
Failure to hold above 3.10 could shift momentum back to the downside.
Unexpected BTC weakness may cap bullish continuation.
Thin liquidity conditions could amplify volatility around resistance.
If this idea resonates with you or you have your own opinion, traders, hit the comments. I’m excited to read your thoughts!

Undeads (UDS) Bullish Setup: Targeting 3 USD After CorretionSince the beginning of September, UDS (Undeads) has delivered a nice rally of more than +50%, showing strong momentum and growing interest from both gamers and investors.
Built on a solid GameFi and Web3 foundation, Undeads combines a metaverse economy, staking, NFTs, and a post-to-earn model that keeps the community engaged and expanding.
With the native UDS token at the core of the ecosystem, every step of the game’s evolution drives fresh demand: from in-game purchases to staking rewards and community participation.
What makes this project even more attractive is its growing fan base and accessibility, with the game available on Steam, opening the door to mainstream adoption. At the same time, staking opportunities and play-to-earn mechanics add a strong incentive to hold UDS, reinforcing its long-term value proposition.
The fundamentals remain bullish, positioning UDS as one of the standout performers in the GameFi sector. 🚀
________________________________________
Key Question
Is this just the beginning of UDS’s bullish run, or will the current correction push prices lower before the next breakout?
________________________________________
Why a Healthy Correction is Good
• 2 USD resistance: Price just tested this area twice, creating a double top before pulling back.
• Support retest: The 1.35–1.30 zone, which acted as resistance since late August, is now turning into support – a classic technical setup.
• Higher lows structure: Since April, UDS has consistently made higher lows, confirming the broader bullish trend remains intact.
________________________________________
Trading Plan
The correction we see now could provide a better entry zone around 1.35–1.30, aligning with both technical and structural support. As long as this zone holds, bulls remain in control.
A soft target for this bullish scenario stands around 3 USD, which would represent the next key resistance and a natural profit-taking zone for short-term traders.
________________________________________
Final Thoughts
UDS combines strong fundamentals with a clear technical structure: bullish trend, healthy corrections, and expanding adoption. If the 1.35–1.30 support zone holds, we may see the next leg higher toward 3 USD in the weeks ahead.

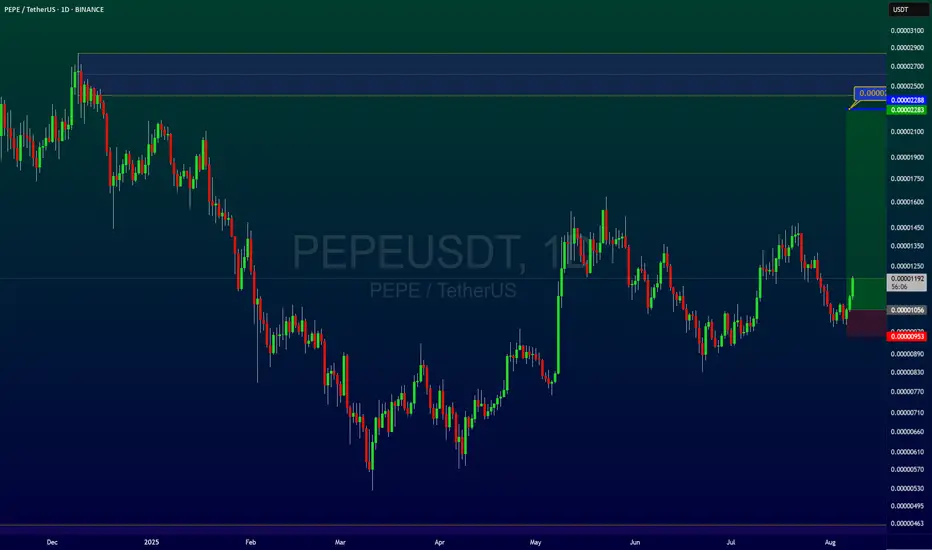
PEPEUSDT AND LONGPOSITIONAnd Pepe is a lovely and popular cryptocurrency and a great buy trading opportunity for the next three to six months with a great risk to reward.
Follow me and boost my analysis for timely and very low risk purchases and great signals.
Contact me in the comments section or private message
XAUUSD and NFP, break or reverse?Today we have NFP and its impact on gold is almost clear now. Based on the price structure and chart, I am waiting for a short or I will enter in advance when I see a good entry.
Stay with me and boost me after introducing me to your friends.

Lingrid | EURJPY Previous Year High Retest ExpectedThe price perfectly fulfilled my previous idea . FX:EURJPY is trading inside an upward channel, holding support above the 173.30 level while steadily pushing higher. The pair recently broke out of a consolidation range and is now eyeing the 174.50 resistance zone, which also aligns with the 2024 high. As long as price remains above the rising trendline, bullish momentum remains intact with potential to extend toward the resistance area. Buyers appear in control, with the structure favoring continuation.
⚠️ Risks:
A breakdown below 173.30 could trigger a deeper pullback toward 172.20.
Shifts in ECB or BOJ monetary policy outlook may cause sharp volatility.
Stronger USDJPY flows could indirectly pressure EURJPY and cap upside momentum.
If this idea resonates with you or you have your own opinion, traders, hit the comments. I’m excited to read your thoughts!

EU50 | H2 Head and shoulders | GTradingMethod👋 Hello Traders,
There is a potential head and shoulders continuation pattern at play.
All my variables have been met and I have opened a short on the EU50.
If the current H2 candle closes above the range, I will close my short position.
Also, stop loss is at 5432.9 in case the H2 candle just blows straight through my entry level and invalidates the head and shoulders pattern.
Bulls do look strong and I was hesitant to enter the trade but my system flagged it and I need to enter every trade, otherwise probability won't play out in my favour.
📊 Trade Plan:
Risk/reward = 5.4
Entry price = 5409
Stop loss price = 5432.9
Take profit level 1 (50%) = 5310
Take profit level 2 (50%) = 5265
💡 GTradingMethod Tip:
Consistency is key. If your system gives a signal, take it — one missed trade can be the difference between your probabilities playing out or missing your edge entirely.
🙏 Thanks for checking out my post!
Make sure to follow me to catch the next idea and share your thoughts — I’d love to hear them.
📌 Please note:
This is not financial advice. This content is to track my trading journey and for educational purposes only.

Hellena | GOLD (4H): SHORT to support area of 3558.Colleagues, gold is in an active upward impulse of big wave “1” and if until now I was only talking about long positions, now it is time to think about the correction in wave “2”.
Wave “1” (red) consists of five waves and, to all appearances, wave “5” (blue) has either completed or is about to complete.
This means that I expect a corrective movement to the 3558 support area. I believe that this is the minimum retracement level, and the price may reach lower values, but we will work for the result, which we will achieve soon.
Manage your capital correctly and competently! Only enter trades based on reliable patterns!

S&P500 |H1 Rising Wedge | GTradingMethodHello Traders, happy Tuesday!
🧐 Market Overview:
I’ve been closely tracking the rising wedge forming on the 1 hour chart. While this isn’t a pattern I normally trade, the structure caught my attention, and I decided to expose a small amount of risk.
Rising wedges are generally bearish in nature - they don't always have to be though. If I zoom out, markets are over bought on the RSI and there are rsi divergences on multiple timeframes. This is one signal that markets need to cool off before advancing further. So bearing in mind the RSI divergences and the bearish pattern, I have decided to risk a small amount.
Further, if this pattern plays out, it will likely bring crypto down with it.
Ideally, I’d prefer to see a clean double top develop before committing more exposure on the short side.
📊 Trade Plan:
Entry: 6 633.7
Stop Loss: 6 648.7
Take Profit: Not predefined (will target structural support levels highlighted on the chart)
🙏 Thanks for checking out my post!
Make sure to follow me to catch the next idea and please share your thoughts – I’d like to hear if anyone else is trading this pattern or if you have any tips on how to trade it.
📌 Please note:
This is not financial advice. This content is to track my trading journey.

XRPUSD: Buy the Dips Above 2.90, Target the ATHAfter printing a new all-time high at the end of July, COINBASE:XRPUSD entered a correction phase that bottomed in early September around 2.70.
From there, the rebound was strong: price broke above the falling trendline and, even more importantly, reclaimed the 3.00 psychological level.
Looking at the broader chart structure since June, the picture is constructive and it’s reasonable to expect further upside — potentially a retest of the previous ATH, or even the making of a fresh one.
📈 Bias: I remain bullish on XRP as long as price holds above 2.90.
🎯 Trading Plan: The strategy here is to buy dips, with the old ATH as the first big target.

Bitcoin Under Pressure, Correction or Breakout Ahead ?Regarding the overall trend, BTC is currently in a corrective phase after a strong rally from March to July, and is now facing a key resistance zone between 114,500 – 117,500 USDT.
🔸 The price failed to break the recent high at 117,500.
🔸 A clear supply order block is visible between 116,500 – 117,300 USDT, acting as strong selling pressure.
🔸 There’s also a partial Fair Value Gap (FVG) between 111,000 – 113,000 USDT, which may get retested.
📈 If BTC breaks above 117,500, the likely scenario is a rally toward the major resistance at 124,000 USDT, where a potential Double Top formation may occur with a possible failed second high.
📉 On the other hand, if support at 114,500 is broken, the price could head toward the strong support zone around 110,000 – 107,000 USDT.
💡 Trade Idea (Short-Term):
Entry: Sell from price ~117,500
🎯 TP1: 114,600 (Consider closing 50% here)
🎯 TP2: If 114,600 breaks, hold the remaining position for a move toward 110,000
SL: Daily close above 117,500 (If this happens, trend flips bullish and a long trade toward 124,000 can be considered).
Please note:
This is not financial advice – I’m only sharing my personal trades.
Always do your own research before taking action.
👍 Don’t forget to like if you found this useful, and feel free to follow me for more analysis of this kind.
Best of luck 🌹

XAUUSD Reversal Signs Grow – Bears Eye 3620/3570In yesterday’s analysis, I pointed out that while OANDA:XAUUSD remains technically bullish, the signs of a potential reversal were already piling up.
That view played out quickly: after spiking above 3700 on the Fed’s decision — which triggered my sell orders — gold reversed sharply, dropping all the way to a local bottom near 3645.
The market then staged a natural rebound after such a violent sell-off, and at the time of writing, price is consolidating around 3655. Interestingly, this was last week’s resistance, now acting as short-term support.
Looking ahead, I believe the correction of the nearly 4,000-pip rally in less than a month is far from over. A fresh drop could be next.
For the bears, the key levels to watch are:
• 3620 – the first checkpoint for potential downside continuation
• 3560-3670 – a stronger support zone I’ve highlighted before, aligning with the 38% Fibonacci retracement of the latest rally
A move towards these levels would still be a healthy correction within the broader bullish context — not at all an out-of-the-question scenario. 🚀

S&P500 | H2 Double Top | GTradingMethodHello Traders,
Watching the S&P for a potential double top.
It also aligns with the retest of the rising wedge, which is has already broken to the downside. This kind of confluence gives me extra excitement about a trade.
What I still need to happen for me to open the trade:
- H2 candle close in the entry range
- H2 candle that closes in the range needs a certain closure rate
- RSI needs to create another divergence
- Volume needs to be lower on T2, although my system does give exceptions if there is a data release, in this case FOMC, so exception will likely apply.
📊 Trade Plan:
Risk/reward = Between 3.3 and 4.3
Entry price = Between 6630 and 6639.9
Stop loss price = Between 6649.2 and 6656.8
Take profit level 1 (50%) = 6576
Take profit level 2 (50%) = 6553
I would ideally like my stop loss above the rising wedge, that way it needs to break through both barriers.
Also, if this pattern plays out, I think it will drag the crypto market down with it... Unfortunately.
💡 GTradingMethod Tip:
Always predefine your risk before entering a trade. This is a non negotiable to becoming a professional trader.
🙏 Thanks for checking out my post!
Make sure to follow me for updates and let me know in the comments — do you see the wedge retest as bearish, or do you think the bulls have more room to run?
📌 Please note: This is not financial advice. This content is to track my trading journey and for educational purposes only.
Peace
G

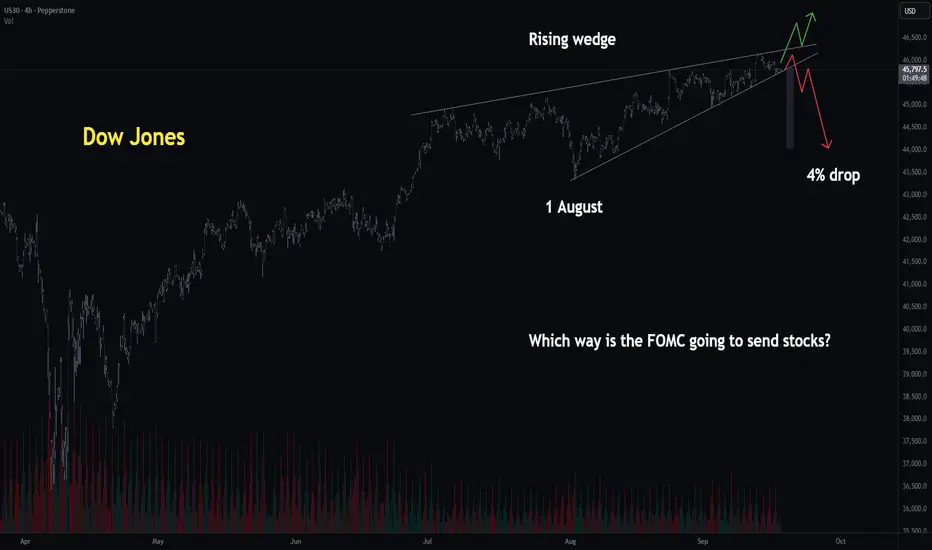
Dow Jones | H4 Rising Wedge | GTradingMethodHello everyone who reads this,
The big question on everyone’s mind: Which way will the FOMC interest rate decision send stocks and gold?
Here’s my two cents and how I plan to approach it.
🧐 Market Overview:
I’m seeing rising wedges on both the Dow Jones and the S&P500 across multiple timeframes. Rising wedges typically lean bearish.
Dow Jones: To play it safe, I’ll wait for a break + retest. If it breaks down, I’ll wait for the retest and then look to go short and vice a versa on the long side.
FOMC generally causes a lot of volatility and I don't want to get whipsawed around, hence I am taking a more conservative approach by trading the retest, which might only happen tomorrow.
S&P500: The hourly rising wedge has already broken to the downside. On the retest, I’ll be watching for short setups. If the retest holds, it would also confirm a double top, which adds further confluence.
If stocks break down on FOMC, expect BTC and alts to feel the pressure.
🙏 Thanks for checking out my post! It would be great to hear what your thoughts are about the interest rate decision and what trades you are looking at. Lets make money together!
📌 Please note: This is not financial advice. This content is to track my trading journey and for educational purposes only.
Gold | H4 Double Top | GTradingMethodHello Traders,
Is Gold about to confirm a double top on the 4H chart?
This pattern could mark the start of a short-term correction, but I’ll only take action if my trading system confirms all the right variables.
Gold has rallied strongly, but momentum looks to be fading. A double top is forming, and with RSI divergence building, this setup has my attention.
Some of the things my system would need to confirm are:
- H4 candle to close in the entry range
- That candle must close with a specific closure rate
- RSI needs to create another divergence
- Lower volume ideally, though this may be exempted due to upcoming data events
📊 Trade Plan:
Risk/Reward: 4.4
Entry: 3 703.0
Stop Loss: 3 719.7
Take Profit 1 (50%): 3 640.4
Take Profit 2 (50%): 3 616.5
💡 GTradingMethod Tip:
When trading double tops, I project the distance from the highest point to the neckline downward to identify profit targets. This keeps my trade plan systematic and objective.
🙏 Thanks for checking out my post!
Follow me to catch the next update and share your thoughts — I’d love to hear how you’re viewing Gold right now.
📌 Please note: This is not financial advice. This content is to track my trading journey and for educational purposes only.

S&P500 | H1 Head and Shoulders | GTradingMethod👋 Hello again fellow Traders,
I already have a short open from 6 633.7, but I’d love to see a Head & Shoulders pattern develop so I can scale into more shorts.
So far, the build-up looks promising — volume has picked up significantly on this drop, which is a bearish signal. That said, I’m still waiting on confirmation before committing further.
📊 Trade Plan:
Risk/Reward: 3.1
Entry: 6 614.3
Stop Loss: 6 625.4
Take Profit 1 (50%): 6 586.9
Take Profit 2 (50%): 6 570.2
🔎 What I Need to See First:
A 30m candle to reach and close in range
Lower volume on the candle that closes in range vs. the left shoulder
More candles forming the right shoulder
💡 GTradingMethod Tip:
Patience is key. The best trades usually come when all conditions align — not just some of them.
🙏 Thanks for checking out my post! Make sure to follow me for updates, and keen to hear what your prediction is.
📌 Please note: This is not financial advice. This content is to track my trading journey and for educational purposes only.

Lingrid | GOLD Record Breaking Rally ContinuesOANDA:XAUUSD is maintaining bullish structure after bouncing from higher lows and breaking through the 3,670 level, reinforcing upward momentum. Price is now consolidating just below the resistance zone, with the upward channel continuing to guide direction. If buyers hold above 3,670, gold could extend its move toward 3,715, aligning with the projected resistance area. The strong impulse leg and supportive trendline suggest that momentum remains with the bulls unless key support is lost.
⚠️ Risks:
A drop back below 3,670 could shift momentum and expose downside toward 3,625.
A stronger US dollar driven by macro data or hawkish Fed commentary may weigh on gold.
Sudden profit-taking near resistance could trigger short-term volatility and a retracement.
If this idea resonates with you or you have your own opinion, traders, hit the comments. I’m excited to read your thoughts!
