Gold Bulls Walking on Thin Ice1. Yesterday’s action
In yesterday’s analysis I said that although the chart looks bullish, Gold bulls should be very careful. After all, price had already climbed 4,000 pips in less than a month, and such complacency usually doesn’t end well.
During yesterday’s session, XAUUSD spiked above 3700, quickly reversed, and touched the newly formed support at 3675. From there, price attempted another push higher. Now we are once again back at support.
2. Key question
Will the 3670 zone hold, or are bulls about to lose control of the market?
3. Why caution is needed
• The chart is still bullish overall, but the structure is becoming increasingly concerning.
• If bulls lose the 3670 zone, I don’t expect a quick rebound from 3650.
• Instead, the market is more likely to continue lower, with at least a move toward 3620.
4. Trading plan
• From my perspective, buying here is very risky, even riskier than selling.
• I remain out of the market, waiting for a GOOD entry to sell.
• My target is a 700–1000 pip as usual, which I believe will come to the downside, not the upside.
5. Conclusion
Gold’s chart may still look bullish, but risk is shifting quickly. Chasing longs here could be dangerous — patience and discipline are key until the right sell opportunity appears 🚀
Signalservice

NZDUSD: A Slow Pair, but a Clear Setup1. What happened before
Although NZDUSD has been a very slow mover lately, the pair remains highly technical. Looking back, the broader downtrend started in 2014, with the decline visible on the chart since 2021. The most recent leg down began exactly one year ago and ended in April at 0.55 – a level that coincided with both the pandemic low and the October 2022 bottom.
2. Key question
Has NZDUSD finally built a foundation for a bullish continuation, or will the market remain trapped in its slow range?
3. Why upside continuation looks possible
• The rebound from April low reached 0.61 resistance before pulling back.
• Importantly, the pullback stopped at 0.58, forming a higher low and aligning with an old support.
• The new rise that followed confirms strong demand at 0.58, suggesting momentum may continue to the upside.
4. Trading plan
• The pair is bullish above 0.58.
• First upside target: 0.61 resistance.
• Longer-term soft target: 0.64.
• Patience is required – NZDUSD is a slow pair, and such a move needs time to develop.
5. Conclusion
NZDUSD might not be the fastest market, but its technical precision makes it worth watching. Above 0.58, the bias stays bullish, with the market slowly but surely building a case for higher levels 🚀

Lingrid | EURUSD Trend Extension: Continuation OpportunityThe price perfectly fulfilled my previous idea . FX:EURUSD is trading inside its upward channel, maintaining a sequence of higher lows that confirm bullish structure. Price is currently hovering above the 1.1695–1.1700 support zone, with the upward trendline acting as a critical base for continuation. A successful defense here could trigger a rally toward 1.1805 and potentially the 1.1850 resistance area. However, repeated failures to sustain momentum above mid-channel levels show that buyers face strong resistance overhead. The broader setup still favors upside as long as 1.1690 holds firm.
💡 Risks:
A breakdown below 1.1690 would invalidate the bullish channel and expose downside toward 1.1560.
Stronger US economic data or hawkish Fed commentary could boost USD, pressuring EURUSD lower.
Weakness in eurozone fundamentals could limit buying strength and stall continuation attempts.
If this idea resonates with you or you have your own opinion, traders, hit the comments. I’m excited to read your thoughts!

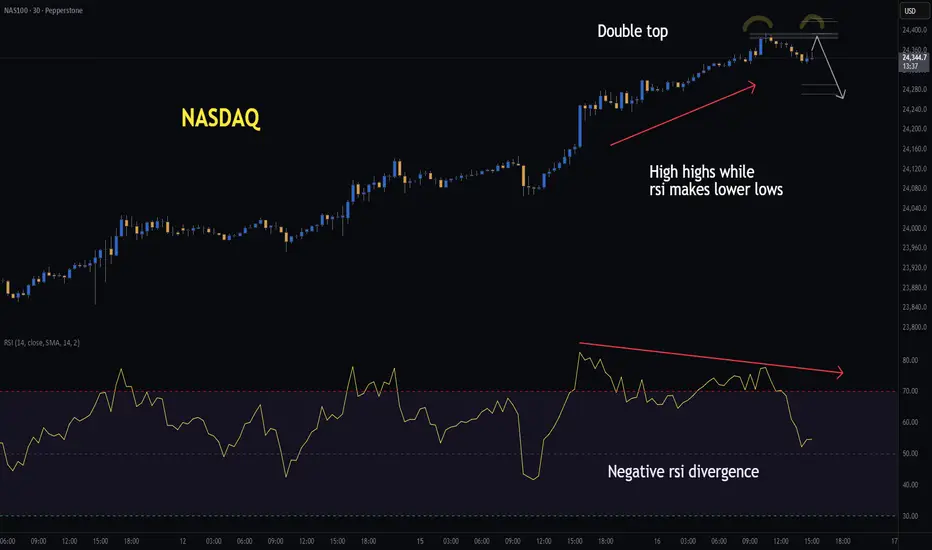
NASDAQ | H1 Double Top | GTradingMethodHello Traders,
I’m watching the Cash100 for a potential double top that could set up a short opportunity. Price is currently making higher highs while RSI is making lower lows — a clear sign of weakening buying momentum, also known as negative RSI divergence.
As further confluence, we have the FOMC tomorrow, and markets often prefer to de-risk ahead of such events. Also, there is a rising wedge on the S&P500 on the hourly chart and the chance that there is also a potential double top on the 30min timeframe.
✅ Conditions before entry:
- 30min candle must close within the range and at the correct level
- The closing candle must meet my required closure rate
- Ideally, volume should be lower (though I’ll allow an exception given it will be the U.S open)
- RSI should confirm with another divergence
📊 Trade Plan:
Risk/Reward: 2.9
Entry: 24,385.1
Stop Loss: 24,418.6
Take Profit 1 (50%): 24,290
Take Profit 2 (50%): 24,271
💡 GTradingMethod Tip:
Patterns like double tops are powerful, but they’re strongest when combined with momentum divergence. Always confirm multiple factors before entering.
🙏 Thanks for checking out my post!
Follow me for the next update and feel free to share your thoughts below — I’d love to hear them.
📌 Please note: This is not financial advice. This content is to track my trading journey and for educational purposes only.
Lingrid | USDJPY Quick Bullish Move PotentialFX:USDJPY has rolled over from its lower high near the downward trendline and is now pressing into the 146.54 support zone. The broader pattern reflects prolonged consolidation with repeated failures to reclaim the 148.75 resistance area. If buyers cannot defend 146.50, price risks slipping further toward the 145.85 support level. A corrective bounce toward 147.20 is possible, but overall momentum leans bearish as long as price stays capped under the descending trendline.
💡 Risks:
A surprise shift in Fed policy or stronger US economic data could fuel dollar strength, lifting USDJPY back above 147.20.
Intervention risk from the Bank of Japan may trigger sharp volatility against short positions.
Broader risk-on sentiment in global markets could weaken JPY demand and stall downside momentum.
If this idea resonates with you or you have your own opinion, traders, hit the comments. I’m excited to read your thoughts!

Lingrid | ETHUSDT Pullback Entry Continuation SetupBINANCE:ETHUSDT is trading above its key support at 4,400 after a rebound from the upward trendline, showing resilience despite recent pullbacks. The structure highlights a breakout from the falling wedge and the formation of higher lows, signaling accumulation before continuation. If buyers defend 4,390, momentum could lift price toward 4,750 and potentially retest the broader resistance zone near 5,000. The overall outlook remains bullish as long as Ethereum holds above its trendline support.
💡 Risks:
A breakdown below 4,390 would weaken bullish momentum and expose downside toward 4,000.
Sharp volatility in Bitcoin could spill over into Ethereum, limiting upside potential.
Negative regulatory or macroeconomic news may trigger selling pressure across crypto markets.
If this idea resonates with you or you have your own opinion, traders, hit the comments. I’m excited to read your thoughts!

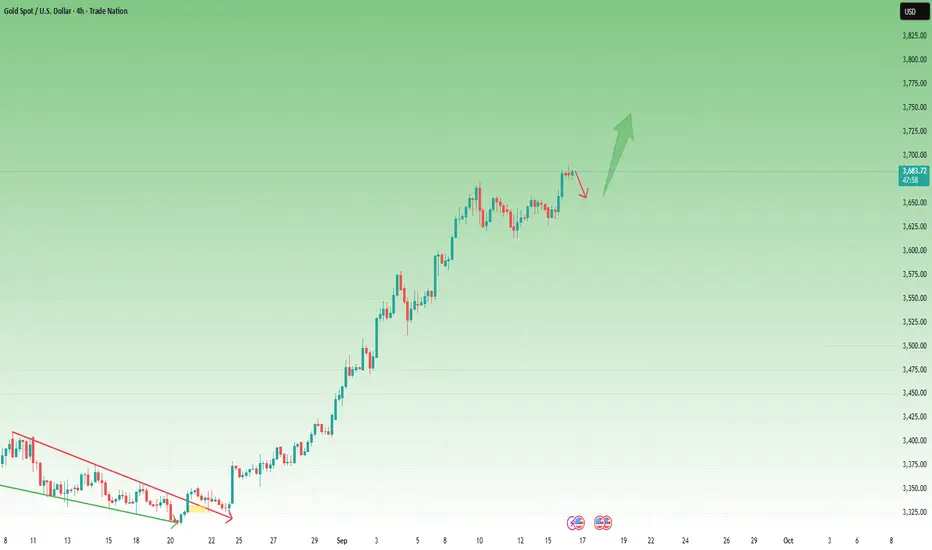
Complacency Before the Fall? Bulls in Control, But For How Long?Yesterday, I was debating whether last week’s consolidation was a rectangle (suggesting continuation) or, in fact, a triple top (hinting at correction). I began the session with a slightly bearish bias, but the reversal from support and the subsequent breakout above the consolidation’s resistance forced me to reevaluate. The breakout was clean, momentum followed, and the market even printed a new ATH at 3689.
Unfortunately, my pending buy order wasn’t filled, so I remain flat for now—an important reminder that in trading, sometimes discipline keeps you safe, even if you miss an opportunity.
Technical outlook:
• Price broke above resistance, confirming bullish control.
• The 3660 zone now acts as key support—any dips into that area can be treated as potential buying opportunities.
• The measured target for this breakout points toward 3710, which could represent the next objective for the bulls.
But here’s the psychological twist:
The market feels euphoric and complacent at this moment. Historically, reversals from this type of mindset tend to be brutal. Traders get comfortable, start believing in endless uptrends, and that’s exactly when the trapdoor opens.
Medium-term, I still anticipate a significant correction. Timing it is always the hardest part, but acknowledging the risk helps keep emotions under control. For now, bulls clearly hold the wheel—but they may not realize they’re driving toward a cliff.
🚀 Stay sharp, trade the trend, but don’t forget that markets punish overconfidence.
BTCUSD – Healthy Correction Before the Next Rally?Hi everyone, Ken here!
Technically, BTCUSD is trading within a clearly defined ascending channel, with a bullish rhythm that’s hard to overlook. The recent retracement reflects a healthy correction, potentially setting the stage for the next upward move.
Price is now approaching a key support zone, marked by the lower boundary of the channel and a prior demand area. If this level holds, it could provide buyers with a strong re-entry opportunity. The next upside target is around 118,600, aligning with the channel’s upper boundary.
Of course, momentum may not appear right away — the market could consolidate, produce false breakdowns, or even accelerate sharply without much warning.
Bottom line: The uptrend remains in control. This pullback looks more like a step back to gather strength than a signal of reversal.
Good luck and happy trading!

SOL The Whales are Selling at This Strong Resistance Level 230$SOL Current Market Update
The coin is now facing a very strong resistance around $230 .
This presents a great short opportunity .
After carefully monitoring buy and sell orders on-chain, I noticed a strong confirmation for the short setup:
Whales and Market Makers sell orders are clustered heavily around the $228 – $230 resistance zone.
✅ My Personal Strategy:
Short Entry: Resistance zone between $228 – $230
🎯 Target 1: $220
🎯 Target 2: $216
Please note:
This is not financial advice – I’m only sharing my personal trades.
Always do your own research before taking action.
👍 Don’t forget to like if you found this useful, and feel free to follow me for more analysis of this kind.
Best of luck 🌹

XAU/USD Stalls Slightly above 3650 – Bulls Losing Steam?Gold printed fresh all-time highs at 3674 last week, only to reverse sharply and settle into a sideways structure between 3620–3655.
The current debate: is this simply a consolidation box that will fuel another breakout, or is the market quietly building a distribution top that could resemble a triple top pattern (if we ignore the spike to ATH)?
Technically, the momentum has clearly cooled. The 3355–3360 area continues to cap the upside, turning into a stubborn barrier that bulls haven’t been able to overcome.
From a fundamental angle, the Fed’s rate cut is already baked into the price. The focus is now on Powell’s guidance. With inflation pushing higher, a cautious and balanced tone is more likely than a dovish surprise.
Cross-checking with other pairs, XAU/EUR and XAU/GBP are already pressing their support levels. That relative weakness suggests the gold complex as a whole may be closer to a downside break than to a new leg up.
For now, I’m flat. But unless bulls regain control quickly, I’ll be watching for failed rallies after London open as potential short setups.

S&P500 | H1 Rising Wedge | GTradingMethodHello again Traders
🧐 Market Overview:
The S&P is forming a rising wedge on the 1H chart. I don’t usually trade this pattern, but with the price approaching the wedge top, I see a potential short opportunity worth a small risk.
On the 4H chart, there’s an even larger rising wedge at play. My instinct is still that this could turn into a fake-out, so I’m monitoring lower timeframes for short setups that align with the bigger picture.
📊 Trade Plan:
Risk/Reward: 9.45
Entry: 6 621.4
Stop Loss: 6 631.0
Take Profit 1 (50%): 6 546.2
Take Profit 2 (50%): 6 487.4
🙏 Thanks for checking out my post!
Make sure to follow me to catch the next idea and please share your thoughts – I’d like to hear them.
📌 Please note:
This is not financial advice. This content is to track my trading journey and for educational purposes only.

Lingrid | GBPJPY Bullish Momentum Setup - Long BiasThe price perfectly fulfilled my previous idea . FX:GBPJPY is trading within its upward channel, recently rebounding from the 199.70 support and holding above the upward trendline. The structure shows a level breakout after a consolidation phase, pointing toward a continuation attempt higher. If momentum holds, buyers may drive the pair toward 200.55 and potentially test the 201.00 resistance zone. As long as the price respects the channel, the bullish bias remains valid with upward pressure intact. The broader context shows strong buyer defense at key levels, reinforcing continuation potential.
💡 Risks:
A breakdown below 199.70 would weaken bullish momentum and open the way toward 198.65 support.
Hawkish commentary from the Bank of Japan could strengthen JPY and cap GBPJPY upside.
Global risk-off sentiment may trigger demand for JPY as a safe haven, pressuring the pair lower.
If this idea resonates with you or you have your own opinion, traders, hit the comments. I’m excited to read your thoughts!

S&P500 | H1 Double Top | GTradingMethod👋 Hello traders,
Tried shorting a potential head and shoulders on the 1H chart earlier — it failed. Thankfully, one of my exit rules triggered before my stop loss, so the loss was small, but still not pleasant. That’s trading.
🧐 Market Overview:
The bigger picture remains the same. On the detailed side, I am looking for a potential double top on the hourly chart. RSI is making lower highs while price is making higher highs, which shows weakening buying momentum. For me, this is a non-negotiable variable when trading double tops and head & shoulders setups.
I’ll be waiting for a candle closure in my entry range, alongside a few more confirmations, before taking the next shot. Patience is key here.
📊 Trade Plan:
Risk/Reward: 3.4
Entry: 6 598.4
Stop Loss: 6 608.3
Take Profit 1 (50%): 6 567.9
Take Profit 2 (50%): 6 557.9
💡 GTradingMethod Tip:
Losses are part of the process. The key is to keep them small, stick to your rules, and wait for probability to play out over time.
🙏 Thanks for checking out my post!
Follow me to catch my next setup, and let me know — do you think this head and shoulders will confirm, or will buyers push the S&P to fresh highs?
📌 Disclaimer:
This is not financial advice. This content is to track my trading journey and for educational purposes only.

S&P500 | H1 Head and shoulders | GTradingMethodHello Traders.
🧐 Market Overview:
I am still holding a short on the rising wedge visible on the 4-hour chart. While the S&P 500 has broken out to the upside of the wedge, there’s still a real chance this could be a fake out.
The RSI is showing overbought conditions across the 1H, 2H, and 4H timeframes, which makes it difficult for price to push higher without cooling off first. From a probability standpoint, I see the short as more favorable here than chasing longs.
With hindsight I should have waited for a reversal pattern to open shorts when trying to trade the risking wedge on the 4 hour chart.
If the head and shoulders pattern on the 1H chart fails, then a possible double top on the 2H chart may form. I’ll post an update if that scenario plays out and I have time.
NB! I do not have confirmation to enter the head and shoulders short yet. It is only on my radar for now.
📊 Trade Plan:
Risk/Reward: 3.8
Entry: 6 589.7
Stop Loss: 6 599
Take Profit 1 (50%): 6 560.2
Take Profit 2 (50%): 6 544.2
💡 GTradingMethod Tip:
A favorable setup doesn’t guarantee success, but managing risk and aligning with probability is how I stay consistent over the long term.
🙏 Thanks for checking out my post!
Make sure to follow me to catch the next idea and please share your thoughts — I’d like to hear them.
📌 Please note: This is not financial advice. This content is to track my trading journey and for educational purposes only.

Lingrid | GOLD Weekly Market Analysis - FOMC Catalyst AheadThe price perfectly fulfilled my previous weekly idea . OANDA:XAUUSD maintained its upward trajectory this week as investors positioned ahead of anticipated dovish policy shifts from major central banks, particularly the Federal Reserve. The precious metal's resilience signals growing expectations for an accommodative monetary environment that typically weakens fiat currencies and enhances gold's appeal.
Price action analysis reveals gold operating within a well-defined upward channel, with the metal successfully breaking above the triangle consolidation pattern near $3,440. The breakout of this formation, combined with bullish momentum indicators, suggests the path of least resistance remains to the upside. Key resistance now sits at the $3,700 ATH level, while the higher low structure around $3,275 provides critical support.
4H chart shows gold trading above a strategic swap zone between $2,580-$2,600, indicating institutional accumulation ahead of the Fed's rate decision. Monday's brief sell-off may occur showing profit-taking rather than a trend reversal, as buyers quickly might step in to defend these support levels.
With the Federal Reserve expected to signal a more accommodative stance, gold's fundamentals align with technical strength. The metal's ability to hold above the triangle breakout zone reinforces bullish conviction, targeting the psychological $3,700 resistance and higher levels. Any Fed dovishness should provide the catalyst for the next leg higher, potentially reaching new all-time highs as real yields decline and dollar weakness accelerates.
If this idea resonates with you or you have your own opinion, traders, hit the comments. I’m excited to read your thoughts!

Lingrid | BTCUSDT Swap Zone Break - Bull Signal ActiveThe price perfectly fulfilled my previous idea . BINANCE:BTCUSDT has closed above the swap zone around 112,000 and is holding above the upward channel trendline, signaling renewed bullish momentum. The breakout from the prior triangle pattern and formation of a higher low strengthen the case for continuation. If buyers sustain control, price could retest 123,000 before attempting the broader resistance area near 130,000. The overall structure points to a bullish phase, with consolidation likely to act as a base for further upside.
💡 Risks:
A drop back below 112,000 would weaken the bullish setup and expose downside toward 100,000 support.
Hawkish US monetary policy or stronger-than-expected macro data could pressure risk assets, including Bitcoin.
Broader crypto market weakness or heavy profit-taking at resistance zones may limit upside momentum.
If this idea resonates with you or you have your own opinion, traders, hit the comments. I’m excited to read your thoughts!

Bitcoin Short Opportunity Before the Next Leg UpBitcoin is currently showing noticeable weakness in buying momentum.
Most likely, it will drop to the 113K–112K area to retest before moving higher again.
✅ My Personal Strategy:
Entry (Sell): 115,600
🎯 Target 1: 114,000
🎯Target 2: 113,600
Stop-Loss: Daily close above 117,400
Please note:
This is not financial advice – I’m only sharing my personal trades.
Always do your own research before taking action.
👍 Don’t forget to like if you found this useful, and feel free to follow me for more analysis of this kind.
Best of luck 🌹

Bitcoin to $150K ? Mining Difficulty Holds the KeyUnlike Ethereum, Bitcoin’s mining difficulty has always marched higher alongside price. This natural cycle reflects a simple truth: as the price climbs, more miners join the network, competition grows, and blocks become harder to produce.
📈 Historical Patterns
2017 Bull Run → Price exploded while difficulty surged. Even after corrections, difficulty never reversed its long-term uptrend.
2021 Recovery → Despite China’s mining ban, difficulty quickly rebounded to new highs, fueling Bitcoin’s rally back from $30K.
2023–2025 Cycle → With Bitcoin pushing to new records, difficulty has now reached an all-time high of 136T, signaling massive investment and long-term confidence.
Why Rising Difficulty Is Bullish
Miner Confidence → Expanding operations show miners expect higher prices ahead.
Reduced Selling Pressure → Higher costs mean miners prefer to sell at elevated levels, reinforcing upward momentum.
Proven Signal → Historically, price accelerations often followed major spikes in difficulty.
The Short-Term Risk
If prices stagnate while costs rise, weaker miners may shut down, creating temporary selling pressure. But historically, this has only made the network stronger and healthier over time.
Outlook: $150K and Beyond?
With Bitcoin trading around 115K and strong support $110K and difficulty at historic highs, the setup resembles past cycles that led to explosive upside. Each surge in difficulty has paved the way for new price records — making $150,000 look less like a dream and more like the next logical step.
🔥 Bottom Line: Record-high mining difficulty has consistently been a medium-to-long term bullish signal. If history rhymes, Bitcoin could be gearing up for its next major leg higher — and $150K might just be the beginning.
Do you think Bitcoin will hit $150K this cycle?
This post is for educational and informational purposes only and should not be considered financial or investment advice.
Always do your own research .
Best Regards

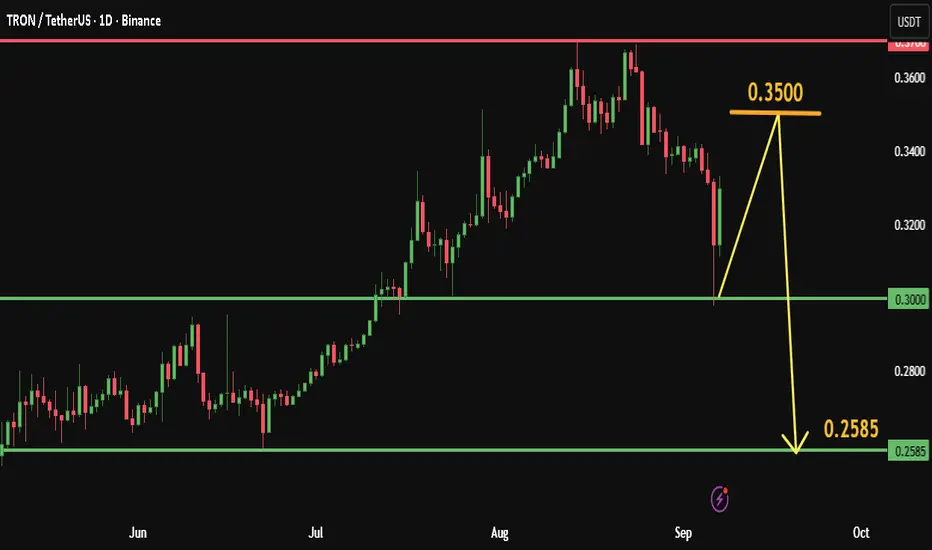
TRX Will Test Resistance Before drop, Liquidity Weakness SignalsI’ve noticed over the past few days that liquidity indicators on the TRON network (TVL – Total Value Locked) have started to decline significantly.
Outflows from lending protocols and centralized exchanges are usually a short-term weakness signal, since it means that funds previously locked are now being pulled out.
📊 On the TRX/USDT chart, the price is currently ranging between the strong resistance at 0.3700 and the solid support at 0.3000.
🔼 The price may rise to test the resistance level at 0.3500,
then potentially retrace back toward 0.3000.
The main support is around 0.3000; if broken, it could push the price down to the next support at 0.2585.
Liquidity behavior often precedes price movement.
Personally, as someone who focuses on liquidity analysis and market maker activity, I believe that continued outflows could put more pressure on TRX. However, if large wallets step back in, this could quickly turn into a bullish opportunity.
The question is:
Do you think TRX is really under short-term pressure ?
Or is this just a shakeout before the next rally ?
✅ Write a comment with your favorite altcoin hit the like button, and I'll provide my analysis in the reply. Trading is simpler with the right coaching.
My analyses are personal opinions, not trade setups.
Thank you for your support, and I wish you successful trades 🌹
XRP Bulls Are Back, Double Bottom + Divergence Signal Uptrend
XRP , After failing to break the previous low, which acted as a strong support at $2.7280, XRP has formed a Double Bottom pattern. This is a powerful bullish signal expected to push the price higher.
The price is currently rising to test the daily descending trendline shown in the chart, with a potential target of the $3.04000 zone. The bullish move is also confirmed by a Divergence pattern on the daily chart.
Additionally, the daily RSI shows an overbought signal, which can be a sign of strong buying pressure. This movement is also supported by the overall daily uptrend illustrated in the chart.
🔔 Summary:
Key Factors Supporting an Upside Move
Double Bottom Pattern
Daily Divergence
Uptrend
Daily RSI Overbought Signal
✅ Write a comment with your favorite altcoin hit the like button, and I'll provide my analysis in the reply. Trading is simpler with the right coaching.
My analyses are personal opinions, not trade setups.
Thank you for your support, and I wish you successful trades 🌹

Lingrid | HBARUSDT Breaking Higher - Continuation PatentialThe price perfectly fulfilled my previous idea . BINANCE:HBARUSDT has rebounded strongly from the bottom near 0.2100 and is now pressing against the downward trendline, showing signs of recovery momentum. The breakout attempt above 0.2439 signals growing bullish pressure, with buyers targeting the resistance zone around 0.2757. If price sustains above the breakout level, a continuation rally is likely as the broader structure shifts from accumulation to trend reversal. The pattern highlights strength after prolonged consolidation, with bulls aiming to challenge overhead resistance.
💡 Risks:
Failure to hold above 0.2439 could trigger a pullback, sending price back toward 0.2104 support.
A sharp decline in Bitcoin or major altcoins could drag HBAR lower despite technical strength.
Negative crypto market sentiment or regulatory news could weigh on buying momentum and stall the breakout.
If this idea resonates with you or you have your own opinion, traders, hit the comments. I’m excited to read your thoughts!

NASDAQ | H2 Double Top | GTradingMethodHello Traders! 👋
🧐 Market Overview:
CPI is out today — and it could be the spark the NASDAQ needs. Price is stalling at the previous all-time high, and that’s where I’m watching closely.
I’ve been tracking a double top on the daily for a while now, and today the H2 chart is starting to show the same structure. That kind of multi-timeframe alignment doesn’t happen often.
📊 Trade Plan:
I’ve entered a starter short on the daily structure. If the H2 confirms, I’ll scale in with a second position.
Risk/Reward:
Entry:
Stop Loss:
Take Profit 1 (50%):
Take Profit 2 (50%):
💡 GTradingMethod Tip:
Double tops work best when paired with other signals. In my system, I look for:
- RSI negative divergence
- Lower volume on the second top
- A confirmation candle close within my entry range
This reduces false signals and adds conviction.
🙏 Thanks for reading! Do you trade double tops?
📌 Disclaimer:
This is not financial advice. This content is to track my trading journey and for educational purposes only.

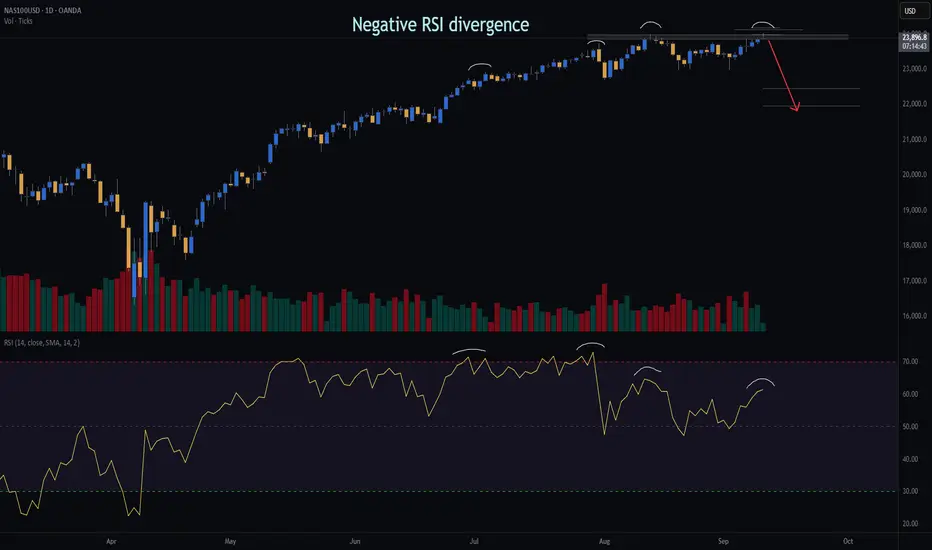
NASDAQ | Daily Double Top | GTradingMethodHello Traders 👋
🧐 Market Overview:
I’ve opened a short on the NASDAQ based on a clear double top setup that formed yesterday. Several of my key variables aligned, giving this trade a high-probability edge:
Negative RSI divergence → showing weakening buying momentum
Lower volume on the second top → indicating exhaustion
Daily candle closure within threshold → confirming structure validity
📊 Trade Plan:
RR: 9.1
Entry: 23 931
Stop Loss: 23 178
Take Profit 1 (50%): 22 453
Take Profit 2 (50%): 21 969
💡 GTradingMethod Tip:
When trading reversal patterns like double tops, I always wait for confirmation across multiple variables (momentum, volume, candle structure). This increases probability and reduces false entries.
🙏 Thanks for checking out my post!
Follow me for more setups and let me know — do you see this double top holding, or is there more upside left in the NASDAQ?
📌 Disclaimer:
This is not financial advice. This content is to track my trading journey and for educational purposes only.