Solana at the Gates of Breakout- 250-300 in sight1. What happened lately
After the sharp drop that started on July 23 and bottomed at 155 in early August, Solana has shown strong recovery.
The rebound pushed price back to the 207 resistance zone, followed by a pullback to 175, confirming it as a solid demand area. Yesterday, in line with the entire crypto market, SOLUSDT rallied strongly, and today, after a quick dip below 200, buyers stepped back in, pushing price once again toward resistance.
2. The key question
Is Solana ready to finally break above resistance and continue higher into a new bullish leg?
3. Why I expect continuation to the upside
• Positive fundamental backdrop across the crypto sector.
• Constructive technical structure with consecutive higher lows since April.
• 175 confirmed as a strong support zone, with buyers stepping in twice this month.
• 207 resistance under pressure again, showing growing bullish momentum.
4. Trading plan
As long as the daily close holds above 190, Solana remains firmly bullish.
A clear breakout above 207 could open the path toward 250, and in a more extended scenario, even 300 in the medium term.
Signalservice

Lingrid | GOLD Broke Above Corrective Dynamic ResistanceOANDA:XAUUSD is attempting to recover after a strong sell-off from the resistance zone, with price currently testing the compression channel breakout. Structure highlights a descending sequence with a lower high, flag formations, and a downward trendline keeping the sideways tone intact. If the breakout holds above the compression channel, price could push toward 3,380, but rejection may open room back into deeper support. Broader momentum shows a corrective bearish leg softening, with potential bullish relief rally if buyers defend current levels.
📉 Key Levels:
Buy trigger: Sustained breakout above 3,320 support-turned-resistance.
Buy zone: 3,320–3,330, if buyers maintain control after breakout.
Target: 3,380 near-term resistance.
Invalidation: Breakdown below 3,250 would negate bullish setup.
💡 Risks:
Failure to sustain breakout, leading to continuation of the downtrend.
Strong USD momentum from macroeconomic releases could weigh on gold.
Geopolitical risk shifts that reprice safe-haven demand unpredictably.
If this idea resonates with you or you have your own opinion, traders, hit the comments. I’m excited to read your thoughts!

Gold Analysis – Slight Bearish Bias After Failing at 3350Yesterday I wrote that after the false break and the bullish daily engulfing, Gold could reverse to the upside and the correction that started from the 3400 zone might have been finished.
With this idea in mind, I went long, and the entry turned out to be a real sniper one as Gold started to rise strongly exactly after my entry, reaching once more the 3350 zone.
Here, however, price action turned “boiling” and, in the end, bulls couldn’t push through decisively.
After another attempt to conquer 3350 at the beginning of the Asian session, Gold failed again. During the night (my night), I decided to close my trade with +120 pips profit. It was not the outcome I expected, but still a positive one.
Looking back, this decision seems correct so far since price is now back around my entry level from yesterday.
________________________________________
Where Do We Go From Here?
So far, the week has no resolution. Neither bulls nor bears are in full control.
However, after the repeated failure to break 3350, my outlook leans slightly bearish at this moment.
• Plan: I will look to sell rallies during the day if I can find a good risk:reward setup.
• Target: 3280 is the bearish objective.
• Invalidation: If bulls finally manage to resolve the 3350 level, this outlook is negated.
________________________________________
Final Note:
Gold has become very unpredictable these days. What is true at the time of posting could change quickly during the session. That’s why I update my analyses during the day.
👉 If you want to be notified of these updates, don’t forget to like this idea.
💬 And if you have questions, feel free to use the comment section — I will try to respond to all.
🚀
Disclosure: I am part of TradeNation's Influencer program and receive a monthly fee for using their TradingView charts in my analyses and educational articles.

Lingrid | EURAUD Buying Opportunity at Psychological LevelFX:EURAUD is holding its bullish structure after bouncing from the 1.8000 zone and respecting the upward trendline. The pair remains within an ascending channel, with a higher high confirming strong momentum. As long as the 1.8000 support holds, the price outlook favors a move toward 1.8190. Broader momentum suggests continuation of the bullish cycle while the trendline remains intact.
📉 Key Levels
Buy trigger: Rejection above 1.8000 support and trendline hold
Buy zone: 1.8000 – 1.8010
Target: 1.8190
Invalidation: Break below 1.7810
💡 Risks
A strong reversal in EUR fundamentals could weaken the bullish setup.
Unexpected RBA statements or AUD strength may invalidate the trendline support.
Global risk sentiment shifts could drive flows away from EUR pairs.
If this idea resonates with you or you have your own opinion, traders, hit the comments. I’m excited to read your thoughts!

Lingrid | TONUSDT Base Building For ExpansionOKX:TONUSDT is holding inside an upward channel while building momentum above the $3.20 support zone. The structure shows a series of higher lows with price consolidating under the descending resistance trendline. A sustained defense of $3.20 could open room for an upside push toward $3.52. Broader bullish momentum aligns with continuation potential as long as support remains intact.
📉 Key Levels
Buy trigger: Break above descending resistance near $3.40
Buy zone: $3.20–$3.25 support region
Target: $3.52
Invalidation: Break below $2.92
💡 Risks
A failed breakout at $3.40 may lead to renewed downside pressure.
Macro uncertainty around U.S. dollar strength could weigh on momentum.
If volume weakens, the ascending structure may transition into sideways consolidation
If this idea resonates with you or you have your own opinion, traders, hit the comments. I’m excited to read your thoughts!

Hellena | EUR/USD (4H): LONG to the resistance area 1.18098.We are observing the development of a five-wave impulse in the medium-term wave “2”.
The small wave “1” appears to be completing its movement, and I expect a correction in wave ‘2’ to the area of 1.15681, followed by a continuation of the upward movement in wave “3”. The minimum target for the movement is the resistance area of 1.18098.
I do not rule out the fact that wave “1” is not yet complete, so there is a possibility of the upward movement continuing without correction.
Manage your capital correctly and competently! Only enter trades based on reliable patterns!

Hellena | Oil (4H): SHORT to support area of 60 (Wave "3").Wave “C” continues to develop in a five-wave movement. Right now, I think wave “1” has just ended and we will see a small correction to the 66,280 area (wave ‘2’), after which I expect wave “3” to develop, which should go further than the 60 support level, but this is a fairly strong psychological level at which it would be good to take profits.
Manage your capital correctly and competently! Only enter trades based on reliable patterns!

XAUUSD – Bullish Outlook Confirmed1. Yesterday’s Context
In my yesterday’s analysis, I mentioned that although Gold had broken below the 3330 support, it was most probably a false break.
Yesterday’s price action confirmed this view: Gold pushed back above the broken level, accelerated higher, and even broke above the falling wedge trendline, reaching a high around 3352. On top of that, the daily chart closed with a strong bullish engulfing pattern.
________________________________________
2. The Key Question
Is this the start of a larger bullish continuation?
________________________________________
3. Why the Setup Looks Bullish
• False break below 3330 quickly reversed.
• Break above the falling wedge trendline = strong bullish signal.
• Daily bullish engulfing confirms momentum shift.
• Technical structure now favors continuation to the upside.
________________________________________
4. Trading Plan
At the time of writing, Gold is in a normal correction after yesterday’s strong rally.
• I remain bullish.
• I am looking to buy dips into support zones.
• Target: around 3380 as the next upside level of interest.
________________________________________
5. Final Note 🚀
The outlook remains unchanged: the bias is bullish, and yesterday’s breakout gives conviction that buying dips is the right strategy.
Disclosure: I am part of TradeNation's Influencer program and receive a monthly fee for using their TradingView charts in my analyses and educational articles.

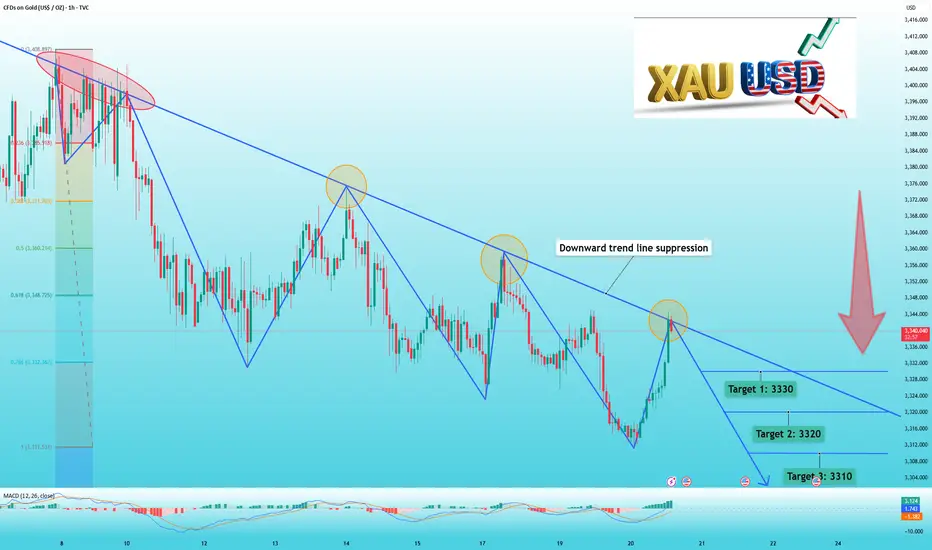
Gold hits resistance, Sell nowShort-term factors impacting the decline in gold prices:
1: The Russia-Ukraine situation has returned to the negotiating table under Trump's leadership.
2: At the Jackson Hole annual meeting, the market is almost unanimous in its belief that Powell will deliver hawkish remarks.
3: Both gold and silver ETFs have seen reductions in holdings.
4: Gold is under obvious technical pressure.
From the 1-hour chart, we can clearly see a downward trend line for gold prices. After repeatedly touching this trend line, gold prices have fallen. Now that it's near this trend line again, I believe it's a good time to sell.
🏆The operation settings are as follows:
📉📉📉Sell around 3345-3350
✅Target 1: 3330
✅Target 2: 3320
✅Target 3: 3310
📣If you have different opinions, please leave a message below to discuss
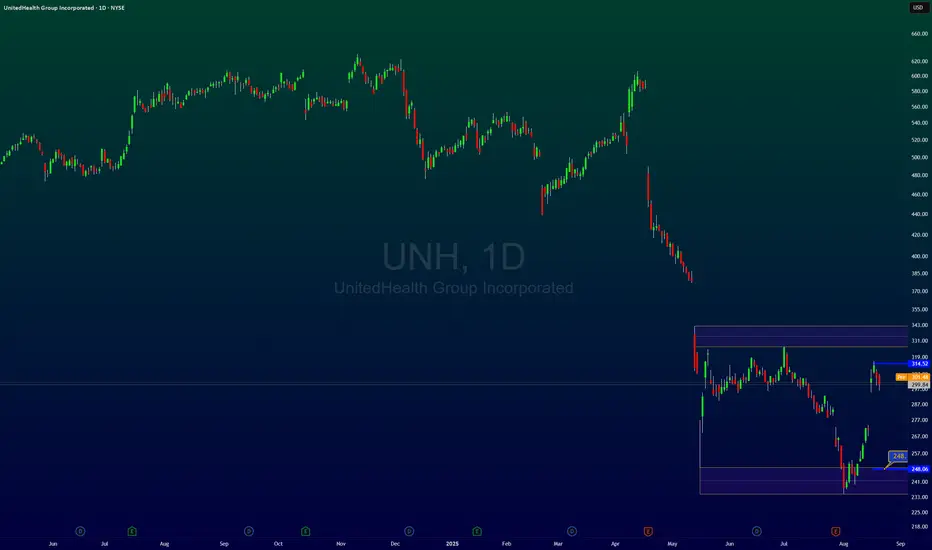
UNH ang its sideway trendAfter a severe and large price correction, now it is time for the correction of time and price, and people who suffered in this correction can easily compensate for their losses with asset management and two or three swings.
People like me who started trading stocks and were active in markets that have seen such corrections many times and have been active for more than a decade know very easily and can compensate for the loss, of course you need to know that with the experience we have gained, I will never allow such an event to happen unless it happens with a price gap.
If you are a stock trader and your portfolio is in loss, contact me so that we can compensate for your loss together.
Stay with me and be profitable
Do you have any questions? Ask me in the comments
Don't forget to introduce me to your friends so that we can all profit together?
What do you have in mind that I should analyze for you? Comment for me.
GBPJPY – Bears Just Getting Started?1. Market’s Context
In my previous two analyses, I highlighted the high probability of a drop in GBPJPY and noted that as long as resistance holds, the preferred scenario is to look for selling opportunities.
Yesterday, the market finally broke below the 199.00 support, reaching a local low around 198.90.
________________________________________
2. The Key Question
Was this just the first step of a deeper bearish move?
________________________________________
3. Why the Bearish Case is Strong
• Resistance remains intact, limiting upside potential.
• Break of 199.00 support confirms bearish momentum.
• Current price action looks more like a corrective rebound than a reversal.
• Structure suggests the decline could just be starting.
________________________________________
4. Trading Plan
• I remain bearish.
• Selling rallies is back in play.
• Target: the 195.00 zone remains my focus.
________________________________________
5. Final Note 🚀
GBPJPY has confirmed the break—now it’s all about execution. Sell the rebounds, aim for 195.
Disclosure: I am part of TradeNation's Influencer program and receive a monthly fee for using their TradingView charts in my analyses and educational articles.

Lingrid | USDCHF Potential Sell-Off In the Market The price perfectly fulfills my previous idea . FX:USDCHF is currently consolidating within a resistance zone after failing to sustain a breakout above the top structure. A descending triangle pattern is forming under the downward trendline while price holds inside the broader upward channel. If price rejects the 0.8080 resistance area, a continuation lower toward support at 0.7971 is likely. Broader context suggests the pair remains under bearish pressure within the descending structure despite prior bullish momentum.
📉 Key Levels:
Sell trigger: Rejection at 0.8080 resistance
Sell zone: 0.8050–0.8090 region
Target: 0.7971
Invalidation: Break and daily close above 0.81200
💡 Risks:
A surprise breakout above the descending triangle could trigger a bullish reversal.
USD strength from upcoming U.S. economic data could invalidate the bearish setup.
Safe-haven demand for CHF may shift unexpectedly with macroeconomic or geopolitical news.
If this idea resonates with you or you have your own opinion, traders, hit the comments. I’m excited to read your thoughts!

Lingrid | SOLUSDT Pullback Trading Opportunity To BuyThe price perfectly fulfilled my previous idea . BINANCE:SOLUSDT is rebounding from the support level and consolidating near the upward channel, showing strong bullish potential. Price structure highlights an upward channel with higher highs and higher lows while testing both a triangle pattern and downward trendline resistance. If the price holds above the $175.00 support zone and breaks the downward trendline, a push toward $206 is expected. The broader context shows bullish momentum, with the structure favoring continuation toward the $220 resistance area if momentum sustains.
📉 Key Levels:
Buy trigger: Break above the downward trendline near $190
Buy zone: $175.00 support retest and upward channel base
Target: $206 and potentially $220 resistance zone
Invalidation: A breakdown below $170.00 support
💡 Risks:
Failure to hold above $175.00 support could extend downside pressure.
Broader macro risks (USD strength, Fed policy shifts) may weigh on crypto sentiment.
Potential false breakout of the downward trendline could trap late buyers.
If this idea resonates with you or you have your own opinion, traders, hit the comments. I’m excited to read your thoughts!

BTC Trendline Broken: 110k Support Is the Last Stand1. Recent Context
In my previous BTC analysis, I wrote that as long as the ascending trendline held, bulls had nothing to fear. But on Monday, that line was broken to the downside. After a few hesitations, I decided to close my long positions around 116k.
________________________________________
2. The Key Question
Can bulls defend 110–111k, or are we heading for a deeper correction?
________________________________________
3. Why the Chart Looks Weak Short-Term
• The trendline break changes the bullish structure.
• Bulls must defend 110–111k; if this zone cracks, the damage could be significant.
• To regain momentum, BTC must break back above 120k. Without that, upside looks limited.
________________________________________
4. Trading Plan
At this point, I’m out of the market.
• I won’t buy into 111k support even if a rebound is probable.
• Instead, I’ll treat that rebound as a chance to sell short at better prices.
• 120k zone is the ideal level for a short setup, both technically and from a risk/reward perspective.

XAUUSD – Waiting for the Market to Show Its Hand1. Yesterday’s Setup
In my yesterday’s analysis, I mentioned that while I am bullish overall, I could not ignore the pressure Gold was putting on the 3330 support. I also noted that for bulls to regain control, a break above 3345 was needed.
The market reacted with textbook precision: price rallied exactly to 3345 before breaking down through 3330, reaching a low of 3311. Currently, we see a normal rebound, but inside a bearish short-term structure.
________________________________________
2. The Key Question
Is this just a continuation of the downtrend, or a trap before the real bullish move?
________________________________________
3. Why I’m Not Convinced by the Bears
• The recent drop doesn’t look impulsive—it’s overlapped and choppy, more like a stepway accumulation phase.
• The pattern is contained inside a falling wedge, a structure that usually favors upside breaks.
• Bears had their chance yesterday, but the follow-through looks weak.
________________________________________
4. Trading Plan
At this moment, I’m out of the market, waiting for confirmation.
• Buy zone: around 3300–3305 for a potential re-entry long.
• Bullish confirmation: if price climbs back above yesterday’s high (3345), it would negate the breakdown and confirm a false break.
• With price now at 3322, I prefer to stay patient, watching how it reacts at the key levels.
________________________________________
5. Final Note 🚀
Gold is now right in the middle of my interest range. For me, it’s not about predicting—it’s about waiting for the market to reveal the next high-probability setup.
Disclosure: I am part of TradeNation's Influencer program and receive a monthly fee for using their TradingView charts in my analyses and educational articles.

Lingrid | GOLD Clings to Critical Support ZoneOANDA:XAUUSD has been consolidating, moving inside a descending channel after a sharp rejection from resistance. Structure shows a wedge followed by a triangle pattern inside the downward trendline, pointing to compression before a potential breakout. A bullish scenario opens if price bounces from support near 3,315 and breaks above the 3,380 resistance handle. Overall, broader context shows gold locked in a sideways move but coiling into a corrective structure that could fuel a bullish rally.
📉 Key Levels:
Buy trigger: Rejection at 3,320
Buy zone: 3,310–3,320 support area.
Target: 3,380 then 3,431.
Invalidation: Sustained close below 3,270 support.
💡 Risks:
Failure to break the downward trendline, keeping bearish momentum intact.
Weak buying volume near support, leading to breakdown continuation.
Broader macro pressure from USD strength or yields limiting upside momentum.
If this idea resonates with you or you have your own opinion, traders, hit the comments. I’m excited to read your thoughts!

Lingrid | AUDUSD Selling Opportunity From the Resistance Zone The price perfectly fulfilled my previous idea . FX:AUDUSD has rejected the resistance zone and is now breaking lower support levels, confirming bearish continuation. Price action is unfolding within a downward channel, with a clear series of lower highs and lower lows forming. If sellers sustain momentum below the broken level, price is likely to extend toward deeper support near 0.6360. Broader context shows persistent bearish momentum, reinforced by structure and rejection at resistance.
📉 Key Levels:
Sell trigger: Breakdown below 0.6470 support with bearish confirmation.
Sell zone: Between 0.6470 – 0.6480 on failed retests.
Target: 0.6361 support level.
Invalidation: Break and close above 0.6500 resistance.
💡 Risks:
Failure to hold below the 0.6470 breakout may trigger a false breakdown.
Broader USD weakness from macroeconomic data could support a bullish rebound.
If risk sentiment shifts (e.g., equities rally), AUD could regain strength despite technical bearish structure.
If this idea resonates with you or you have your own opinion, traders, hit the comments. I’m excited to read your thoughts!

Lingrid | XRPUSDT Long Potential In Range Bound MarketBINANCE:XRPUSDT is bouncing from major support near 2.80 after defending the structure and rejecting further downside. Price action shows a descending triangle interacting with the downward trendline, while still respecting the higher-low support base. If buyers maintain control and a breakout over the trendline occurs, XRP could extend toward 3.35 and potentially 3.65. Overall momentum suggests consolidation transitioning into a bullish rebound setup within the broader corrective channel.
📉 Key Levels:
Buy trigger: Rejection and hold above the descending trendline
Buy zone: 2.80–2.85 support area
Target: 3.35 first objective, 3.65 secondary objective
Invalidation: Close below 2.70
💡 Risks:
Failure of trendline breakout could keep price trapped under descending resistance.
Broader crypto sentiment weakening, dragging XRP lower despite support.
Upcoming macroeconomic data (e.g., USD strength) affecting overall risk sentiment.
If this idea resonates with you or you have your own opinion, traders, hit the comments. I’m excited to read your thoughts!

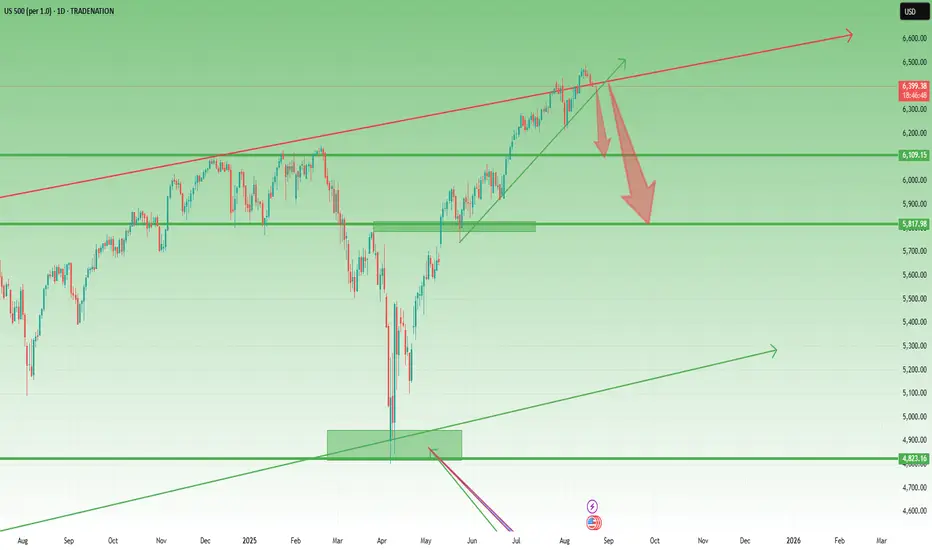
US500 – Has the Correction Started?1. What Happened Yesterday
Yesterday, US500 dropped around 1%, signaling that a meaningful correction could be starting. Unlike Nasdaq, which already broke under two key support levels, here the price is still above the trendline that began back at the end of May, when the index broke through the important 5800 resistance.
The rise since April has been huge and not fundamentally justified, making the index vulnerable to a reversal towards more sustainable levels.
________________________________________
2. Key Question
Has the correction really started, or will we first see another spike before the drop?
________________________________________
3. Why More Downside is Likely
• Trendline vulnerability: A break under 6380 could trigger acceleration to the downside.
• First bear target: 6100, the old ATH.
• Bigger picture: A move under 6000 remains likely, with 5800 as a longer-term destination.
• Risk/reward setup: Any spike higher should be seen as a selling opportunity. Around 6500 would be ideal to short.
________________________________________
4. Trading Plan
• Sell spikes, especially near 6500).
• Watch 6380 – break here could open the way towards 6100.
• Medium/long term bias: Bearish, with more room down than up.
________________________________________
5. Final Note 🚀
The market must confirm, but the strategy is clear: don’t chase the bounce, sell the strength and ride the correction.
Disclosure: I am part of TradeNation's Influencer program and receive a monthly fee for using their TradingView charts in my analyses and educational articles.
XAUUSD: Buy low, sell high in volatile marketYesterday's strategy hit its stop-loss, primarily because the entry point was too early. If the entry point had been at 3330, support would have been stronger.
Now the gold price has once again fallen back to around 3330, you can consider entering the market again.
Recently, gold prices have been volatile due to a reduction in risk aversion following talks between Trump and European leaders, including Putin and Zelensky, on ending the Russia-Ukraine conflict.
However, without a substantive agreement, gold prices will not experience a significant decline in the short term and will primarily fluctuate within support and resistance ranges.
Upper resistance is at 3355, while lower support is at 3325. A break of either level will break the volatile trend in gold prices.
In terms of operation, you can rely on resistance and support to sell high and buy low.

NASDAQ – Is the Top Finally In?In my past two NAS analyses, I argued that the index was overstretched and vulnerable to a deep correction. Even the fact that from the April bottom to mid-August it surged nearly 50% should have raised big red flags — that kind of move rarely sustains without a meaningful pullback.
At this moment, the technical picture has shifted significantly. The index has broken two critical levels:
1. The ascending trendline drawn from the recent low.
2. The horizontal support defined by the previous all-time high.
Losing both of these supports in quick succession suggests the bullish momentum is fading and a top may already be in place.
If this scenario unfolds as expected, selling pressure could intensify in the coming sessions. My first downside target stands in the 22,700 zone, with further weakness possible if the correction develops into a broader risk-off cycle.
Disclosure: I am part of TradeNation's Influencer program and receive a monthly fee for using their TradingView charts in my analyses and educational articles.

Lingrid | EURJPY Potential Breakout and Price SurgeThe price perfectly fulfilled my previous idea . FX:EURJPY is consolidating just beneath resistance after rebounding strongly from the support zone. Price is moving inside an upward channel, while repeatedly testing the downward trendline from above, hinting at a potential breakout. A confirmed move above resistance could trigger bullish continuation toward 173.50. Broader momentum remains constructive as higher lows align with the channel’s bullish structure.
📉 Key Levels:
Buy trigger: Break and close above 172.90–173.00 zone.
Buy zone: 172.10–172.40 retest area near the upward channel support.
Target: 173.50 resistance area.
Invalidation: Break below 171.80 support would negate the bullish outlook.
💡 Risks:
Failure to break the downward trendline could trigger another rejection lower.
Yen strength from macro data or risk-off flows could cap upside momentum.
Overextension near resistance could lead to a false breakout trap.
If this idea resonates with you or you have your own opinion, traders, hit the comments. I’m excited to read your thoughts!

Lingrid | ETHUSDT Trend Continuation Following CorrectionThe price perfectly fulfilled my previous idea . BINANCE:ETHUSDT recently rejected the resistance zone and moved into a corrective phase within a downward channel. Structure shows an A-B-C pullback forming after a sharp impulse leg topped out near 4785. Price is now testing the support zone near 4200, with potential for a bullish rebound if buyers step in strongly. In the broader context, Ethereum remains in an overall uptrend, but the corrective channel must break to confirm continuation.
📉 Key Levels:
Buy trigger: Rejection of 4050 level.
Buy zone: 4080–4100 support region.
Target: 4450 level, aligning with prior resistance.
Invalidation: Break below 4000 support.
💡 Risks:
A deeper breakdown through the 4000 support could extend losses toward 3800.
Momentum remains bearish inside the downward channel, requiring confirmation of breakout.
Macro risks (Fed policy, risk-off sentiment in equities) could weigh on crypto recovery
If this idea resonates with you or you have your own opinion, traders, hit the comments. I’m excited to read your thoughts!
