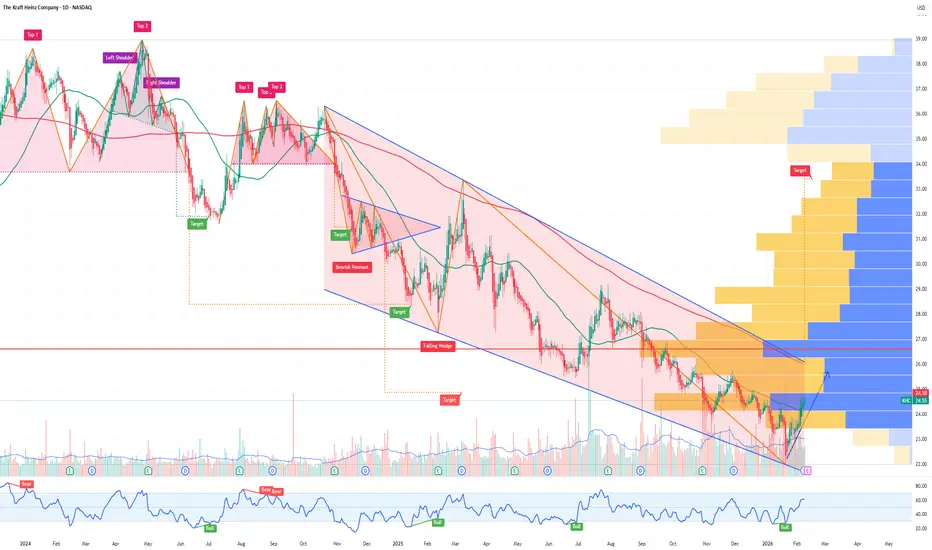
KHC The Kraft Heinz Company Options Ahead of EarningsAnalyzing the options chain and the chart patterns of KHC The Kraft Heinz Company prior to the earnings report this week,
I would consider purchasing the 25usd strike price Calls with
an expiration date of 2026-3-20,
for a premium of approximately $0.67.
If these options prove to be profitable prior to the earnings release, I would sell at least half of them.
Signalsfree
GOOG Alphabet Options Ahead of EarningsIf you haven`t bought GOOG before the recent rally:
Now analyzing the options chain and the chart patterns of GOOG Alphabet prior to the earnings report this week,
I would consider purchasing the 355usd strike price Calls with
an expiration date of 2026-4-17,
for a premium of approximately $17.80.
If these options prove to be profitable prior to the earnings release, I would sell at least half of them.

USDJPY Is Not Reversing Yet — This Is Distribution Before MOVEJPYUSD just shifted from an impulsive push into a tight distribution style range: price is printing lower highs + choppy overlaps under the marked resistance zone (~0.00651–0.00652) while repeatedly leaning on the support zone (~0.00643–0.00644) that’s classic “slow bleed” behavior where sellers absorb every bounce and liquidity builds at the floor. The yellow EMA (trend filter) is still rising underneath, but notice the structure: the market keeps rejecting the top, then steps down in smaller waves, which often precedes a support sweep → breakdown → acceleration as stops below support get triggered. Macro-wise, this setup makes sense because JPY is highly sensitive to U.S. yield direction and risk sentiment: if U.S. yields stay firm / the Fed stays restrictive, it tends to support USD and pressure JPY (JPYUSD lower), while any risk-off shock or a credible BoJ tightening narrative can flip flows back into JPY and fuel a rebound. That’s why the plan is simple and professional: bullish only if price reclaims and holds above ~0.00652 (acceptance, not just a wick), targeting the prior swing area, but bearish if we lose ~0.00643 cleanly, then look for continuation toward the EMA zone (~0.00641) and deeper liquidity around ~0.00635 because the real move usually starts after this range has baited both sides into taking early entries.

T AT&T Options Ahead of EarningsIf you haven`t bought T before the rally:
Now analyzing the options chain and the chart patterns of T AT&T prior to the earnings report this week,
I would consider purchasing the 23usd strike price Puts with
an expiration date of 2026-1-30,
for a premium of approximately $0.32.
If these options prove to be profitable prior to the earnings release, I would sell at least half of them.

POET Technologies Options Ahead of EarningsAnalyzing the options chain and the chart patterns of POET Technologies prior to the earnings report this week,
I would consider purchasing the 17usd strike price Calls with
an expiration date of 2028-1-21,
for a premium of approximately $0.82.
If these options prove to be profitable prior to the earnings release, I would sell at least half of them.

FUBO: A Hidden Gem in 2026 – Disney Merger’s Overlooked ValueIf you haven`t bought FUBO before the merger:
As we enter 2026, FuboTV Inc. (FUBO) stands out as a high-conviction bullish pick in the streaming sector, trading at a deeply undervalued ~$2.67 per share with a market cap around $900 million.
Following its transformative merger with Disney's Hulu + Live TV assets, which closed in October 2025, FUBO is primed for significant synergies that could drive explosive growth this year.
With Disney holding a ~70% stake, the combined entity (NewCo) boasts ~6 million subscribers, positioning it as the sixth-largest pay-TV provider in the U.S. and setting the stage for a potential 4x+ upside if execution delivers.
The merger’s rationale is clear: FUBO’s sports-focused platform complements Hulu’s content library and Disney’s ecosystem (Disney+, ESPN+).
Key catalysts in 2026 include full integration by mid-year, which could slash content costs (currently 73% of revenue) through shared deals and boost average revenue per user (ARPU) from ~$76 to $90+ via targeted ads and bundling.
Adding to the bullish case, unusual options activity signals institutional confidence. In early January 2026, aggressive buying of $10 strike calls expiring January 2027 (over 1,500 contracts at ~$0.21) reflects bets on a breakout to $10+ – a ~270% jump from current levels.
This deeply out-of-the-money positioning screams lottery play, but it’s backed by real potential: if synergies materialize, FUBO could attract a full buyout from Disney to consolidate control, offering a premium of $8–12 per share, similar to ongoing media consolidations like Warner Bros. Discovery.
Risks exist – integration delays or subscriber churn could weigh on sentiment – but at this price, the asymmetry favors bulls.
If 2026 brings relaxed antitrust under Trump and a streaming boom, FUBO could triple or more. This is a speculative gem for patient investors eyeing the next big media winner.

BTCUSD - Today🔹 WEEKLY – Big Picture
Bearish market structure after a completed bullish impulse
Clear lower highs & lower closes
Recent candles show loss of buying pressure
Price is trading below the equilibrium level (red line)
📌 Weekly Bias:
➡️ Bearish / corrective phase
➡️ No confirmed long-term reversal yet
🔹 DAILY – Medium Term
Strong selloff followed by range / accumulation
No bullish breakout confirmed
Every upside attempt is sold into
Multiple SELL signals near resistance
Extented CHARTS ibb.co
📌 Daily Bias:
➡️ Neutral → Bearish
➡️ Market is likely building liquidity before the next move
🔹 H4 – Trading Structure
Sideways consolidation
Upper wicks + SELL signals = supply absorption
No valid Higher High structure
Price is stuck around equilibrium
📌 H4 Bias:
➡️ Range market with bearish pressure
➡️ Better setups on SELL near range highs
🔹 H1 – Intraday View
Low volatility environment
Lack of bullish momentum
BUY signals are weak and quickly invalidated
Structure shows lower highs
📌 H1 Bias:
➡️ Scalping conditions / no clear trend
➡️ Market is waiting for a liquidity event
🔥 KEY SCENARIOS FOR TODAY
🟥 SCENARIO 1 (Higher Probability)
Liquidity sweep to the downside
Possible fake breakout above the range
Fast rejection and bearish continuation
Targets: H4 / Daily lows
➡️ Setup idea:
SELL after rejection / fake HH / H1–H4 confirmation
🟩 SCENARIO 2 (Alternative)
Break & Hold
Clean breakout above range
Acceptance above resistance
⚠️ At the moment, no confirmation for this scenario
🧠 SUMMARY (Trader’s View)
Primary trend: BEARISH
Market state: consolidation after a drop
Best approach: patience + shorts at resistance
Worst approach: buying dips without confirmation

SIGNAL #1 DAY 12/16🕯BUY GOLD: 4284-4287
⚠️ SL: 4382
✔️ TP: 4392-4397-4301
We continue to look for BUY setups.
The market just made a deep move down to 4273, but immediately wicked back up, showing clearly that:
👉 This drop was not a trend break,
👉 It was simply a liquidity sweep before the next potential push upward.
The higher-timeframe trend is still bullish, as long as price holds above 4281, which is our key VAH Swing + Daily Open support zone.

LEN Lennar Corporation Options Ahead of EarningsIf you haven’t exited LEN before the selloff:
Now analyzing the options chain and the chart patterns of LEN Lennar Corporation prior to the earnings report next week,
I would consider purchasing the 115usd strike price Puts with
an expiration date of 2025-12-19,
for a premium of approximately $1.62.
If these options prove to be profitable prior to the earnings release, I would sell at least half of them.

ZS Zscaler Options Ahead of EarningsIf you haven`t bought ZS before the rally:
Now analyzing the options chain and the chart patterns of ZS Zscaler prior to the earnings report this week,
I would consider purchasing the 260usd strike price Puts with
an expiration date of 2026-1-16,
for a premium of approximately $11.75.
If these options prove to be profitable prior to the earnings release, I would sell at least half of them.

Gold Fluctuates in Support Range; Accumulation Signals Rise⏰ Timeframe: 30m
📅 Update: 24/11/2025
🔍 Market Context
After a corrective decline from the 4,104 USD area, gold is moving within a range-bound structure with strong support at the 4,003–4,023 USD area.
The market is in a short-term re-accumulation phase, as consecutive CHoCH movements appear around the bottom area — reflecting the buying side's effort to absorb liquidity.
The selling side temporarily controls, but balancing signals are becoming clearer as the price continuously rejects breaking deeply below the Demand Zone.
📊 Technical Structure
Resistance Zone (4,090–4,104 USD): main supply area, confluence with Fibo 1.0, where profit-taking reactions are likely if the price rebounds.
Support Zone (4,023 USD): intermediate support, playing a key role in the current sideways structure.
Demand Zone (4,003 USD): potential demand area, confluence with previous liquidity bottom – main BUY Zone area.
Structure Bias: still inclined towards accumulation – recovery, as long as the price maintains above 4,003 USD.
🎯 Market Outlook
1️⃣ Priority Scenario (Buy setup):
• The price may continue to retest the Demand Zone (4,003–4,023 USD).
• When a clear reaction signal appears, expect a recovery to the Fibo 0.618 → 1.0 area, corresponding to 4,075–4,104 USD.
2️⃣ Secondary Scenario (Breakdown):
• If the price breaks below 4,003 USD, the recovery structure will be invalidated, bringing gold back to the lower liquidity area around 3,985 USD.
💎 Key Zones
BUY Zone: 4,003 – 4,023 USD
SELL Zone: 4,090 – 4,104 USD
🧠 Analyst’s View
Gold is currently in a liquidity re-accumulation phase, as both sides are testing the lower boundary of the main support area.
The buying side needs confirmation with a break above 4,075 USD, while the selling side still holds the advantage if the price cannot maintain above the balance area.
In the current context, price behavior leans towards the “Sweep – Retest – Expansion” model, with the potential for forming a short-term technical recovery wave.
🛡️ Risk Note
The market is in a low volatility area – avoid emotional actions without clear structural confirmation.

XAU/USD: Gold Set to Test Downtrend Line!⏰ Timeframe: 30m
📅 Update: 11/21/2025
🔍 Market Context
After adjusting from the 4,107 USD area, gold is moving sideways in the liquidity rebalancing zone – indicating a tug-of-war between the two sides.
The consecutive CHoCH – BOS movements forming around the 4,006 USD bottom show that buying pressure is starting to reappear.
The current decline seems to be just a correction phase, not yet showing enough signs of a complete reversal of the medium-term uptrend structure.
📊 Technical Structure
Downtrend line: continues to act as dynamic resistance – a confirmation area for the recovery trend if broken.
OB Bullish (4,006 USD): confluence with the previous liquidity bottom, is a potential BUY Zone.
Break–Resistance (4,045 USD): the first level to surpass to confirm buying pressure.
OB Bearish (4,086–4,107 USD): short-term supply zone – short-term SELL Zone, may witness profit-taking reactions if the price touches it.
🎯 Market Outlook
1️⃣ Priority Scenario:
– Price may retest the OB Bullish / BUY Zone (4,006–4,025 USD).
– When a clear upward reaction appears, gold is likely to break through the downtrend line, heading towards OB Bearish (4,086–4,107 USD).
2️⃣ Alternative Scenario:
– If the price does not hold the 4,006 USD area, the short-term structure will be invalidated, opening the possibility of retreating to a lower equilibrium area around 3,985 USD.
💎 Key Zones
BUY Zone: 4,006 – 4,025 USD → demand zone confluence OB + liquidity bottom.
SELL Zone: 4,086 – 4,107 USD → potential supply zone if the recovery trend is activated.
🧠 Analyst’s View
Gold is in a short-term accumulation state with signs of capital flow gradually leaning towards the buyers.
The retest phase of the 4,006 USD support area will be the key confirmation for a reversal – retest – continuation phase.
As long as the price stays above this area, the priority remains a buy-the-dip scenario in the short term.
🛡️ Risk Note
The market is operating in a "break or hold" zone – clear confirmation is needed before following the trend.
Analysis is for technical and educational purposes, not trading advice.

Gold Technical Retracement Before Continuing Main Uptrend⏰ Timeframe: 30m
📅 Update: 11/14/2025
🔍 Market Context
After establishing a short-term peak around 4,239 USD, gold is undergoing a technical retracement to rebalance its structure.
The most recent decline formed a Break of Structure (BOS), but the Support Zone around 4,145–4,174 USD continues to serve as a foundation for the medium-term uptrend.
The current price structure indicates the market is re-accumulating momentum before expanding again.
📊 Technical Structure
Order Block (4,239 USD): a short-term resistance zone where the price may react slightly before continuing upward.
Support Zone (4,145–4,174 USD): a confluence zone with Fibo 0.236–0.382, playing a balancing role in the current cycle.
Liquidity Targets:
• 4,261 USD – intermediate liquidity zone.
• 4,293 USD – main expansion target if the uptrend is maintained.
🎯 Market Outlook
High probability scenario:
1️⃣ The price may retrace to the Support Zone or form a higher low around 4,174 USD, then recover to the OB zone at 4,239 USD.
2️⃣ If the uptrend structure breaks, the market may test deeper towards 4,145 USD before bouncing back.
As long as the price holds above this support zone, the primary trend remains bullish continuation.
🧠 Analyst’s View
This is a phase of market re-accumulation after a rapid increase.
Maintaining a higher low structure will be a confirmation signal for the next expansion phase towards 4,261–4,293 USD.
Buyers are still controlling the cash flow, while sellers mainly participate in the short-term resistance zone.
🛡️ Risk Note
The market is in a slight correction phase – avoid impulsive actions when the price has not completed the accumulation zone.

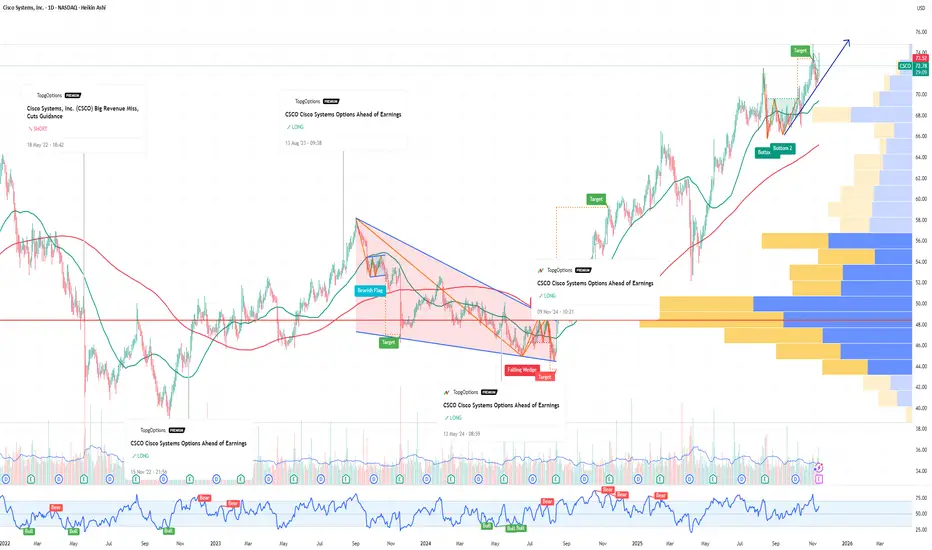
CSCO Cisco Systems Options Ahead of EarningsIf you haven`t bought CSCO before the previous earnings:
Now analyzing the options chain and the chart patterns of CSCO Cisco Systems prior to the earnings report this week,
I would consider purchasing the 74usd strike price Calls with
an expiration date of 2025-11-14,
for a premium of approximately $1.75.
If these options prove to be profitable prior to the earnings release, I would sell at least half of them.
XAU/USD – Price Accumulating in a Narrow Range, Ready to Expand⏰ Timeframe: 30m
📅 Update: 11/12/2025
🔍 Market Context
Gold maintains a neutral structure after forming a Change of Character (CHoCH) around the 4,144 USD area.
Yesterday's session witnessed a narrow fluctuation between the Demand Zone – Support Zone, indicating the market is absorbing liquidity before determining the next direction.
The medium-term upward momentum remains unbroken, but the price needs a clear balancing phase before continuation.
📊 Technical Structure
Demand Zone (4,144 USD): a short-term supply – demand area where the market previously reacted strongly, now becoming a potential testing zone.
Support Zone (4,099 USD): confluence structure – an area where buying flows may return when the price retests.
Order Block (4,081 USD): a deep defensive zone, corresponding to the main Discount area in the current cycle.
Equal Lows (EQL) & CHoCH: indicate a short-term transition between two sides, but the overall bias slightly leans towards an increase.
🎯 Market Outlook
High probability scenario for the day:
1️⃣ Price may fluctuate within the 4,099–4,144 USD balance zone to attract liquidity.
2️⃣ If a strong reaction occurs from the Support Zone or Order Block, gold may establish a new upward move towards 4,165–4,180 USD.
3️⃣ Conversely, if the price closes below 4,081 USD, the short-term structure will temporarily shift to neutral, prioritizing a re-accumulation phase.
🧠 Analyst’s View
Current price behavior reflects a “pause phase” in the larger upward structure.
When the market balances at lower levels, the key observation is not the bounce, but the reaction when liquidity is swept — where the true momentum of the trend is reignited.
As long as the price does not break the 4,081 USD mark, the medium-term upward trend remains intact.
🛡️ Risk Note
This is a technical analysis, not investment advice.
The market can change rapidly during US sessions – wait for clear confirmation from price action before participating.

XAU/USD – Gold Technical Adjustment Before Continuing Uptrend⏰ Timeframe: 30m
📅 Update: 11/11/2025
🔍 Market Context
After a strong rally from the start of the Asian session, gold paused around 4,130–4,140 USD, indicating a temporary cooldown following a series of consecutive Break of Structure (BOS).
The current price is situated between a short-term resistance (Resistance Zone) and a technical support (Order Block) — clearly reflecting a rebalancing behavior after a rapid expansion.
📊 Technical Structure
Resistance Zone (4,145 USD): a short-term reaction area, coinciding with a Weak High. If the price breaks through, the uptrend structure will continue towards the Liquidity Zone around 4,198 USD.
Order Block (4,111 USD): a confluence area between 0.382–0.5 Fibonacci, likely to attract buying flow when the price adjusts.
OB Deep (4,081 USD): a deep support area, aligning with the 0.618 Fibonacci level — where buyers may defend the main trend.
Liquidity Zone (4,198 USD): a potential expansion target if the uptrend structure is reaffirmed.
🎯 Market Outlook
High probability scenario:
1️⃣ Price technically adjusts to OB 4,111 or OB Deep 4,081, creating a reaction at the Discount area.
2️⃣ When buying momentum returns, the price may retest the Resistance Zone 4,145, then expand towards the Liquidity Zone 4,198 USD.
3️⃣ Breaking below 4,081 USD will weaken the short-term structure, shifting the state to a deeper rebalancing.
🧠 Analyst’s View
This is a natural “cooldown” phase after a strong rally — the market is seeking liquidity before establishing the next upward move.
As long as the price holds above the 4,081 USD area, the main trend remains bullish.
Observing reactions at the OB will help determine whether the upward momentum continues to dominate during the US session.
🛡️ Risk Note
The market is adjusting within a larger trend — avoid emotional actions when the price has not completed the retracement phase.

Gold Accumulates on Support, 3,952 USD is the Gateway for a New🔍 Market Context
Gold is oscillating within a symmetrical triangle pattern , reflecting price compression and waiting for a breakout signal.
Buyers still maintain a short-term bullish structure, but the series of lower highs indicates increasing selling pressure.
The 3,959–3,964 USD zone is currently the “balance point” — if this area is breached, the downtrend could extend to the lower liquidity zone around 3,929–3,921 USD .
💎 Key Technical Zones
• Resistance Zone: 4,020 – 4,040 USD → the main resistance area of the triangle, where strong reactions are likely.
• Support Zone: 3,959 – 3,964 USD → the support area maintaining the bullish structure.
• Liquidity Zone: 3,929 – 3,921 USD → low liquidity area, potential to attract price stop sweeps before reversing.
🎯 Trading Scenarios
1️⃣ BUY Setup – Prioritize when price holds above support
• Entry: 3,959 – 3,964 USD
• Stop Loss: 3,940 USD
• Take Profit:
– TP1: 3,985
– TP2: 4,020
– TP3: 4,040
– TP4: 4,096
✳️ “Buy the discount” – Buy at the trendline convergence support area when confirmation signals appear (rejection or bullish ChoCH).
2️⃣ SELL Setup – Scenario if support breaks
• Entry: 3,950 – 3,955 USD (after candle closes below support zone)
• Stop Loss: 3,970 USD
• Take Profit:
– TP1: 3,935
– TP2: 3,925
– TP3: 3,912
✳️ “Sell the breakdown” – Sell when support is clearly breached, targeting the lowest liquidity zone (3,921 USD).
💬 Summary
Gold is in a phase of accumulation before major volatility .
If it holds above the 3,952 USD zone → prioritize BUY following the bullish structure .
If it breaks below 3,952 USD → SELL following the breakout towards the Liquidity Zone.
The scenario will be clearly confirmed when the current symmetrical triangle is broken.
💡 Today's Tagline:
“Liquidity defines direction — follow where the money hides.”
⏰ Timeframe: 1H
📅 Updated: 11/04/2025
✍️ Analysis by: Captain Vincent

SBUX Starbucks Corporation Options Ahead of EarningsIf you haven`t bought SBUX ahead of the previous earnings:
Now analyzing the options chain and the chart patterns of SBUX Starbucks Corporation prior to the earnings report this week,
I would consider purchasing the 84usd strike price Puts with
an expiration date of 2025-10-31,
for a premium of approximately $3.20.
If these options prove to be profitable prior to the earnings release, I would sell at least half of them.

SOLUSDT.P - October 22, 2025Price is attempting a short-term rebound from the 183.13-180.23 range after an extended decline, forming a potential counter-trend setup targeting multiple profit levels near 189.9, 192.0, 194.3, and 197.6. However, volatility remains high amid Trump's tariff narrative, making this a high-risk play that requires tight stop management and active monitoring.

FCX Freeport-McMoRan Options Ahead of EarningsAnalyzing the options chain and the chart patterns of FCX Freeport-McMoRan prior to the earnings report this week,
I would consider purchasing the 45usd strike price Calls with
an expiration date of 2025-12-19,
for a premium of approximately $1.31.
If these options prove to be profitable prior to the earnings release, I would sell at least half of them.

XAUUSD | m15 frame gold drops sharply by 50 points ? 🔍 Market Context
Gold prices have just set a historical peak (ATH GOLD) around the 4,180 USD region, following a steep upward trend over multiple sessions.
Immediately after, the market witnessed the first break of upward structure (BoS) – a sign indicating that bullish momentum is weakening .
Currently, prices are returning to fill the Fair Value Gap (FVG) at 4,125 – 4,145 USD , which is likely a liquidity rebalancing phase before prices choose the next direction.
💎 Technical Analysis
ATH GOLD: 4,180 – 4,185 USD
Fair Value Gap (FVG): 4,125 – 4,145 USD → an empty price area that needs to be filled.
Order Block Buy Zone 1: 4,050 – 4,060 USD → the nearest demand zone, potentially creating the first technical reaction.
Order Block Buy Zone 2: 3,980 – 3,985 USD → a deep demand zone with large liquidity confluence, likely to become the main "accumulation point."
Overall Structure: After breaking the upward channel, the market is in a retracement phase – the medium-term structure remains bullish .
📈 Trading Scenarios
1️⃣ Short-term Sell Scenario – filling FVG and technical adjustment
If prices continue to test the FVG 4,125 – 4,145 USD region without breaking through,
→ consider a short-term sell to catch the technical retracement phase.
Target: the first OB Buy Zone 4,050 USD .
Stop Loss: above 4,155 USD (to avoid being swept above the FVG peak).
➡️ This scenario is suitable for short-term traders following corrective waves – only enter when there is a clear reversal candle confirmation.
2️⃣ Trend-following Buy Scenario – catching the rebound from OB Zone
If prices adjust to the 4,050 – 4,060 USD region, observe reaction signals such as Bullish Engulfing or strong Rejection .
Upon confirmation, open a trend-following buy order .
Target: the 4,125 → 4,145 USD region or the old peak of 4,180 USD.
Stop Loss: below 4,030 USD.
If the first OB zone doesn't hold, the 3,980 – 3,985 USD area will be an ideal zone for long-term "accumulation."
⚠️ Risk Management
Avoid FOMO buying at high prices when the FVG is not yet filled.
Prioritize trading at clear reaction zones (OB, FVG edge).
Reduce volume when entering counter-trend orders to preserve capital.
💬 Conclusion
After a steep rise, gold is entering a value rebalancing phase .
The current market structure leans towards a short-term technical retracement before continuing the main upward trend.
If the 4,050 – 4,060 USD region reacts well, gold may soon rebound and aim for the 4,150 – 4,180 USD region.
👉 Reasonable Strategy:
Short-term sell when prices react at FVG.
Wait to buy at OB Buy Zone when there is a confirmed upward signal.

TRUMPUSDT.P - September 22, 2025This is a mid-probability setup with high reward potential.
Entry Price: 7.85
Profit Level: 10.37
Stop Level: 6.587
Take partial profit and move stop loss to breakeven once price reaches 8.812

USD/CHF: Bears Defending the TrendlineUSD/CHF continues to respect the descending channel structure that has been in place since mid-August.
After a short-term recovery, the price is now retesting the upper trendline resistance and the 0.8000–0.8020 supply zone, where sellers have previously stepped in.
Technical Outlook
Structure: Descending channel – clear series of lower highs.
Resistance zone: 0.8000–0.8020 (channel top + previous rejection zone).
Support zone: 0.7870–0.7840 (recent demand area).
Moving averages: Both 50 and 100 MAs are flattening but still below the resistance, suggesting limited bullish momentum.
Bias: Bearish below 0.8020 — expecting rejection and continuation to the downside.
Fundamental Context
Recent U.S. data has shown mixed inflation numbers, while Swiss CPI remains stable, reducing expectations for any SNB intervention.
The stronger Swiss franc remains supported by safe-haven flows amid global uncertainty.
Unless the U.S. delivers a clear upside surprise in macro data, the pair is likely to remain under pressure in Q4.
Trade Setup (Not Financial Advice)
Entry zone: 0.79700–0.79800
Stop-loss: 0.8020
Targets:
TP1 → 0.7900
TP2 → 0.7845
🧭 A break below 0.7930 would confirm bearish continuation within the channel.
