Gold retreats, buying opportunity reappearsAfter stabilizing at 3400 yesterday, gold prices continued their upward trend, reaching a high of 3423. This is very consistent with my view yesterday. The only regret is that gold prices did not return to 3400 after the article was published, and we missed this wave of gains.
Yesterday, in his speech on monetary policy, Waller expressed support for a 25 basis point interest rate cut in September and predicted further rate cuts within the next three to six months. If the employment data shows "significant weakness" in the US economy, he may support a larger rate cut (which is bullish for gold).
Based on gold's trend, 3400 OANDA:XAUUSD is definitely a key level. After yesterday's breakthrough, it has clearly become strong support. Therefore, I believe that as long as gold prices remain above 3400, the range of gold prices will likely be between 3400 and 3450.
Gold prices just retreated again. Not wanting to miss out, I bought around 3405, with a take-profit of $10-30 depending on the situation, and a stop-loss of $3395-3390.
If the 3395-3390 range is broken, don't go long on gold.
Signalsprovider

Gold | H2 Double Top | GTradingMethod🧐 Market Overview:
Gold is testing a key diagonal resistance level while forming a potential double top on the H2 timeframe. This setup suggests that sellers may step in at this level if resistance holds.
📊 Trade Plan:
Risk/Reward: 4.6
Entry: 3423.1
Stop Loss: 3429.6
Take Profit 1 (50%): 3397.8
Take Profit 2 (50%): 3385.5
💡 GTradingMethod Tip:
Double tops near major resistance often provide high R:R opportunities, but confirmation from price action is key before entering.
🙏 Thanks for checking out my post!
Make sure to follow me to catch the next idea and share your thoughts — I’d love to hear them.
📌 Please note:
This is not financial advice. This content is to track my trading journey and for educational purposes only.

Whether gold can hold steady at 3400 is the keyThe current market is bullish, primarily due to the developments surrounding Trump's proposed firing of Cook. Of the seven members of the Federal Reserve Board, three already support a rate cut: Bowman, Milan, and Waller. With the addition of another supporter, Trump's goal would be achieved. If Cook were to be fired and a more compliant candidate were to be promoted, the rate cut would be achieved, but the Fed's independence would also be undermined.
The dollar, US stocks, and US Treasuries would all be affected, and gold, the best safe-haven asset, would inevitably soar.
Today, we're focusing on two levels: 3400 and 3380.
If gold can stabilize above 3400 OANDA:XAUUSD , it's likely to head towards 3430-3450. At that point, you could consider buying around 3400.
Conversely, if it can't hold above 3400, it could test support at 3380. As long as it doesn't fall below 3380, it would be a good buying opportunity.
Good luck to everyone💪
📣If you have different opinions, please leave a message below to discuss
Lingrid | GOLD Quick Sell-Off Following Resistance Rejection The price perfectly fulfilled my previous idea . OANDA:XAUUSD is approaching the 3,430 resistance zone following a strong upward leg, showing early signs of exhaustion. The chart structure is forming within an upward channel but facing strong rejection at the red trendline resistance. If sellers maintain pressure, a decline toward 3,386–3,360 support becomes the primary scenario. Broader context suggests bearish momentum could strengthen if this breakdown accelerates since the market at key resistance.
📉 Key Levels
Sell trigger: Rejection from 3,430 resistance
Sell zone: 3,430–3,435 ideal short entry region
Target: 3,386 → 3,360 downside objective
Invalidation: Breakout above 3,440 resistance
💡 Risks
Unexpected weakness in USD could push gold higher instead of lower.
Safe-haven demand from geopolitical or macro shocks may boost gold.
Weak economic data Core PCE Price Index.
If this idea resonates with you or you have your own opinion, traders, hit the comments. I’m excited to read your thoughts!

Lingrid | AUDUSD Shorting Opportunity After Fake BreakoutFX:AUDUSD is facing rejection near resistance after a recent upward push, signaling weakening momentum. The structure shows price moving within an upward channel but failing to hold above the short-term resistance. A further decline is likely if the pair sustains below 0.6550, targeting the next support zone. Broader price action points to a corrective move within the channel as momentum fades.
📉 Key Levels
Sell trigger: Rejection of 0.6552 resistance
Sell zone: 0.6550 – 0.6530 region
Target: 0.6503
Invalidation: Break above 0.6555
💡 Risks
Strong USD weakness from unexpected macro data could flip the setup.
Breakout above the resistance zone would invalidate the bearish scenario.
Shifts in risk sentiment from global markets could drive renewed AUD strength.
If this idea resonates with you or you have your own opinion, traders, hit the comments. I’m excited to read your thoughts!

Lingrid | TONUSDT Consolidating Within Trading Range ZoneOKX:TONUSDT is consolidating above the $3.00 support after a prolonged sideways range that has lasted for months. The structure shows a descending trendline capping the upside, while higher lows continue to form at the base. A break above $3.22–$3.35 could trigger an upward impulse toward the mid-resistance zone. The chart suggests bulls are preparing for a shift, with momentum building for a breakout push.
📉 Key Levels
Buy trigger: Hold above $3.00
Buy zone: $3.00–$3.10 accumulation area
Target: $3.55–$3.60
Invalidation: Close below $3.00
💡 Risks
Extended consolidation may exhaust bullish momentum.
Macro pressure from BTC weakness could drag altcoins lower.
Failure to hold $3.00 support risks retesting $2.37.
If this idea resonates with you or you have your own opinion, traders, hit the comments. I’m excited to read your thoughts!

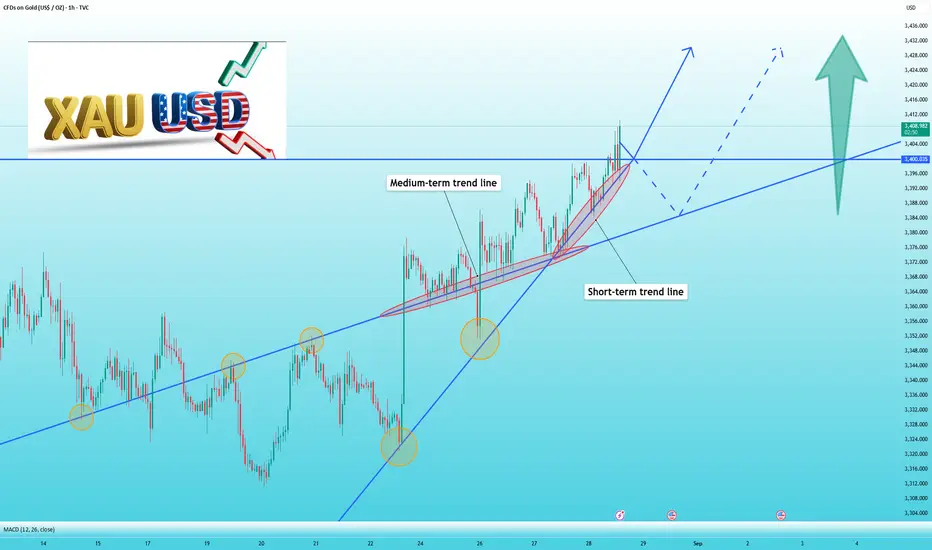
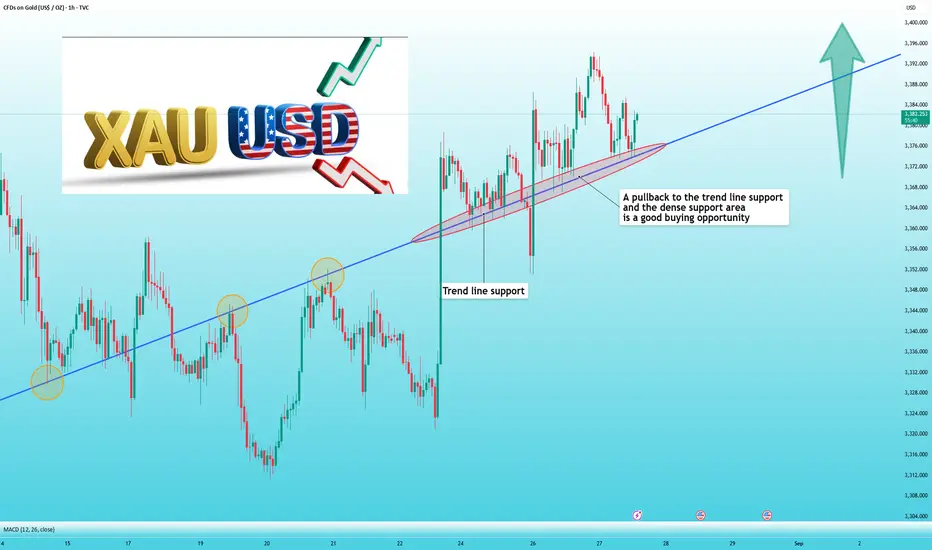
The gold rally is not over yet, stabilizing at 3400 is the keyThis week, Trump once again severely undermined the independence of the Federal Reserve. He has been attacking Chairman Powell for months and now threatens to fire Fed Governor Tim Cook. His actions are all part of his quest to pressure the Fed into cutting interest rates, ultimately forcing his will and ultimately achieving a rate cut, perhaps even a larger one.
Influenced by the Fed's independence and the expectation of rate cuts, gold prices have continued to rise this week, approaching the high of 3,400 points.
I personally believe that as long as gold doesn't fall below 3,350, it's only a matter of time before it breaks above 3,400.
From the 1-hour chart, we can clearly see that gold is steadily rising, supported by the trend line. Buying on a pullback to the trend line is a good opportunity, with a take-profit and stop-loss in place, presents a significant profit opportunity.
Currently, the optimal buying range for gold is between 3,365 and 3,375 OANDA:XAUUSD , with a target price of $10-20 and a stop-loss of $10.
📣If you have different opinions, please leave a message below to discuss
Lingrid | GOLD Channel Breakout: Short-Term Bullish Rally OANDA:XAUUSD is consolidating after rebounding from the upward trendline and testing the 3,360–3,370 support region. The structure shows a breakout above the downward channel, but momentum has stalled as price hovers under the resistance zone. Holding above 3,360 keeps the bullish outlook intact, with targets toward 3,427 if momentum picks up. A failure to sustain this base would risk a slip back into the broader channel.
📉 Key Levels
Buy trigger: Rejection of 3,370
Buy zone: 3,360–3,370 support range
Target: 3,427 resistance zone
Invalidation: Close below 3,330
💡 Risks
Strong USD data in the NY session could flip short-term direction.
Failure to sustain above 3,360 support would reintroduce bearish pressure.
Broader macro risk events (Fed commentary, bond yields) could trigger volatility.
If this idea resonates with you or you have your own opinion, traders, hit the comments. I’m excited to read your thoughts!

Lingrid | USDCAD Potential Long Trade From Support ZoneThe price perfectly fulfilled my previous idea . FX:USDCAD is retracing from the recent Higher High after stalling at the resistance zone. The structure has shifted into a compression channel followed by a breakout sequence that faded into a range. Price is now hovering just above support and aligned with the downward trendline, setting up a reaction point. A rebound from this zone could trigger an upward projection back toward 1.3839.
📉 Key Levels
Buy trigger: Hold above 1.3760
Buy zone: Support area near 1.3760–1.3780
Target: 1.3839
Invalidation: Breakdown below 1.3693
💡 Risks
Failure to hold the support zone at 1.3760 would negate the bullish case.
Strength in the Canadian dollar from oil market volatility could weigh on upside potential.
U.S. economic data surprises (PCE or jobs) could reinforce bearish momentum.
If this idea resonates with you or you have your own opinion, traders, hit the comments. I’m excited to read your thoughts!

Lingrid | HYPEUSDT Level Breakout: Bullish ContinuationKUCOIN:HYPEUSDT is rebounding after retesting the 46.000 support zone, which aligns with a higher low in the broader structure. Price action remains locked between the upward support trendline and the descending resistance trendline, forming a compression phase. A confirmed hold above 46.000 keeps the path open toward 55.000, with breakout potential if momentum accelerates. The overall setup suggests a bullish continuation pattern as long as higher lows are maintained.
📉 Key Levels
Buy trigger: Rejection of 46.000 support
Buy zone: 45.000–46.000
Target: 55.000
Invalidation: Break below 45.000
💡 Risks
Failure to hold the higher low structure could shift momentum back toward 36.126.
Macro headwinds from stronger USD could pressure risk assets.
Rejection at the descending trendline may delay the bullish continuation.
If this idea resonates with you or you have your own opinion, traders, hit the comments. I’m excited to read your thoughts!

Lingrid | GBPAUD Losing Momentum at Support. Potential LongFX:GBPAUD is testing the swap zone after pulling back from the recent top within the resistance zone. The structure shows bullish momentum holding above the upward channel while facing a downward trendline cap. A push above 2.0720 would confirm continuation toward the 2.0998–2.1000 target. The broader setup supports an ongoing uptrend as long as price respects support levels.
📉 Key Levels
Buy trigger: Hold above 2.0700
Buy zone: 2.0700–2.0720 support retest
Target: 2.0998 – 2.1000 resistance
Invalidation: Close below 2.0600
💡 Risks
Failure to hold above the upward channel trendline.
Strong AUD data release reversing sentiment.
Broader risk-off flows impacting GBP crosses.
If this idea resonates with you or you have your own opinion, traders, hit the comments. I’m excited to read your thoughts!

Lingrid | EURCAD Bearish Pullback In the Bullish TrendFX:EURCAD is pulling back from the resistance zone after reaching a recent top, with sellers taking control near 1.6225. The structure is still within an upward channel, but the market is correcting lower in an ABC move. Holding above 1.6040 would confirm the bullish bias remains intact. Momentum suggests this is a corrective dip before resuming the broader uptrend.
📉 Key Levels
Buy trigger: Rebound from 1.6040 support
Buy zone: 1.6035–1.6060
Target: 1.6116 and potentially 1.6225
Invalidation: Break below 1.6000
💡 Risks
Failure of support at 1.6040 could extend bearish momentum.
Stronger CAD fundamentals (oil price gains or BoC stance) may pressure EURCAD.
Euro weakness from ECB outlook or macroeconomic data could delay recovery.
If this idea resonates with you or you have your own opinion, traders, hit the comments. I’m excited to read your thoughts!

Bitcoin | H1 Double Bottom | GTradingMethodHello Traders.
Welcome to today’s trade idea by GTradingMethod.
🧐 Market Overview:
Bitcoin is trending lower while the RSI is forming higher lows, creating positive RSI divergence — a bullish signal. I’ll be watching for the hourly candle to close within range alongside confirmation from other GTradingMethod indicators before entering.
📊 Trade Plan:
Risk/Reward: 3.1
Entry: 109,104
Stop Loss: 108,234
Take Profit 1 (50%): 111,494
Take Profit 2 (50%): 112,453
💡 GTradingMethod Tip:
RSI divergence can often signal a momentum shift before price action confirms the move.
🙏 Thanks for checking out my post!
Make sure to follow me to catch the next idea and share your thoughts — I’d love to hear them.
📌 Please note:
This is not financial advice. This content is to track my trading journey and for educational purposes only.

Lingrid | GOLD Potential Trend Continuation TradeOANDA:XAUUSD is rebounding from the upward trendline after rejecting the recent pullback from the compression channel top. The structure shows a breakout above the downward channel, confirming a bullish reversal attempt. As long as price holds above 3,355, momentum favors continuation higher. The broader setup aligns with an extension toward the 3,405–3,440 resistance zone.
📉 Key Levels
Buy trigger: Breakout and hold above 3,355
Buy zone: 3,350–3,360 region
Target: 3,405 → 3,440
Invalidation: Break below 3,300
💡 Risks
Failure to sustain momentum above 3,355 could lead to a deeper pullback.
Strong US macro data or hawkish Fed tone may weigh on gold.
Rising Treasury yields could suppress safe-haven demand.
If this idea resonates with you or you have your own opinion, traders, hit the comments. I’m excited to read your thoughts!

Lingrid | ETHUSDT Potential Long Following Impulse MovementThe price perfectly fulfilled my previous idea . BINANCE:ETHUSDT is rebounding after holding the 4,400 support and retesting the upward trendline. The structure shows a corrective downward channel that has now broken to the upside. As long as price holds above 4,400, momentum favors another push toward 4,790 resistance. The broader setup reflects bullish continuation after a consolidation phase.
📉 Key Levels
Buy trigger: Break and hold above 4,400 support
Buy zone: 4,300 – 4,400 accumulation area
Target: 4,790
Invalidation: Close below 4,000
💡 Risks
Failure of price to sustain above the upward trendline.
Broader market weakness or Bitcoin-led downturn.
Upcoming macroeconomic data releases impacting overall risk sentiment.
If this idea resonates with you or you have your own opinion, traders, hit the comments. I’m excited to read your thoughts!

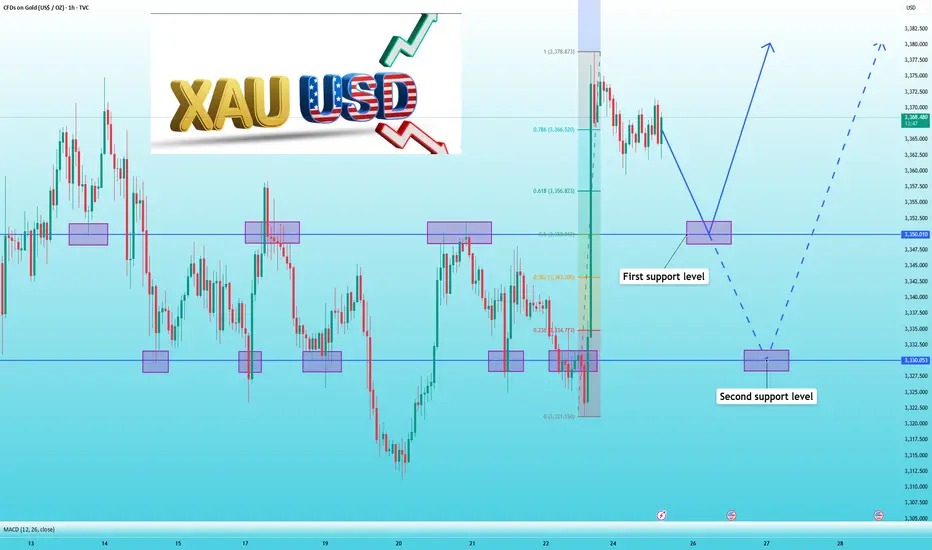
XAUUSD: Don’t rush to chase the rise, wait for a pullback firstThis year's Jackson Hole symposium, held at a policy crossroads for the Federal Reserve over whether to cut interest rates, captivated global attention.
Powell's shift from hawkish to dovish rhetoric ignited the market, completely contradicting previous market forecasts. The US dollar subsequently fell sharply, leading to a breakout rally in gold, from $3,330 to around $3,380.
In the short term, gold prices surged strongly last Friday, with many investors chasing long positions. Therefore, we should be wary of a pullback after profit-taking. Furthermore, Powell's speech last Friday has largely been digested, and the excitement has cooled somewhat.
In the long term, gold prices will undoubtedly continue to rise. A Fed rate cut is imminent, and any reduction, regardless of the magnitude, would represent a resumption of quantitative easing. The resulting situation is foreseeable. The US dollar will continue to decline, while gold will continue to rise, potentially reaching a new all-time high of $3,500.
Looking at the 1-hour gold chart, 3350, which has previously failed to break through, will be the next key support level. If it holds, buy boldly. If it breaks, look for further support at 3330.
Therefore, don't rush into trading. Waiting for the right entry point will be more efficient and more stable.
Lingrid | BNBUSDT Buying Opportunity In Consolidation ZoneBINANCE:BNBUSDT is pulling back after hitting the higher high near resistance and is now testing the key support region around 800. The structure shows a downward trendline acting as pressure, while the broader setup still respects the long-term upward channel. A rebound from the current zone would set the stage for a push toward 880 as long as support holds. Momentum remains bullish in the larger channel context despite short-term corrective waves.
📉 Key Levels
Buy trigger: Rebound from 800 support
Buy zone: 800–805
Target: 880
Invalidation: Below 710
💡 Risks
Breakdown below 800 could shift the structure bearish.
Macro-driven volatility from U.S. inflation data or Fed comments.
Strong resistance at 880–930 may cap upside momentum.
If this idea resonates with you or you have your own opinion, traders, hit the comments. I’m excited to read your thoughts!

Lingrid | GOLD Weekly Market Analysis: Triangle Breakout AttemptThe price perfectly fulfilled my previous weekly outlook . OANDA:XAUUSD has closed around $3,371 as the market approaches a critical juncture within a well-defined triangle consolidation pattern. The recent price action suggests accumulation near key support levels with potential for a decisive directional move ahead.
Current timeframe reveals gold forming a classic triangle pattern over month, with the apex narrowing as volatility contracts. The $3,310 level has emerged as crucial support, representing a higher low formation that maintains the bullish structure. Above, the resistance zone around $3,440 continues to cap upside attempts, creating the horizontal ceiling of the triangle.
The daily timeframe shows fake break at both resistance and support levels, indicating institutional players are testing liquidity before committing to larger positions. The current positioning near $3,350 support suggests gold is building energy for the next significant move, with its apex where resolution typically occurs in explosive fashion.
A notable price projection annotation indicates potential future movement based on historical price action, suggesting the market may be preparing for a significant directional move. This technical forecast aligns with the triangle's measured move potential, highlighting the importance of the current consolidation phase as the pattern nears completion.
Next week key levels to monitor include the $3,350 support floor and the $3,410-$3,440 resistance ceiling. A clean break above $3,440 with volume would target the $3,500+ area, while failure at current support could see a retest of the $3,270 zone. The downward trendline from the July peak continues to act as dynamic resistance, requiring a sustained break to confirm bullish continuation. Triangle patterns often produce moves equal to their widest point, suggesting potential for significant volatility once resolution occurs.
If this idea resonates with you or you have your own opinion, traders, hit the comments. I’m excited to read your thoughts!

Lingrid | EURUSD Major Trendline Breakout. Monthly High RetestFX:EURUSD is bouncing off the higher low after reclaiming the key upward trendline. The structure shows a trendline breakout move with price consolidating above support. As long as 1.1650 holds, buyers could push toward the 1.1832 zone - previous month high. The broader setup suggests momentum is shifting bullish within the ascending channel.
📉 Key Levels
Buy trigger: Rebound from 1.1660 support
Buy zone: 1.1650 – 1.1700
Target: 1.1832
Invalidation: Close below 1.1650
💡 Risks
Failure to sustain above the upward trendline may trigger renewed selling.
Macro data surprises from the US or EU could shift short-term sentiment.
Stronger USD recovery across majors may cap upside momentum.
If this idea resonates with you or you have your own opinion, traders, hit the comments. I’m excited to read your thoughts!

Lingrid | BTCUSDT Corrective Move. Potential Buying OpportunityBINANCE:BTCUSDT is pulling back from a failed breakout above the resistance zone after making a higher high. The structure shows a compression channel that broke to the upside but quickly reversed into a corrective move. A rebound from the $110,000 support zone would validate the setup for another push higher. Momentum suggests a potential recovery back into the upper range if buyers defend support strongly.
📉 Key Levels:
Buy trigger: Rejection of $110,000 support and recovery above $113,000
Buy zone: $110,000 – $111,000
Target: $118,500
Invalidation: Close below $105,174
💡 Risks:
Failure to hold $110,000 support could trigger deeper downside.
Macroeconomic headwinds or stronger USD may suppress bullish momentum.
Weak buyer volume on recovery could leave the move vulnerable to another fakeout.
If this idea resonates with you or you have your own opinion, traders, hit the comments. I’m excited to read your thoughts!

Lingrid | SUIUSDT Potential Following Pattern BreakoutBINANCE:SUIUSDT has bounced from support after a period of consolidation and is holding inside a broader resistance zone. The structure shows a descending triangle pattern forming under the downward trendline, with higher lows providing a base for pressure. A breakout above the resistance line could confirm upside continuation toward the next target zone. Broader momentum remains bullish as long as price sustains above support and higher lows hold the structure.
📉 Key Levels
Buy trigger: Break above descending triangle resistance
Buy zone: 3.50–3.60 accumulation area
arget: 4.18
Invalidation: A close below 3.00 support
💡 Risks
Failure to sustain above the higher low could trigger renewed bearish momentum.
Broader crypto market weakness or negative sentiment could stall breakout attempts.
Upcoming macro data or unexpected events could increase volatility and reject breakout.
If this idea resonates with you or you have your own opinion, traders, hit the comments. I’m excited to read your thoughts!

GOLD - Long📊 XAUUSD – 4H Setup
Gold finally broke out of the descending trendline 📈 after days of bearish movement.
Price tapped into the 3325 demand zone and pushed higher, showing fresh bullish intent.
Right now a clean retest of support could open the door for continuation into key resistance.
📍 Key Levels
Buy zone: 3350 demand retest level
First target: 3400 short-term resistance
Extended target: 3439 supply zone
Invalidation: Close below 3310 ⚠️
💡 Risks
False breakout above trendline trapping longs
Weak follow-through volume could send price back into the range
Macro pressure from USD strength keeping gold capped under 3380
✨ Big Picture
Gold has been coiling for weeks. If buyers defend 3325, we could see this breakout develop into a bigger bullish leg 🚀
👇 What’s your take traders? Breakout or fakeout?
🟢 Education only 🟢
❤️ Like + Follow for consistent swing ideas.

Lingrid | GOLD Broke Above Corrective Dynamic ResistanceOANDA:XAUUSD is attempting to recover after a strong sell-off from the resistance zone, with price currently testing the compression channel breakout. Structure highlights a descending sequence with a lower high, flag formations, and a downward trendline keeping the sideways tone intact. If the breakout holds above the compression channel, price could push toward 3,380, but rejection may open room back into deeper support. Broader momentum shows a corrective bearish leg softening, with potential bullish relief rally if buyers defend current levels.
📉 Key Levels:
Buy trigger: Sustained breakout above 3,320 support-turned-resistance.
Buy zone: 3,320–3,330, if buyers maintain control after breakout.
Target: 3,380 near-term resistance.
Invalidation: Breakdown below 3,250 would negate bullish setup.
💡 Risks:
Failure to sustain breakout, leading to continuation of the downtrend.
Strong USD momentum from macroeconomic releases could weigh on gold.
Geopolitical risk shifts that reprice safe-haven demand unpredictably.
If this idea resonates with you or you have your own opinion, traders, hit the comments. I’m excited to read your thoughts!
