Lingrid | GBPJPY Demand Support Long OpportunityFX:GBPJPY is showing a potential short-term rebound setup after rejecting the support zone near 198.70. Price action remains inside a broad descending channel but has reached the confluence of the lower boundary and prior breakout zone, which often attracts dip buyers. A minor recovery toward 201.00 resistance could unfold before sellers attempt to resume the broader downtrend. This structure signals a corrective bullish phase within the bearish bias.
⚠️ Risks:
Unexpected hawkish comments from the Bank of Japan could trigger JPY strength and accelerate declines.
Rising U.K. bond yields might temporarily boost GBP demand, distorting short-term setups.
Failure to hold 198.70 support could expose 197.00 and extend the bearish continuation.
If this idea resonates with you or you have your own opinion, traders, hit the comments. I’m excited to read your thoughts!
Signalsprovider

Lingrid | XRPUSDT Downside Pressure AcceleratingBINANCE:XRPUSDT trades below the descending trendline inside a clearly defined downward channel, keeping the broader structure bearish. Price action has recently tested the $2.44 zone but failed to sustain a breakout, signaling continued weakness. As long as the pair stays under $2.50 resistance, a retest toward $2.00 support remains the likely path. Momentum indicators align with a slow drift lower, reinforcing short-term bearish control.
⚠️ Risks:
A sudden Bitcoin rally could lift altcoins and negate the bearish setup.
Positive regulatory news around XRP may trigger unexpected volatility.
U.S. macro data or risk sentiment shifts could strengthen USD demand dynamics.
If this idea resonates with you or you have your own opinion, traders, hit the comments. I’m excited to read your thoughts!

Lingrid | AUDCAD Channel Resistance Selling OpportunityFX:AUDCAD rejected at 0.9186 resistance with a lower high under the descending trendline while stalling at the rising trendline confluence. Price action shows a series of lower highs after a range and fake break, pressing into the uptrend line from below. If 0.9186–0.9190 holds and price slips back under the blue trendline, a drift toward 0.9156 then 0.9126 support is likely; a decisive close above 0.9190–0.9200 would invalidate the short setup. Short-term momentum favors a bearish rotation within the broader resistance zone before any fresh attempt higher.
⚠️ Risks:
Strong risk-on tone in equities/commodities lifting AUD relative to CAD.
Reclaim and hold above 0.9190–0.9200, turning the confluence into support.
Sharp oil weakness undermining CAD and reducing downside follow-through.
If this idea resonates with you or you have your own opinion, traders, hit the comments. I’m excited to read your thoughts!

Lingrid | GOLD Market Consolidation Continues After DropOANDA:XAUUSD bounced from the channel base but remains capped under the downward trendline and the 4,080–4,100 supply band. Price action is carving a lower-high sequence within a falling channel after a failed retest, with a choppy mid-range consolidation. Below 4,080, sellers can press for 3,900 with 3,827 as an extension on momentum builds. A regain and hold above 4,100–4,135 would neutralize the bearish skew and reopen 4,200+.
⚠️ Risks:
Breakout and sustained close above the downward trendline (≈4,100–4,135) squeezes shorts and flips bias.
Softer-than-expected U.S. data or a risk-off shock (safe-haven bid) drives yields lower and lifts gold.
Positioning/short-covering into key calendar events spikes volatility and invalidates intraday structures.
If this idea resonates with you or you have your own opinion, traders, hit the comments. I’m excited to read your thoughts!

Lingrid | TONUSDT Pullback Trading OpportunityThe price perfectly fulfilled my previous idea . OKX:TONUSDT rejected from resistance and began to slide, confirming a bearish reaction from the upper boundary. The structure shows a consolidation breakdown followed by lower highs forming beneath the trendline. A drop below 2.00 could accelerate toward 1.88–1.79 as the market resumes its downward phase. Bearish momentum remains dominant while the pattern points toward a continuation of the sell-off.
⚠️ Risks:
A sudden BTC rally could lift the broader crypto market and delay further decline.
Strong buying pressure near the 1.90 zone might trigger a temporary rebound.
Unexpected positive TON ecosystem news could invalidate the bearish setup.
If this idea resonates with you or you have your own opinion, traders, hit the comments. I’m excited to read your thoughts!

Lingrid | ZECUSDT Short-Term Pullback After Bull TrapBINANCE:ZECUSDT is pressing into the 520–525 resistance band after a strong run within the upward channel, where liquidity above prior highs could invite a quick wick. Price action shows a steady sequence of higher highs/higher lows riding the rising trendline, but fake break setup may occur. If price holds above 498–502 after any sweep, a continuation toward 523–530 remains in play; a rejection and close back below 498 would open a rotation toward 475–460. Momentum stays bullish short-term, yet proximity to a major supply cluster argues for fade-risk before continuation.
⚠️ Risks:
Broad crypto pullback or BTC dominance spike rotating capital out of mid-caps.
Loss of the 498–500 trendline cluster, invalidating the local higher-low structure.
Negative macro headlines or hot U.S. inflation prints dampening risk appetite.
If this idea resonates with you or you have your own opinion, traders, hit the comments. I’m excited to read your thoughts!

Lingrid | GOLD Trend Continuation Pattern FormedOANDA:XAUUSD continues consolidating inside a broad descending channel after a failed attempt to break above 4050 resistance. Price action shows multiple rejections from the upper boundary while forming lower highs — a signal that sellers remain active. The focus now shifts toward the 3900 level as the next downside test, with a possible rebound near this zone before further direction develops. Momentum remains neutral-to-bearish unless bulls reclaim the 4060–4080 range.
⚠️ Risks:
Strong U.S. employment data this week could boost USD strength and extend downside pressure.
Rising Treasury yields may suppress gold’s short-term recovery potential.
Unexpected geopolitical tensions could trigger safe-haven inflows, distorting the bearish setup.
If this idea resonates with you or you have your own opinion, traders, hit the comments. I’m excited to read your thoughts!

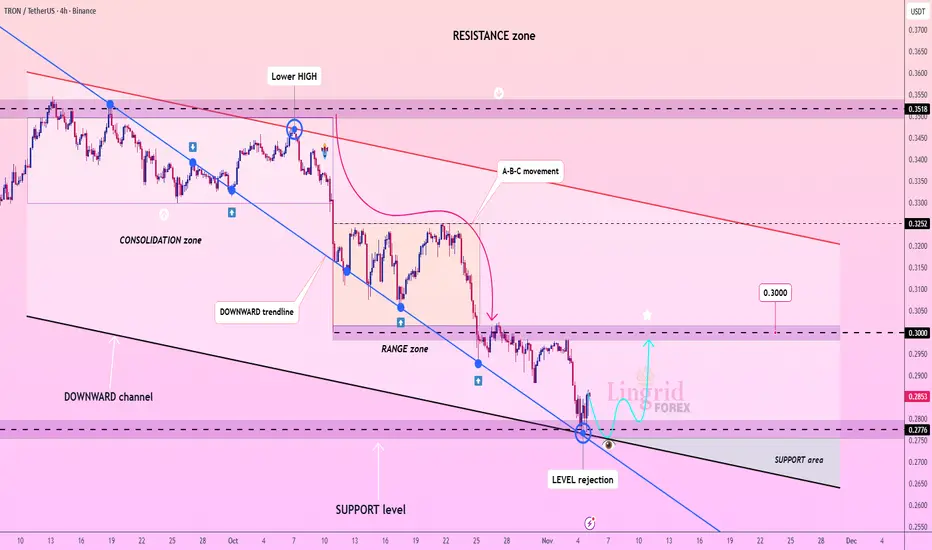
Lingrid | TRXUSDT Correction Rally Following DropThe price perfectly fulfilled my previous idea . BINANCE:TRXUSDT is showing early signs of reversal after rejecting the support level near 0.2770. Price action remains within a clear downward channel, but buyers have managed to defend the lower boundary, creating a possible short-term rebound setup. A sustained move above 0.2900 could open a path toward the 0.3000 resistance zone, where sellers are expected to return. This structure hints at a corrective phase before the broader bearish trend resumes.
⚠️ Risks:
Stronger-than-expected U.S. job data or inflation could boost the USD and pressure TRX lower.
Bitcoin volatility spikes may undermine altcoin recovery momentum.
Failure to hold the 0.2770 level could invalidate the short-term rebound setup.
If this idea resonates with you or you have your own opinion, traders, hit the comments. I’m excited to read your thoughts!
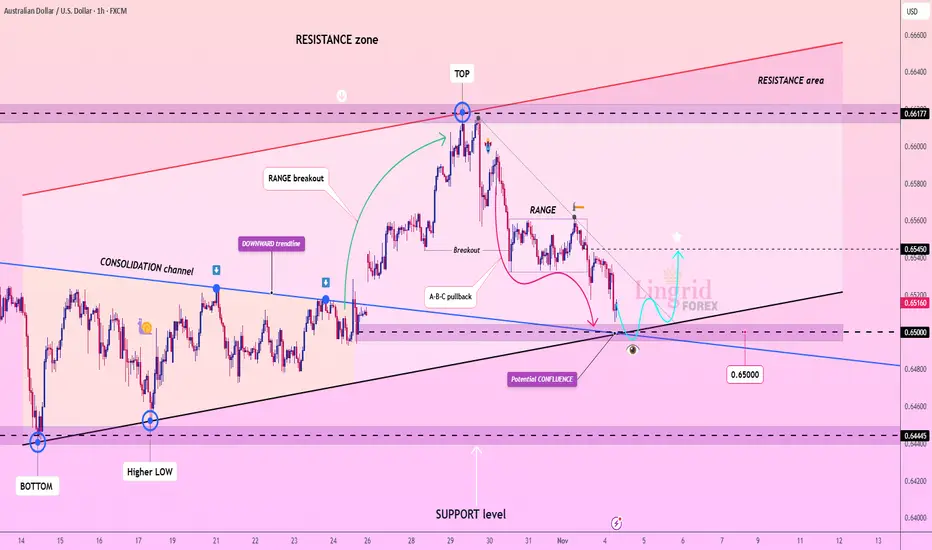
Lingrid | AUDUSD Psychological Support Long OpportunityThe price perfectly fulfilled my previous idea . FX:AUDUSD is testing the confluence support near 0.6500 after retracing from the 0.6617 resistance zone. Price action forms an A-B-C pullback pattern within a consolidation channel, suggesting the potential for a short-term rebound. Holding above 0.6500 could attract buyers aiming for 0.6545 resistance. Broader momentum supports a mild bullish recovery as long as this level remains intact.
⚠️ Risks:
Unexpected hawkish tone from the Federal Reserve could strengthen USD and cap recovery.
Weak Australian trade or employment data may renew downside pressure.
A sharp drop in commodity prices could undermine AUD sentiment.
If this idea resonates with you or you have your own opinion, traders, hit the comments. I’m excited to read your thoughts!
Lingrid | GOLD Weekly Market Outlook. Rally’s End or Reset?OANDA:XAUUSD explosive October rally — crowned by a historic monthly candle that shattered resistance and ignited euphoria — has now entered its reckoning phase. What looked like unstoppable momentum is now revealing signs of exhaustion. The sharp, volume-fueled drop toward $4,000 isn’t just a “healthy correction” — it’s the first real test of whether this bull can withstand gravity. And right now, the charts are whispering: "it may go down south".
The 4H chart reveals a classic “impulse leg” followed by an aggressive A-B-C correction — and we’re still in the “C” leg. But here’s the twist: if price breaks below $3,850 with conviction, the entire bullish structure collapses. That would open the door to a much deeper pullback — potentially down to $3,700 or even $3,600, targeting prior support zones and retesting the long-term upward channel’s lower boundary.
The monthly chart confirms the big picture: gold is in a powerful uptrend, but also in overbought territory after a vertical spike. The October candle closed above its open — a sign of strength, yes — but also a potential exhaustion signal since it formed a pinbar pattern. When markets rise too fast, they often fall harder.
In essence, gold is no longer climbing — it’s consolidating under pressure. The bull hasn’t died, but it’s breathing heavily. For us, this means one thing: sell the rips, buy the dips only if structure holds. The path of least resistance may now be downward. We should wait for confirmations.
If this idea resonates with you or you have your own opinion, traders, hit the comments. I’m excited to read your thoughts!

Lingrid | EURUSD Key Support Zone Hold Brief Bull MoveThe price perfectly fulfilled my previous idea . FX:EURUSD is approaching the key psychological level near 1.1500, signaling a short-term bullish move may occur within the broader downtrend. Price action shows a potential A-B-C recovery structure forming above the support zone, supported by early buying pressure from lower levels. If momentum continues, the pair could retest the 1.1610–1.1710 resistance range before facing renewed selling interest. Overall, buyers might attempt a corrective rebound toward the upper boundary of the descending channel.
⚠️ Risks:
NFP data could cap the rebound and resume downside momentum.
Upcoming Unemployment Rate and PCE may increase volatility..
A breakdown below 1.1500 would invalidate the short-term bullish scenario.
If this idea resonates with you or you have your own opinion, traders, hit the comments. I’m excited to read your thoughts!

DXY Analysis — Bulls at 100: Continuation or Correction?In my latest DXY analyses, I mentioned that the index could reverse and push higher, with the 100 figure acting as a key zone to watch for bulls.
Indeed, on Friday the index climbed right into this area and is now showing signs of minor consolidation.
The key question now:
👉 Will the DXY manage to continue above this critical level, or is it time for a pause?
In my view, a correction is looming for the index. Even if we see a short-term spike above 100, I expect it to be unsustainable.
For the near future, DXY could remain in a range-trading environment, with 100 as resistance and 97.50 as support.

Lingrid | BTCUSDT Support Break Bear Trend ContinuationBINANCE:BTCUSDT is trading inside a broad descending formation after rejecting from the upper resistance band near 116K. Price action has been forming lower highs while respecting the downward trendline and consolidating between 110K. As long as this zone holds, a short-term recovery toward 110K may occur before renewed selling pressure returns. Overall momentum remains bearish, with a potential drop toward the 102K–95K support area.
⚠️ Risks:
Unexpected strength in U.S. economic data could increase volatility and delay downside continuation.
ETF inflows resuming could strengthen spot demand.
Failure of price to stay below 110K would invalidate the bearish outlook.
If this idea resonates with you or you have your own opinion, traders, hit the comments. I’m excited to read your thoughts!

Lingrid | LINKUSDT Follow Through Pattern FormingBINANCE:LINKUSDT price action shows continued rejection from the descending trendline inside a well-defined downward channel. The structure remains bearish, with lower highs forming under resistance near $18.00. As long as this rejection holds, price could revisit the support area toward $15.00 before potential stabilization. Overall momentum aligns with a continuation of the broader downtrend.
⚠️ Risks:
Unexpected dovish shift in Fed tone boosting overall crypto sentiment
Strong BTC recovery above $120K improving altcoin structure
Short-term liquidity spikes causing false breakouts above $18.00
If this idea resonates with you or you have your own opinion, traders, hit the comments. I’m excited to read your thoughts!

Lingrid | TONUSDT Key Confluence Support Long OpportunityThe price perfectly fulfilled my previous idea . OKX:TONUSDT is retesting the key confluence area near 2.13 after multiple higher lows formed along the ascending support trendline. Price action shows compression within a narrowing structure, hinting at potential breakout momentum building up. A confirmed bounce from this support may lift price toward 2.28, aligning with short-term resistance and the upper boundary of the range. Overall bias stays bullish as long as the 2.10–2.13 support cluster holds firm.
⚠️ Risks:
Failure to hold the 2.10 support zone could invalidate the bullish scenario.
Increased volatility ahead of macro data releases could cause short-term whipsaws.
Weak momentum or low trading volume may limit the breakout’s sustainability.
If this idea resonates with you or you have your own opinion, traders, hit the comments. I’m excited to read your thoughts!

Lingrid | GOLD Post Rate Decision Market ResponseOANDA:XAUUSD has rebounded from the lower boundary of the upward channel, maintaining structure support above $3,900. Price action shows a higher low forming after a wedge correction, hinting at renewed bullish pressure. A sustained hold above the $3,905–$3,950 zone could pave the way for a move toward $4,135. Momentum remains positive as buyers defend key support within the broader ascending structure.
⚠️ Risks:
Stronger U.S. dollar amid higher Treasury yields.
Unexpected hawkish tone from Federal Reserve policymakers.
Break below $3,900 invalidating short-term bullish outlook.
If this idea resonates with you or you have your own opinion, traders, hit the comments. I’m excited to read your thoughts!

Lingrid | USDCHF Structure Based Trade SetupFX:USDCHF is trading near the upper boundary of its multi-week range, testing the resistance zone at 0.8050–0.8060. Price action shows repeated rejections from this area while maintaining a higher-low structure supported by an ascending trendline. A short-term pullback toward 0.7980 could occur before any possible bullish attempt. Overall, the pair remains range-bound with momentum gradually tightening under resistance.
⚠️ Risks:
Unexpected FOMC statement volatility could shift USD sentiment.
A breakout above 0.8060 may invalidate the short-term pullback view.
Weak U.S. macro data could accelerate downside pressure toward 0.7870.
If this idea resonates with you or you have your own opinion, traders, hit the comments. I’m excited to read your thoughts!

Lingrid | SOLUSDT Continuation Short Pattern BuildingBINANCE:SOLUSDT is consolidating within a defined downward channel after a sequence of lower highs and extended impulse legs. Price action is currently hovering near mid-range resistance, showing hesitation below the descending trendline. A rejection from this level may drive the pair back toward the $169 support, completing the projected move. The overall market tone remains bearish while the channel boundaries continue to confine momentum.
⚠️ Risks:
Sudden short squeezes could trigger a false breakout above $193.
Fed policy commentary this week may increase volatility across risk assets.
Strong crypto inflows could weaken bearish continuation signals.
If this idea resonates with you or you have your own opinion, traders, hit the comments. I’m excited to read your thoughts!

AAPL Apple Options Ahead of EarningsIf you haven`t bought the dip on AAPL:
Now analyzing the options chain and the chart patterns of AAPL Apple prior to the earnings report this week,
I would consider purchasing the 255usd strike price Calls with
an expiration date of 2025-11-21,
for a premium of approximately $18.65.
If these options prove to be profitable prior to the earnings release, I would sell at least half of them.

Lingrid | EURUSD Potential Bearish Momentum From Resistance ZoneThe price perfectly fulfilled my previous idea . FX:EURUSD is hovering just below the descending trendline after multiple failed attempts to reclaim resistance, showing clear weakness near 1.16675. The pair remains confined within a broad descending channel structure, with sellers defending each rally toward the upper boundary. A breakdown below 1.1600 could trigger renewed pressure toward 1.15400 and possibly the 1.151 handle if downside momentum accelerates. Broader sentiment favors continuation of the bearish leg as long as price remains capped below 1.16970 and the macro backdrop supports USD strength.
⚠️ Risks:
A dovish tone from the upcoming Federal Funds Rate decision on Thursday could weaken the USD and spark a bullish reversal.
Short-term oversold conditions may lead to a corrective bounce toward 1.16675.
Unexpected positive Eurozone data could offset bearish technicals and limit downside potential.
If this idea resonates with you or you have your own opinion, traders, hit the comments. I’m excited to read your thoughts!

Lingrid | AUDUSD Major Resistance Short SetupThe price perfectly fulfilled my previous idea . FX:AUDUSD is currently testing the upper boundary of its consolidation zone near 0.6624 after breaking out of an ascending triangle pattern. Price action is interacting with both the downward trendline and the newly formed upward trendline, signaling a potential exhaustion point. A rejection from this confluence area could trigger a corrective leg toward 0.6529 as part of a short-term retracement phase. Bears may regain control if momentum fades near the 0.6620–0.6640 resistance range.
⚠️ Risks:
Unexpected dovish commentary from the Federal Reserve could support the pair higher.
Breakout above 0.6640 may invalidate the bearish setup and shift momentum upward.
Reduced volatility before key U.S. economic data could delay confirmation of the move.
If this idea resonates with you or you have your own opinion, traders, hit the comments. I’m excited to read your thoughts!

SBUX Starbucks Corporation Options Ahead of EarningsIf you haven`t bought SBUX ahead of the previous earnings:
Now analyzing the options chain and the chart patterns of SBUX Starbucks Corporation prior to the earnings report this week,
I would consider purchasing the 84usd strike price Puts with
an expiration date of 2025-10-31,
for a premium of approximately $3.20.
If these options prove to be profitable prior to the earnings release, I would sell at least half of them.

Lingrid | GOLD Weekly Support Zone: Short Term Upside MoveOANDA:XAUUSD is approaching the weekly support area near 3,880, suggesting a short-term bullish impulse might be formed within the downward channel. Price action now moved below the 4,050, which aligns with prior breakdown structure and acts as a potential resistance level. As long as price sustains above 3,880, buyers may push toward 4,050 before meeting stronger resistance. Potential rejection near the lower channel boundary may hint at a corrective recovery phase gaining traction.
⚠️ Risks:
Federal Funds Rate decision on could reignite bearish momentum.
Rising Treasury yields may suppress gold’s short-term recovery potential.
Failure to hold above 3,880 would invalidate the short-term bullish scenario.
If this idea resonates with you or you have your own opinion, traders, hit the comments. I’m excited to read your thoughts!
