Lingrid | GOLD Consolidation - Breakout - Momentum TradeThe price perfectly fulfilled my previous idea . OANDA:XAUUSD recently made new all-time high inside a steep upward channel, maintaining strong bullish momentum. The structure suggests a healthy correction phase forming a short-term range above the 4,280 support zone. As long as the price remains above the upward trendline, the bullish structure remains intact with potential continuation toward 4,450 and higher. The ongoing range formation may serve as consolidation before the next impulsive breakout higher.
⚠️ Risks:
A sustained break below 4,280 could trigger a deeper correction.
Rising U.S. yields or hawkish Fed comments may weigh on gold prices.
Reduced geopolitical tension could cool safe-haven demand.
If this idea resonates with you or you have your own opinion, traders, hit the comments. I’m excited to read your thoughts!
Signalsprovider

Lingrid | EURAUD Failed Break Resistance Fade TradeThe price perfectly fulfilled my previous idea . FX:EURAUD surged strongly after rebounding from the double-bottom setup, completing an A-B-C bullish correction into the resistance area near 1.820. The structure now shows signs of exhaustion after a fake breakout above the psychological level, suggesting a potential short setup. Price remains within an upward channel but has started to lose momentum near the upper boundary. A failure to sustain above 1.8200 could confirm a pullback toward the 1.800 support zone.
⚠️ Risks:
A break and close above 1.820 could invalidate the short setup.
Unexpected AUD weakness from macro data could trigger renewed buying.
Broader risk-on sentiment may support continued bullish pressure.
If this idea resonates with you or you have your own opinion, traders, hit the comments. I’m excited to read your thoughts!

Lingrid | TONUSDT Bearish Formation Short OpportunityOKX:TONUSDT price faced resistance within the descending triangle pattern and rejected near the downward trendline, signaling continuation of its bearish structure. The pair is now hovering just above the 2.10 level, testing the lower range boundary inside the upward channel. A confirmed break below 2.10 could open the way toward 2.00 psychological support as sellers regain control. The overall pattern indicates persistent pressure with a potential retest of deeper support before any sustained recovery attempt.
⚠️ Risks:
A bullish reversal in BTC or broader crypto sentiment could invalidate the bearish setup.
Failure to break below 2.10 may trigger a temporary short squeeze.
Positive macro or regulatory news could shift momentum upward prematurely.
If this idea resonates with you or you have your own opinion, traders, hit the comments. I’m excited to read your thoughts!

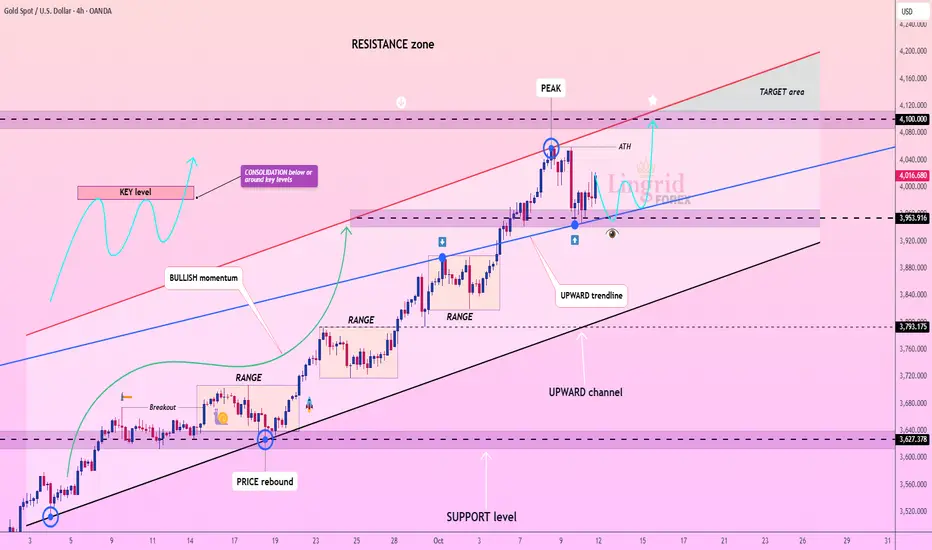
Lingrid | GOLD Channel Breakout Bullish Extension ActiveThe price perfectly fulfilled my previous idea . OANDA:XAUUSD continues its bullish structure within the ascending channel, forming a new A-B-C movement after a clean breakout above the compression zone. Price is consolidating just above the previous breakout level near 4200, setting a potential base for the next impulsive leg higher. A sustained move above 4200 could trigger a push toward 4290, marking a retest of the resistance zone. Momentum remains strong, supported by higher highs and channel integrity, suggesting continuation of the broader uptrend.
⚠️ Risks:
Failure to hold above 4100 may trigger a deeper retest toward 4060.
Strong USD recovery or hawkish Fed remarks could pressure gold prices.
A sudden shift in global risk sentiment could limit bullish continuation.
If this idea resonates with you or you have your own opinion, traders, hit the comments. I’m excited to read your thoughts!

Lingrid | GBPCAD Triple Top Break Bull AccelerationThe price perfectly fulfilled my previous idea . FX:GBPCAD reclaimed the uptrend after a fake break, bouncing from a higher low at the channel base and rotating back above the 1.8765 swap zone. Price structure shows an upward channel with a rising trendline, plus a recent range and triple-high cluster that marks overhead supply. If 1.8765/1.8720 holds, bulls can press toward 1.8950 and the broader resistance area. Momentum remains constructive with higher lows and trend-continuation behavior.
⚠️ Risks:
A daily close back below the uptrend line or 1.8765 would reopen a drift toward 1.8485 support.
CAD strength from oil rallies or BOC Gov Macklem commentary could cap upside.
High-impact U.K. data surprises may trigger volatility against the setup.
If this idea resonates with you or you have your own opinion, traders, hit the comments. I’m excited to read your thoughts!

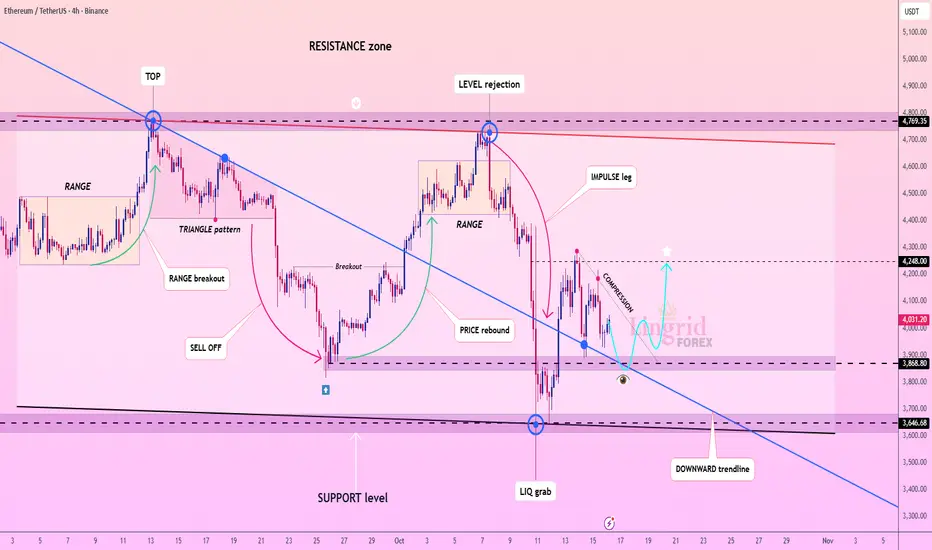
Lingrid | ETHUSDT Squeeze Pattern Breakout ExpectedThe price perfectly fulfilled my previous idea . BINANCE:ETHUSDT rebounded sharply from the liquidity grab near 3500, signaling the defense of the major support level after a deep sell-off. The structure now shows compression just below the downward trendline, hinting at a potential bullish breakout setup. If price sustains above 3900, it could trigger an impulsive rally toward 4250. Momentum remains constructive, and the recovery phase suggests a possible reversal if buyers maintain control.
⚠️ Risks:
Failure to clear the downward trendline may extend the consolidation.
Renewed BTC weakness could cap ETH’s recovery potential.
Unexpected macro data or regulatory developments could pressure the broader crypto market.
If this idea resonates with you or you have your own opinion, traders, hit the comments. I’m excited to read your thoughts!
XAUUSD Delivered Excellent profits [ 1570 pips straight]Thanks to those traders who followed us and made profits 📈🙏 keep grinding 💪.
I booked profits on buying orders during overnight session, entering around 4142 & 4132 and exiting near 4105 while my shorter-term longs hit the 4098 target on yesterday Ny session drop.
Next I bought XAUUSD 4102 which I hold overnight and it's 1200 pips floating in profits.
Going forward, I’ll continue buying dips from my key entry zones as long as Gold holds above the bullish trend till 4170.

Lingrid | AUDCAD Key Swap Level Shorting OpportunityFX:AUDCAD recovered from its double-bottom formation near 0.9063, pushing back into the swap zone around 0.9160 after breaking the short-term resistance. The structure reveals a retest of the upward trendline under a descending resistance channel, suggesting a possible corrective pullback before resuming downside pressure. If price fails to sustain above 0.9160, a decline toward 0.9111 or lower remains likely. Market structure favors a bearish continuation as long as the pair trades below the descending red trendline.
⚠️ Risks:
A sustained breakout above 0.9160 could invalidate the bearish outlook.
Stronger Australian employment or CPI data may fuel short-term upside volatility.
Broad CAD weakness tied to oil price drops could trigger unexpected rallies .
If this idea resonates with you or you have your own opinion, traders, hit the comments. I’m excited to read your thoughts!

Lingrid | SOLUSDT Consolidation Break Expansion SetupBINANCE:SOLUSDT rebounded sharply from the $170 support after a flash crash and is now consolidating near the $200 level within a mid-range structure. The chart shows a sequence of impulse and correction leg price action patterns, with buyers attempting to establish momentum. A stable close above $10 may confirm renewed bullish activity toward the $230 resistance zone. The overall structure suggests range accumulation, with a potential upward breakout forming if momentum persists.
⚠️ Risks:
Failure to hold above $190 could lead to renewed selling pressure.
Broader crypto market weakness may cap any upside recovery.
A stronger dollar or macro risk-off sentiment could stall bullish continuation.
If this idea resonates with you or you have your own opinion, traders, hit the comments. I’m excited to read your thoughts!

Lingrid | GOLD Retracement Entry Trend Continuation SetupThe price perfectly fulfilled my previous idea . OANDA:XAUUSD remains within its strong upward channel, rebounding each time from its dynamic trendline to form higher lows. The structure displays clear bullish momentum supported by consecutive range breakouts and sustained trend continuation. A stable hold above 4,050 could trigger a renewed rally toward 4,200 and possibly 4,250 resistance. The broader market structure confirms steady accumulation, keeping buyers in control of the short-term trend.
⚠️ Risks:
A break below 4,060 could weaken bullish pressure and lead to a deeper correction.
Rising U.S. yields or hawkish Fed Chair Powell commentary may limit upside momentum.
Unexpected macro data or geopolitical developments could cause short-term volatility.
If this idea resonates with you or you have your own opinion, traders, hit the comments. I’m excited to read your thoughts!

Lingrid | AUDUSD Demand Zone Bounce OpportunityFX:AUDUSD extended its decline after a clear rejection from the resistance zone, breaking below both its upward channel and short-term support trendline. Price is now approaching the demand zone near 0.6430. A rejection and rebound above 0.6430 would confirm a short-term recovery setup as buyers attempt to regain control. Momentum currently leans corrective rather than impulsive, suggesting a possible consolidation before any larger directional move.
⚠️ Risks:
Weakness in commodities or a stronger USD could delay recovery attempts.
Failure to hold 0.6430 may expose price to deeper losses.
Upcoming U.S. macro data could increase volatility across USD pairs.
If this idea resonates with you or you have your own opinion, traders, hit the comments. I’m excited to read your thoughts!

Lingrid | DOGEUSDT Range Bound Market AnticipatedThe price perfectly fulfilled my previous idea . OKX:DOGEUSDT dropped sharply after forming a lower high near the resistance trendline, confirming a clean breakdown from its triangle formation. The market is now consolidating near the support zone. A sustained hold above 0.180 could initiate a rebound toward 0.231 as momentum stabilizes. Recent volatility seems corrective in nature, implying that price may attempt a recovery once consolidation completes.
⚠️ Risks:
Broader market weakness could extend the correction phase.
Failure to hold 0.182 support may trigger deeper retracement.
Any negative crypto sentiment or BTC pullback could delay recovery.
If this idea resonates with you or you have your own opinion, traders, hit the comments. I’m excited to read your thoughts!

Lingrid | GOLD Weekly Outlook: Dip-Buying Dominance ContinuesThe price perfectly fulfilled my previous weekly idea . OANDA:XAUUSD market delivered another impressive performance this week, decisively pushing through the psychologically significant $4,000 threshold. While this round number naturally attracts considerable market attention, seasoned traders recognize it as simply another milestone in gold's broader trajectory rather than a definitive ceiling.
What's particularly noteworthy is the dramatic increase in market volatility. Recent weeks have demonstrated a pattern where pullbacks averaging around 2% are consistently followed by rallies exceeding 4.5%. This asymmetric price action—where advances substantially outpace corrections—reveals strong underlying bullish momentum and aggressive buying on dips. The market may easily absorb a 2.8% pullback before staging another robust recovery, reinforcing this established rhythm.
Price action shows gold trading within a well-defined upward channel, with price respecting both the lower trendline support near $3,950 and approaching the upper resistance zone around $4,100. The all-time high formation near $4,060 marked a crucial peak, and current consolidation below this level suggests the market is building energy for the next directional move.
Key support remains anchored around $3,950, while the upward channel structure indicates potential targets extending into the $4,100-$4,200 range. The combination of persistent bullish momentum, widening volatility swings, and successful defense of higher lows points to a market that's far from exhausted. We should watch for either a breakout above $4,060 toward the target area or a retest of channel support before the next advance materializes.
If this idea resonates with you or you have your own opinion, traders, hit the comments. I’m excited to read your thoughts!
Lingrid | EURUSD Resistance Rejection: Bearish ContinuationThe price perfectly fulfilled my previous idea . FX:EURUSD continues to slide after rejecting the 1.1700 resistance and failing to maintain consolidation highs. Price action shows a break below the midrange structure, confirming bearish momentum within the descending setup. The pair now tests the upward trendline, with potential to revisit the 1.1545 support if 1.1680 remains unbroken. Overall, market sentiment suggests a controlled downside correction as traders position for deeper pullback phases.
⚠️ Risks:
A break back above 1.1680 could invalidate the bearish structure.
Dollar weakness driven by macro data may fuel short-covering.
Unexpected ECB policy comments could trigger sharp volatility.
If this idea resonates with you or you have your own opinion, traders, hit the comments. I’m excited to read your thoughts!

Lingrid | BTCUSDT Sharp Drop Creates Buying OpportunityThe price perfectly fulfilled my previous idea . BINANCE:BTCUSDT rebounded sharply from the 102,100 support level after a flash crash, signaling renewed demand near structural lows. Price action remains inside a wide consolidation range, with the 119,500 target acting as a key resistance level. A sustained price movement above the trendline could confirm recovery momentum toward ATH at 125,000. The flash crash likely shook out weak hands before market stabilization and potential re-accumulation.
⚠️ Risks:
Another liquidity flush below 108,000 could trigger panic selling.
Broader risk-off sentiment across crypto could delay recovery.
Failure to reclaim 119,500 may reinforce short-term bearish pressure.
If this idea resonates with you or you have your own opinion, traders, hit the comments. I’m excited to read your thoughts!

Lingrid | TRXUSDT Market Disruption Sideways Period LikelyBINANCE:TRXUSDT is consolidating under pressure after a sharp rejection from 0.3277, sustaining its bearish structure inside the downward channel. The chart reflects a sequence of lower highs, aligning with continued seller dominance and weak momentum. A short-term bounce toward 0.3277 could precede another drop toward the 0.3000 buying area. Broader picture suggest markets will go sideways for a while because after shock prices consolidates.
⚠️ Risks:
A confirmed close above 0.3277 could shift bias to neutral.
Bitcoin recovery may pull altcoins higher temporarily.
Sudden sentiment shifts from global macro events could trigger volatility.
If this idea resonates with you or you have your own opinion, traders, hit the comments. I’m excited to read your thoughts!

Lingrid | GOLD Bullish Trend Extension OpportunityOANDA:XAUUSD remains in a strong bullish structure, holding above the confluence zone near 3,940 and respecting the upward trendline. Price action forms higher highs inside the ascending channel, suggesting continuation toward the 4,055–4,100 resistance zone in the mid-term. As long as 3,940 holds as support, the next leg toward the 4055 target remains valid. Broader trend momentum confirms sustained buying pressure aligned with the overall bullish trajectory.
⚠️ Risks:
A close below 3,940 could invalidate the bullish continuation setup.
Sudden shifts in U.S. economic data or Treasury yields may strengthen the dollar.
Market reaction to inflation-related announcements could trigger short-term volatility.
If this idea resonates with you or you have your own opinion, traders, hit the comments. I’m excited to read your thoughts!

Lingrid | GBPUSD Support Breakdown Short OpportunityFX:GBPUSD is moving within a sustained downtrend after rejecting the 1.3667 resistance zone and forming a series of lower highs. Price action confirms a descending triangle breakout and equal lows, with momentum now focused on the 1.3200 support target. As long as the downward trendline caps recovery attempts near 1.3350, bearish continuation remains the dominant outlook. Structural pressure indicates sellers are controlling momentum toward the broader support area below 1.3200.
⚠️ Risks:
A strong break above 1.3350 could trigger a short-term corrective rally.
Unexpected U.K. macro data or U.S. dollar weakness may disrupt the sell setup.
A rebound from the 1.3200 level could shift sentiment back toward consolidation.
If this idea resonates with you or you have your own opinion, traders, hit the comments. I’m excited to read your thoughts!

Lingrid | TONUSDT Consolidation Buy After Sell-OffThe price perfectly fulfilled my previous idea . OKX:TONUSDT is consolidating after rebound from the 2.65 support level after forming a higher low near the trendline confluence. Price action shows compression followed by a short-term reversal setup pointing toward 2.78 resistance. As long as 2.65 holds, bullish recovery toward the upper boundary of the consolidation zone remains in play. Market structure suggests renewed buying interest may challenge 2.91 if momentum strengthens.
⚠️ Risks:
A close below 2.65 could reopen the path toward 2.60 support.
Weak overall market sentiment could limit upside recovery.
Unexpected macro or regulatory headlines may trigger temporary volatility.
If this idea resonates with you or you have your own opinion, traders, hit the comments. I’m excited to read your thoughts!

Lingrid | GOLD Psychological Barrier Cleared Upside IntactThe price perfectly fulfilled my previous idea . OANDA:XAUUSD continues its climb inside the upward channel, holding above the key 4,000 support after a clean rebound. Price action shows consistent higher lows supported by the upward trendline, signaling sustained bullish momentum. As long as the 4,000 level remains intact, a move toward 4,100 and potentially higher remains in play. The structure points to buyers consolidating for another extension within the ongoing trend.
⚠️ Risks:
A break below 4,000 could trigger a deeper retracement toward 3,950 support.
Rising U.S. yields or FOMC meeting may dampen gold’s momentum.
Profit-taking near psychological resistance could slow short-term upside continuation.
If this idea resonates with you or you have your own opinion, traders, hit the comments. I’m excited to read your thoughts!

Lingrid | USDCHF Key Handle 0.8000 Buy OpportunityThe price perfectly fulfilled my previous idea . FX:USDCHF is moving above the 0.8000 upward trendline following a breakout from the descending channel. The structure reveals an inverse head and shoulders formation, signaling a potential bullish reversal toward the 0.8090 resistance zone. As long as price holds above 0.8000, further upside toward 0.8100 remains favorable. Momentum suggests buying pressure is building for a retest of the upper resistance boundary.
⚠️ Risks:
A drop below 0.8000 could invalidate the bullish setup and trigger a decline toward 0.7846.
USD weakness driven by dovish macro data could cap momentum.
Unexpected shifts in risk sentiment or SNB policy could limit further upside potential.
If this idea resonates with you or you have your own opinion, traders, hit the comments. I’m excited to read your thoughts!

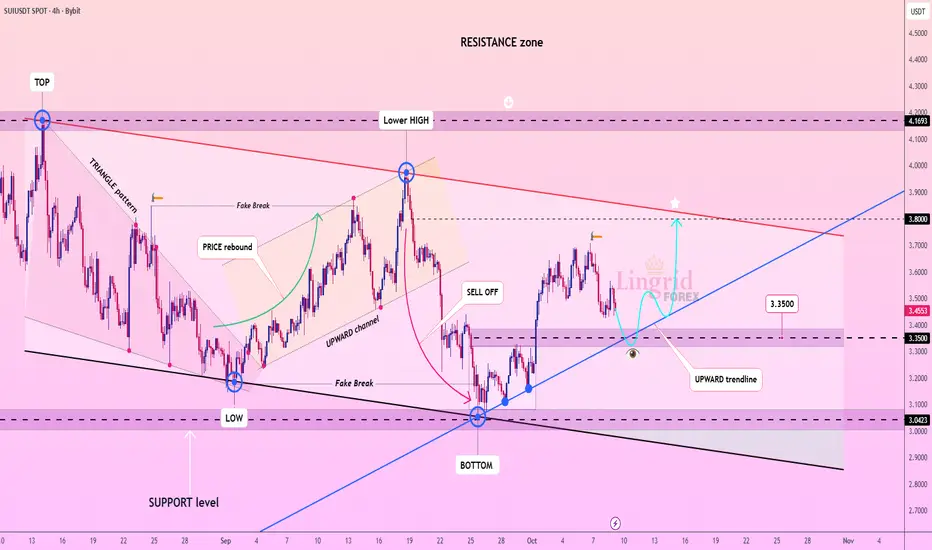
Lingrid | SUIUSDT Support Hold Recovery StabilizationBINANCE:SUIUSDT is pulling back to support 3.35 and upward trendline after a sharp rebound from support zone. The structure shows a recovery attempt within a broader upward correction, suggesting potential move toward 3.80. As long as price holds above 3.35 support, a bullish continuation toward 3.80 remains valid. Momentum is stabilizing, hinting that buyers may regain strength for another test of the upper resistance channel.
⚠️ Risks:
A close below 3.35 could trigger a retest of 3.00 support.
Weakness across major altcoins may limit upside recovery.
Unexpected market sentiment shifts or BTC corrections could suppress the rebound attempt.
If this idea resonates with you or you have your own opinion, traders, hit the comments. I’m excited to read your thoughts!
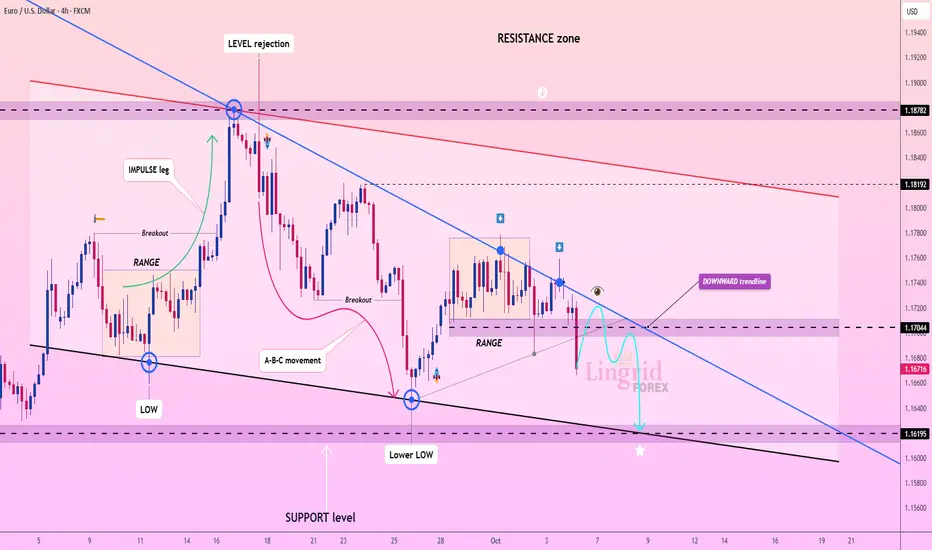
Lingrid | EURUSD Momentum Shift Bearish Movement The price perfectly fulfilled my previous idea . FX:EURUSD is rejecting from the 1.1711 resistance area after testing the downward trendline. Price action shows a descending structure with a sequence of lower highs and lows forming under strong bearish control. A break below 1.1670 could open room for further downside toward the 1.1619 support zone. Momentum favors sellers as the market continues to respect the dominant downtrend channel.
⚠️ Risks:
A close above 1.1711 may invalidate the bearish setup.
Unexpected ECB policy remarks could shift sentiment abruptly.
Broader dollar weakness may delay further downside momentum.
If this idea resonates with you or you have your own opinion, traders, hit the comments. I’m excited to read your thoughts!