BTC: The rebound is not over yet, buy on pullbackDuring the early session, BTC surged to the 94,100 resistance area before encountering selling pressure. The price then retraced to the 92,600 support zone, where it stabilized. This was followed by a modest recovery, and the market is currently consolidating in a high-level compression range with a slight downward bias.
From a technical perspective, the BTC daily chart shows two consecutive bullish candles breaking above the mid-Bollinger band, after which the price has entered a slower consolidation phase. The current small doji indicates that upside momentum has moderated; however, the broader trend still remains within an upward channel.
Short-term pullbacks continue to serve as a re-accumulation phase ahead of the next potential directional move. On the 1-hour timeframe, BTC displays a classic V-shaped reversal structure. Combined with alternating buy-sell pressure on lower timeframes — along with bulls swiftly reclaiming lost ground — this suggests strong buying interest at lower levels. Therefore, the trading bias仍 remains tilted to the long side.
Trading Strategy:
Consider long positions within 92,700–92,300
Upside target: around 94,500
Signaltrading

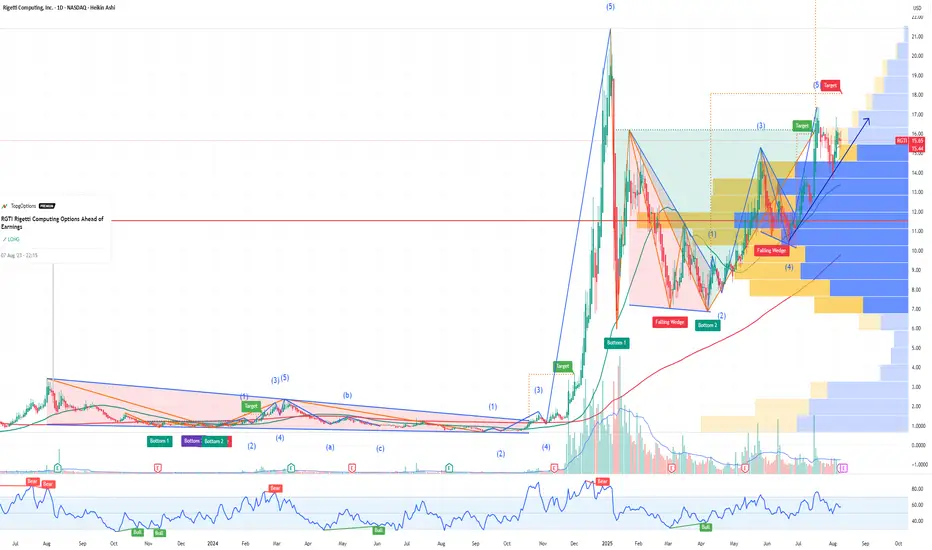
RGTI Rigetti Computing Options Ahead of EarningsIf you haven`t bought RGTI before the rally:
Now analyzing the options chain and the chart patterns of RGTI Rigetti Computing prior to the earnings report this week,
I would consider purchasing the 15usd strike price Calls with
an expiration date of 2027-1-15,
for a premium of approximately $6.20.
If these options prove to be profitable prior to the earnings release, I would sell at least half of them.
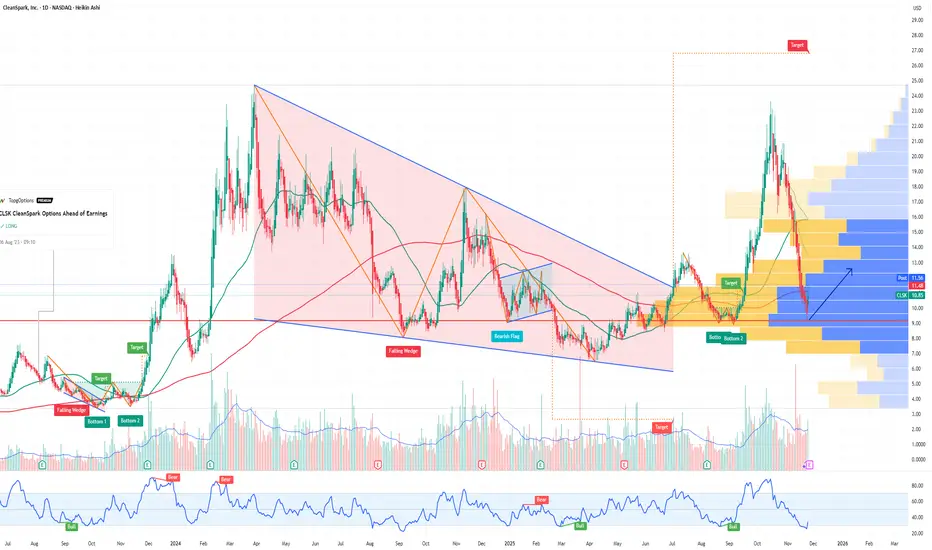
CLSK CleanSpark Options Ahead of EarningsAnalyzing the options chain and the chart patterns of CLSK CleanSpark prior to the earnings report this week,
I would consider purchasing the 12.5usd strike price Calls with
an expiration date of 2026-1-16,
for a premium of approximately $1.42.
If these options prove to be profitable prior to the earnings release, I would sell at least half of them.
Gold Technical Retracement Before Continuing Main Uptrend⏰ Timeframe: 30m
📅 Update: 11/14/2025
🔍 Market Context
After establishing a short-term peak around 4,239 USD, gold is undergoing a technical retracement to rebalance its structure.
The most recent decline formed a Break of Structure (BOS), but the Support Zone around 4,145–4,174 USD continues to serve as a foundation for the medium-term uptrend.
The current price structure indicates the market is re-accumulating momentum before expanding again.
📊 Technical Structure
Order Block (4,239 USD): a short-term resistance zone where the price may react slightly before continuing upward.
Support Zone (4,145–4,174 USD): a confluence zone with Fibo 0.236–0.382, playing a balancing role in the current cycle.
Liquidity Targets:
• 4,261 USD – intermediate liquidity zone.
• 4,293 USD – main expansion target if the uptrend is maintained.
🎯 Market Outlook
High probability scenario:
1️⃣ The price may retrace to the Support Zone or form a higher low around 4,174 USD, then recover to the OB zone at 4,239 USD.
2️⃣ If the uptrend structure breaks, the market may test deeper towards 4,145 USD before bouncing back.
As long as the price holds above this support zone, the primary trend remains bullish continuation.
🧠 Analyst’s View
This is a phase of market re-accumulation after a rapid increase.
Maintaining a higher low structure will be a confirmation signal for the next expansion phase towards 4,261–4,293 USD.
Buyers are still controlling the cash flow, while sellers mainly participate in the short-term resistance zone.
🛡️ Risk Note
The market is in a slight correction phase – avoid impulsive actions when the price has not completed the accumulation zone.

XAU/USD – Price Accumulating in a Narrow Range, Ready to Expand⏰ Timeframe: 30m
📅 Update: 11/12/2025
🔍 Market Context
Gold maintains a neutral structure after forming a Change of Character (CHoCH) around the 4,144 USD area.
Yesterday's session witnessed a narrow fluctuation between the Demand Zone – Support Zone, indicating the market is absorbing liquidity before determining the next direction.
The medium-term upward momentum remains unbroken, but the price needs a clear balancing phase before continuation.
📊 Technical Structure
Demand Zone (4,144 USD): a short-term supply – demand area where the market previously reacted strongly, now becoming a potential testing zone.
Support Zone (4,099 USD): confluence structure – an area where buying flows may return when the price retests.
Order Block (4,081 USD): a deep defensive zone, corresponding to the main Discount area in the current cycle.
Equal Lows (EQL) & CHoCH: indicate a short-term transition between two sides, but the overall bias slightly leans towards an increase.
🎯 Market Outlook
High probability scenario for the day:
1️⃣ Price may fluctuate within the 4,099–4,144 USD balance zone to attract liquidity.
2️⃣ If a strong reaction occurs from the Support Zone or Order Block, gold may establish a new upward move towards 4,165–4,180 USD.
3️⃣ Conversely, if the price closes below 4,081 USD, the short-term structure will temporarily shift to neutral, prioritizing a re-accumulation phase.
🧠 Analyst’s View
Current price behavior reflects a “pause phase” in the larger upward structure.
When the market balances at lower levels, the key observation is not the bounce, but the reaction when liquidity is swept — where the true momentum of the trend is reignited.
As long as the price does not break the 4,081 USD mark, the medium-term upward trend remains intact.
🛡️ Risk Note
This is a technical analysis, not investment advice.
The market can change rapidly during US sessions – wait for clear confirmation from price action before participating.

USD/CHF: Bears Defending the TrendlineUSD/CHF continues to respect the descending channel structure that has been in place since mid-August.
After a short-term recovery, the price is now retesting the upper trendline resistance and the 0.8000–0.8020 supply zone, where sellers have previously stepped in.
Technical Outlook
Structure: Descending channel – clear series of lower highs.
Resistance zone: 0.8000–0.8020 (channel top + previous rejection zone).
Support zone: 0.7870–0.7840 (recent demand area).
Moving averages: Both 50 and 100 MAs are flattening but still below the resistance, suggesting limited bullish momentum.
Bias: Bearish below 0.8020 — expecting rejection and continuation to the downside.
Fundamental Context
Recent U.S. data has shown mixed inflation numbers, while Swiss CPI remains stable, reducing expectations for any SNB intervention.
The stronger Swiss franc remains supported by safe-haven flows amid global uncertainty.
Unless the U.S. delivers a clear upside surprise in macro data, the pair is likely to remain under pressure in Q4.
Trade Setup (Not Financial Advice)
Entry zone: 0.79700–0.79800
Stop-loss: 0.8020
Targets:
TP1 → 0.7900
TP2 → 0.7845
🧭 A break below 0.7930 would confirm bearish continuation within the channel.

XAU/USD Near Record Highs: Key Data AheadGold (XAU/USD) Technical Outlook – October 3, 2025
1. Macro & News Context
Gold is holding near record highs, heading for its seventh consecutive weekly gain, supported by expectations that the Federal Reserve will continue cutting rates and by concerns around the ongoing U.S. government shutdown. Spot prices have recently tested the $3,890–3,900 region and are now consolidating around $3,860.
Nonfarm Payrolls (NFP) – Typically scheduled for 08:30 ET / 12:30 UTC on the first Friday of the month, the September jobs report is likely to be delayed due to the U.S. government shutdown.
Key event to watch today:
ISM Services PMI (September) will be released at 10:00 ET / 14:00 UTC. Since ISM data is privately produced, it will be published regardless of the shutdown and may serve as the main volatility catalyst in today’s U.S. session. 【ISM】
Labor market signals: Challenger job cut data showed lower layoffs in September, but planned hiring at the lowest level since 2009, reinforcing a softer employment backdrop. Combined with the Fed’s recent 25 bps rate cut (to 4.00%–4.25%), this continues to support the bullish gold narrative.
USD trend: The dollar has weakened broadly this week, aligning with market bets on further monetary easing. This backdrop provides an additional tailwind for gold.
2. Technical Landscape (H1 Chart)
The attached chart highlights key technical zones and a completed Harmonic XABCD pattern on the 1H timeframe:
Support levels:
Near-term: $3,844–3,841
Deeper: $3,827 (intraday pivot), $3,792 (strong low)
Strategic: $3,764–3,770 (Bullish Order Block)
Resistance levels:
Immediate: $3,865
Strong supply: $3,880–3,890 (Bearish Order Block)
Extended target: $3,930–3,940 (Sell Scalping | Fibo zone)
Momentum: After bouncing from point D of the harmonic structure, gold has been forming higher lows (HL). Price currently sits above the longer-term moving average and is testing the shorter-term average, suggesting a constructive short-term bias as long as supports hold.
3. Trade Scenarios
Scenario 1 – Buy-the-dip (preferred bias)
Entry zone: $3,844–3,841
Stop loss: Below $3,827 (safer: below $3,792)
Targets:
$3,865 (first take-profit)
$3,880–3,890 (major supply)
Stretch: $3,930–3,940
Rationale: Higher low formation, bullish macro backdrop, aligned with strong weekly uptrend.
Scenario 2 – Countertrend short at resistance
Trigger zone: $3,880–3,890 (Bearish OB)
Confirmation: Rejection candles (H15–H1) such as wicks, engulfing, or failed breakout.
Stop loss: Above $3,895–3,900 (or above $3,945 if price spikes into the $3,930–3,940 fib zone).
Targets: $3,865 → $3,844 → $3,827
Rationale: Potential liquidity sweep ahead of ISM, with profit-taking likely near supply zones.
Scenario 3 – Breakdown through support
Trigger: 1H close below $3,841
Path: $3,827 → $3,792 (Strong Low) → $3,764–3,770 (Bullish OB)
Rationale: Loss of intraday structure would flip bias short until major demand zones.
4. How to Trade Around Today’s Data
If NFP is indeed delayed, the 08:30 ET / 12:30 UTC slot may bring limited volatility.
Focus instead on the ISM Services PMI at 10:00 ET / 14:00 UTC, which could trigger sharp swings in both USD and gold.
Adjust position sizing: Expect spread widening and slippage around the release. Reduce leverage or scale into positions.
5. Risk Management
Limit risk per trade to 0.5–1% of account equity.
Avoid chasing price once levels are tested; wait for H15–H1 candle closes for confirmation.
Monitor the U.S. Dollar Index (DXY) and Treasury yields – further dollar weakness would reinforce bullish gold setups.
🔑 Key Takeaway
Gold remains structurally bullish in the broader trend, with immediate support at $3,841–3,844 critical to maintain upside momentum. Watch for reactions around $3,880–3,890 and $3,930–3,940. With NFP possibly delayed, the ISM Services PMI at 10:00 ET / 14:00 UTC will be today’s most important catalyst for directional moves.

BTCUSD: Weekly reviewThis week, BITSTAMP:BTCUSD recorded a strong rally, moving from 109,900 → 120,800, equivalent to about +10,900 USD (+9.9%).
After last week’s sharp decline, the market clearly reversed into an uptrend as price broke out and held firmly above the EMA.
Today is Friday, and the market may experience strong volatility due to the Non-Farm Employment Change (NFP) report – an event that often has a major impact on price movement and trading strategies during the day.
Key Setups of the Week
1. BITSTAMP:BTCUSD Review – September 29
After a sharp drop, BTC rebounded, broke out of the range, and held above the EMA.
This was an early signal confirming a trend reversal from bearish to bullish.
2. BTC Review – September 30
After breaking out of the larger range and rallying strongly, the plan was to wait for a pullback toward the EMA.
Price formed a diagonal wave and gave confirmation signals through DD (Double Doji) / FB (First Breakout).
The entry was triggered, and the market rallied nicely, hitting the target as expected.
3. BTC Review – October 1
After the rally, BTC retraced and closed below the EMA.
At this point, the short-term trend was unclear → staying out and waiting for more market data to avoid unnecessary risk.
4. BTC Review – October 2
On the following day, price recovered and consolidated right at the upper boundary of the range.
EMA pressed tightly, creating a momentum compression zone and setting up for the next breakout.
The plan was to wait for RB/ARB confirmation, then Buy following the breakout.
This setup worked out successfully, BTC broke out strongly and continued to hit the target.
5. BTC Review – October 3
The main bullish trend continued, showing no signs of weakness.
The plan: wait for a pullback to the EMA, confirm a FB/SB (Second Breakout) signal, then Buy in line with the uptrend.
The scenario played out accurately, delivering another profitable setup.
Conclusion
Trend of the week: Clearly bullish.
Buy setups around EMA and breakout strategies performed effectively, resulting in a consistent winning streak.
Caution for today: With NFP on the schedule, unusual volatility may occur. Traders should manage risk carefully and patiently wait for clear confirmation signals before entering the market.
You can refer to my previous analysis here:
Please like and comment below to support our traders. Your reactions motivate us to do more analysis in the future 🙏✨
Daniel Miller @ ZuperView

Bitcoin Under Pressure, Correction or Breakout Ahead ?Regarding the overall trend, BTC is currently in a corrective phase after a strong rally from March to July, and is now facing a key resistance zone between 114,500 – 117,500 USDT.
🔸 The price failed to break the recent high at 117,500.
🔸 A clear supply order block is visible between 116,500 – 117,300 USDT, acting as strong selling pressure.
🔸 There’s also a partial Fair Value Gap (FVG) between 111,000 – 113,000 USDT, which may get retested.
📈 If BTC breaks above 117,500, the likely scenario is a rally toward the major resistance at 124,000 USDT, where a potential Double Top formation may occur with a possible failed second high.
📉 On the other hand, if support at 114,500 is broken, the price could head toward the strong support zone around 110,000 – 107,000 USDT.
💡 Trade Idea (Short-Term):
Entry: Sell from price ~117,500
🎯 TP1: 114,600 (Consider closing 50% here)
🎯 TP2: If 114,600 breaks, hold the remaining position for a move toward 110,000
SL: Daily close above 117,500 (If this happens, trend flips bullish and a long trade toward 124,000 can be considered).
Please note:
This is not financial advice – I’m only sharing my personal trades.
Always do your own research before taking action.
👍 Don’t forget to like if you found this useful, and feel free to follow me for more analysis of this kind.
Best of luck 🌹

Holding above 3,675 favors bullish continuation1. Key Levels
Resistance zone: 3,675 – 3,685 (blue box). Price is consolidating right around this area.
Support zone: 3,630 – 3,640 (red box below). This is the key downside level if the breakout fails.
2. Current Price Action
Price had a strong bullish impulse pushing above 3,675 but is now stalling and retesting this resistance zone.
The zig-zag lines you drew highlight two potential paths:
🔺 Red arrow (bullish): Break above 3,685 → continuation to 3,700 – 3,710.
🔻 Blue arrow (bearish): Rejection from this zone → drop back towards 3,640 support.
3. Trading Scenarios
Bullish Case
If gold holds above 3,675 and breaks 3,685 with momentum, buyers could target 3,700 – 3,710 first.
Above that, 3,720+ becomes the next resistance zone.
Bearish Case
If gold fails to stay above 3,675 and breaks back below → expect a deeper retracement towards 3,640.
If 3,640 fails, the next strong support is 3,620 – 3,630.
4. Summary
The market is at a decision point.
Holding above 3,675 favors bullish continuation, while losing this level favors a pullback correction.
Traders should watch for a clean breakout or rejection at this zone before entering.

RKT Rocket Companies Options Ahead of EarningsIf you haven`t bought RKT before the previous earnings:
Now analyzing the options chain and the chart patterns of RKT Rocket Companies prior to the earnings report this week,
I would consider purchasing the 13usd strike price Calls with
an expiration date of 2026-1-16,
for a premium of approximately $1.37.
If these options prove to be profitable prior to the earnings release, I would sell at least half of them.

Why BABA Alibaba Could Rebound Strongly by Year-End 2025If you haven`t bought BABA before the recent rally:
What you need to know:
BABA’s fundamentals, fueled by e-commerce, cloud, and AI, support its technical bullishness:
E-commerce and Cloud Rebound:
Q1 2025 revenue grew 7% year-over-year, with Taobao/Tmall rebounding and cloud revenue surging due to AI demand.
Alibaba’s cloud division, China’s largest, benefits from hyperscaler AI workloads, with 15% profit margin projections by 2029.
AI Leadership:
BABA’s AI assistant and generative AI tools drove a 70% stock surge in early 2025, positioning it as a leader in China’s AI race.
At 12x forward P/E with 8% revenue CAGR, BABA is undervalued (fair value ~$162).
Share Buybacks:
Aggressive share repurchasing (6% annual reduction) boosts EPS, with $1 trillion GMV reinforcing e-commerce dominance.
Macro Tailwinds:
Easing CCP regulations and China’s stimulus measures (e.g., rate cuts) support BABA’s rally.
Minimal U.S. exposure insulates BABA from trade war risks.
Conclusion: BABA’s Path to $168
BABA’s technicals, with a bullish breaker and wedge, signal a breakout above $125–$130, targeting $150–$168 by year-end 2025. Fundamentally, its e-commerce dominance, cloud/AI growth, and undervaluation make it a standout. Traders should buy dips near $110–$115 or await a $130 breakout. With stimulus and buybacks as catalysts, BABA is set to soar.
Disclosure: I am part of Trade Nation's Influencer program and receive a monthly fee for using their TradingView charts in my analysis.

SE Sea Limited Options Ahead of EarningsIf you haven`t bought SE before the rally:
Now analyzing the options chain and the chart patterns of SE Sea Limited prior to the earnings report this week,
I would consider purchasing the 150usd strike price at the money Calls with
an expiration date of 2025-9-12,
for a premium of approximately $9.00.
If these options prove to be profitable prior to the earnings release, I would sell at least half of them.

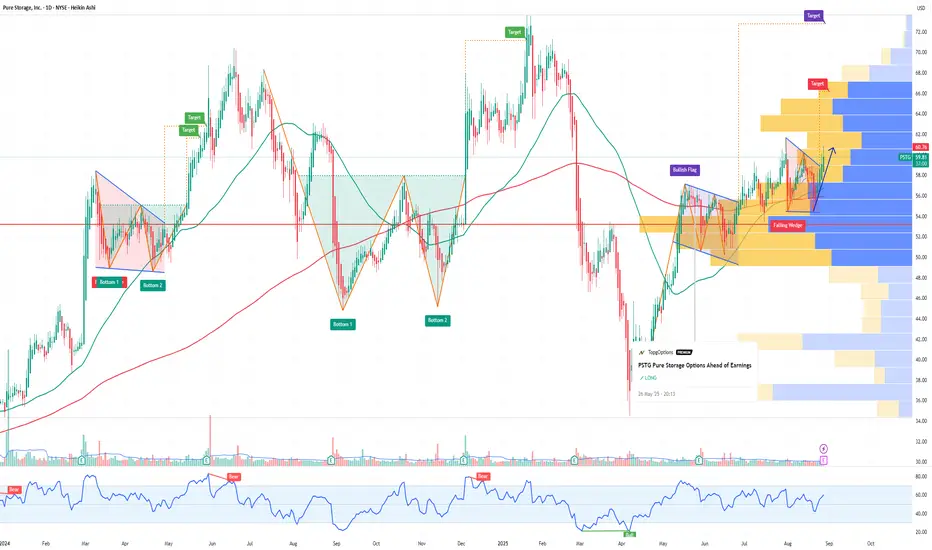
PSTG Pure Storage Options Ahead of EarningsIf you haven`t bought PSTG before the previous earnings:
Now analyzing the options chain and the chart patterns of PSTG Pure Storage prior to the earnings report this week,
I would consider purchasing the 60usd strike price Calls with
an expiration date of 2025-11-21,
for a premium of approximately $6.25.
If these options prove to be profitable prior to the earnings release, I would sell at least half of them.
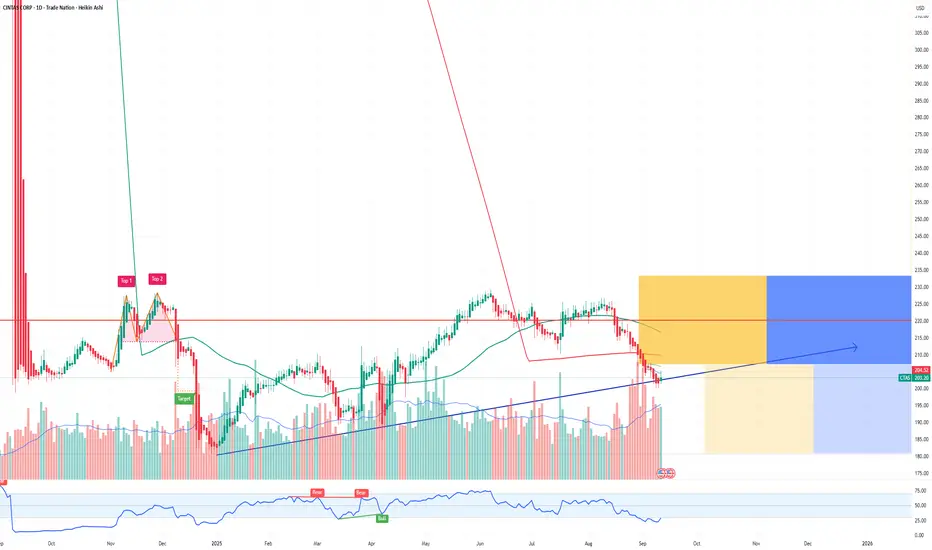
CTAS Cintas Corporation Options Ahead of EarningsAnalyzing the options chain and the chart patterns of CTAS Cintas Corporation prior to the earnings report next week,
I would consider purchasing the 210usd strike price Calls with
an expiration date of 2026-1-16,
for a premium of approximately $9.95.
If these options prove to be profitable prior to the earnings release, I would sell at least half of them.
Bitcoin Do not buy today there is a massive sell-off.Be careful today and avoid buying Bitcoin.
A whale just sold 1,000 BTC at $113,000, causing a sudden drop in price, as shown on the chart.
Remember that the market is always driven by supply and demand, and by the large-scale buying and selling operations of whales.
⚠️ Do not buy Bitcoin currently unless new buy orders from market makers appear and there is significant buying entry from whales.
👉 Follow me to know the entry and exit points of market makers and whales.
I specialize in analyzing and tracking the orders of market makers.
Best regards to all 🌹
please note :
this is not financial advice — it reflects only my personal opinion.
PLEASE always do your own research before trading .. Good luck with your trades.
If this type of analysis interests you, feel free to follow my work. I specialize in tracking and analyzing the orders of market makers and whales. Of course, always do your own research before trading
Thank you 🌹
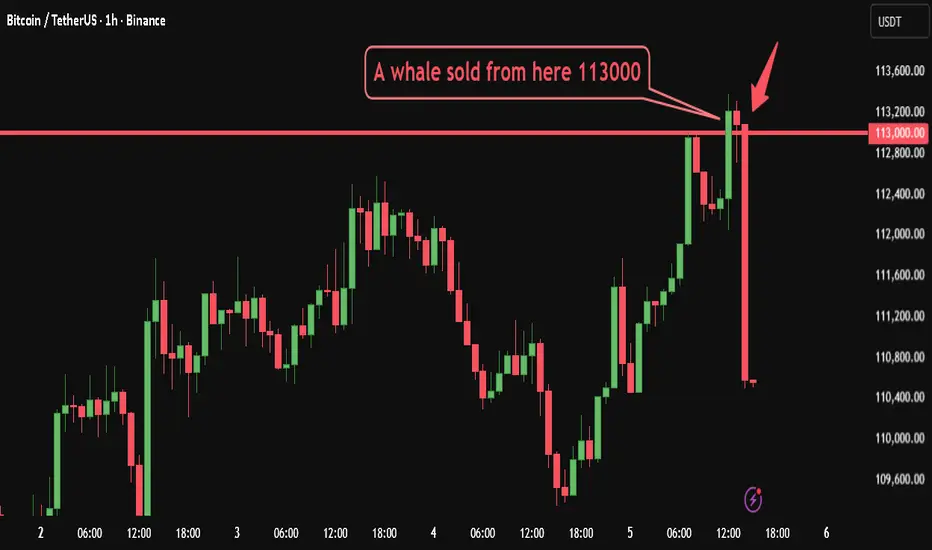
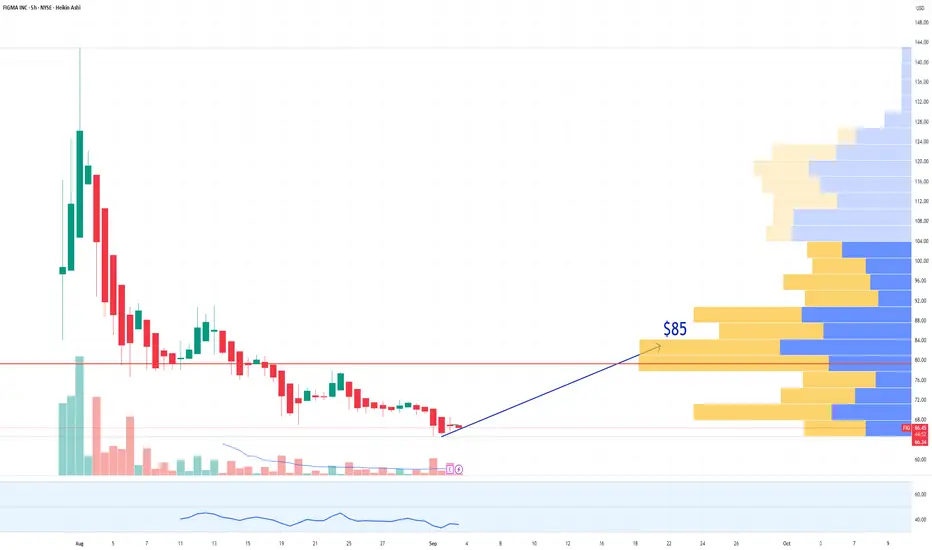
FIG Figma Options Ahead of EarningsAnalyzing the options chain and the chart patterns of FIG Figma prior to the earnings report this week,
I would consider purchasing the 85usd strike price Calls with
an expiration date of 2025-10-17,
for a premium of approximately $2.67.
If these options prove to be profitable prior to the earnings release, I would sell at least half of them.
LI Auto Options Ahead of EarningsIf you haven`t sold the very top on LI:
Now analyzing the options chain and the chart patterns of LI Auto prior to the earnings report this week,
I would consider purchasing the 23usd strike price in the money Calls with
an expiration date of 2025-10-17,
for a premium of approximately $1.66.
If these options prove to be profitable prior to the earnings release, I would sell at least half of them.

VKTX: Unusual Options Flow & a Breakthrough Weight-Loss DrugIf you haven`t bought CKTX before the recent rally:
Now you need to know that Viking Therapeutics (VKTX) is a speculative biotech stock in the GLP-1/GIP agonist space, aiming to challenge market leaders like Eli Lilly and Novo Nordisk. Recently, I noticed unusual options flow — specifically, Jan 16, 2026 $60 strike calls
Key Bullish Points
1) Riding the Obesity Drug Boom
VK2735 is Viking’s dual agonist candidate showing promising early weight-loss efficacy, with potential overlap benefits in NASH (liver disease). The obesity treatment space is expected to exceed $100B by 2030—huge upside if their trials continue positively.
2) Options Flow Tells a Story
Those Jan 2026 $60 calls caught my attention precisely because the stock currently trades in the mid-$60s. These aren’t cheap lottery plays—they’re strategically timed wrt trial readouts, partnerships, or acquisition interest. Essentially, someone anticipates meaningful upside in the near future.
3) Descending Wedge — Chart Looks Bullish
VKTX peaked near $100, then pulled back into a well-defined descending wedge. If it breaks out above $70–$72 with volume, that could kick off a classic reversal trade.
Smart Money Options Flow — Near-Term Bet:
Recently, I spotted unusual open interest in $60 strike calls expiring Jan 16, 2026 — that’s only about 7 months away.
This means someone is positioning for a big upside move relatively soon, likely betting on positive Phase 2b/3 data, a partnership deal, or even buyout chatter within the next few quarters.
Short-dated, out-of-the-money call flow like this often hints at near-term news — not just a long-dated hedge.

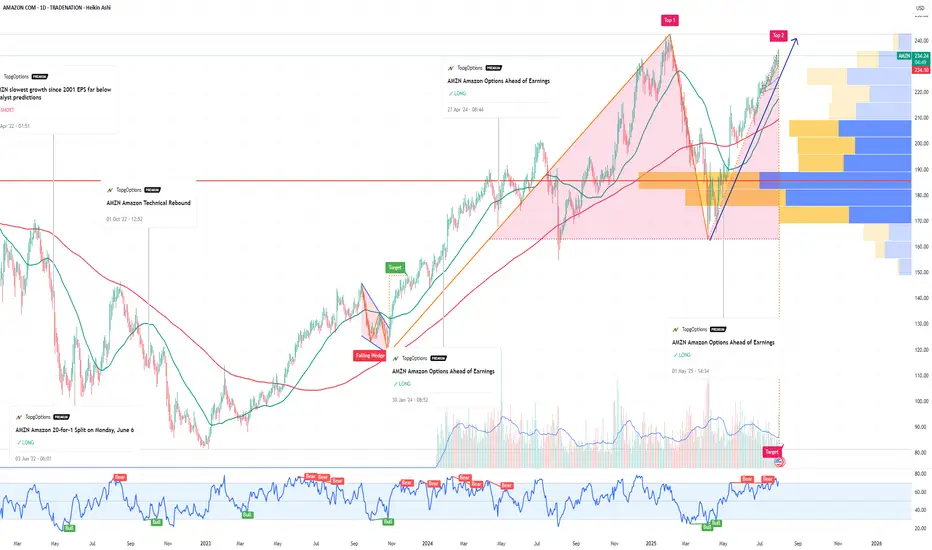
AMZN Amazon Options Ahead of EarningsIf you ahven`t bought the recent dip on AMZN:
Now analyzing the options chain and the chart patterns of AMZN Amazon prior to the earnings report this week,
I would consider purchasing the 245usd strike price Calls with
an expiration date of 2025-9-19,
for a premium of approximately $7.02.
If these options prove to be profitable prior to the earnings release, I would sell at least half of them.
Disclosure: I am part of Trade Nation's Influencer program and receive a monthly fee for using their TradingView charts in my analysis.
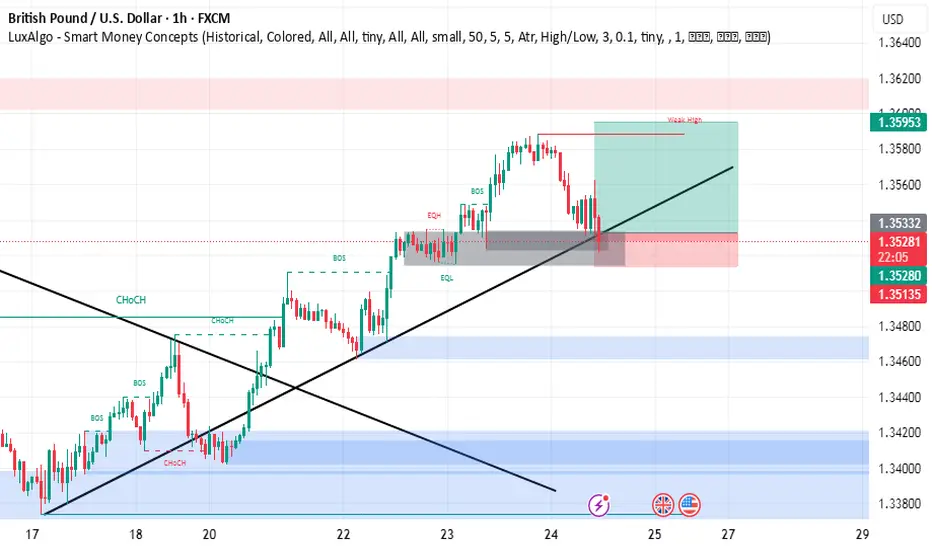
GBPUSD buy setupsimply
this is 6 deals after 5 CONSECUTIVE WINNING traders
we have demand
uptrend
the price can't make lower low
and make more candle in the area with more rejection
so the price will go up
be careful on your risk money management
BEST WISHES
LVS Las Vegas Sands Options Ahead of EarningsIf you haven`t bought LVS before the rally:
Now analyzing the options chain and the chart patterns of LVS Las Vegas Sands prior to the earnings report this week,
I would consider purchasing the 48.5usd strike price Puts with
an expiration date of 2025-7-25,
for a premium of approximately $1.22.
If these options prove to be profitable prior to the earnings release, I would sell at least half of them.
Disclosure: I am part of Trade Nation's Influencer program and receive a monthly fee for using their TradingView charts in my analysis.

SCHW The Charles Schwab Corporation Options Ahead of EarningsIf you haven`t sold SCHW before the sell-off:
Now analyzing the options chain and the chart patterns of SCHW The Charles Schwab Corporation prior to the earnings report this week,
I would consider purchasing the 92.5usd strike price Calls with
an expiration date of 2026-1-16,
for a premium of approximately $7.15.
If these options prove to be profitable prior to the earnings release, I would sell at least half of them.
Disclosure: I am part of Trade Nation's Influencer program and receive a monthly fee for using their TradingView charts in my analysis.
