AMZN Amazon Options Ahead of EarningsIf you haven`t bought AMZN before the rally:
Now analyzing the options chain and the chart patterns of AMZN Amazon prior to the earnings report this week,
I would consider purchasing the 260usd strike price Calls with
an expiration date of 2026-8-21,
for a premium of approximately $20.65.
If these options prove to be profitable prior to the earnings release, I would sell at least half of them.
Signalvip

META Platforms Options Ahead of EarningsIf you missed buying META before the rally:
Now analyzing the options chain and the chart patterns of META Platforms prior to the earnings report this week,
I would consider purchasing the 670usd strike price Calls with
an expiration date of 2028-1-21,
for a premium of approximately $167.80.
If these options prove to be profitable prior to the earnings release, I would sell at least half of them.

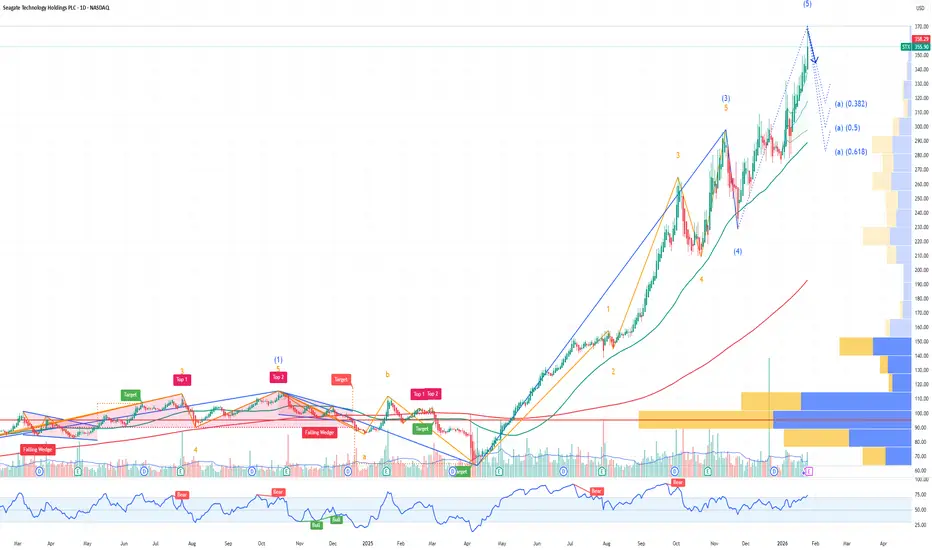
STX Seagate Technology Holdings Options Ahead of EarningsAnalyzing the options chain and the chart patterns of STX Seagate Technology Holdings prior to the earnings report this week,
I would consider purchasing the 357.50usd strike price Puts with
an expiration date of 2026-1-30,
for a premium of approximately $17.90.
If these options prove to be profitable prior to the earnings release, I would sell at least half of them.
MU Micron Technology Options Ahead of EarningsIf you haven`t bought MU before the rally:
Now analyzing the options chain and the chart patterns of MU Micron Technology prior to the earnings report next week,
I would consider purchasing the 247.5usd strike price Calls with
an expiration date of 2025-12-19,
for a premium of approximately $8.10.
If these options prove to be profitable prior to the earnings release, I would sell at least half of them.

SNAP: 2026 Bull Case Driven by AI and AR InnovationIf you haven`t sold the double top on SNAP:
nor bought the dip afterwards:
As we enter 2026, Snap Inc. (SNAP) presents a compelling bullish case for investors willing to bet on a social media turnaround story.
Trading around $7.53 with a market cap of approximately $13 billion, the stock is down 91% from its 2021 all-time high, yet it boasts a rock-bottom valuation—price-to-sales near 2.2x, one of its cheapest since the 2017 IPO.
With monthly active users (MAUs) approaching 1 billion and daily active users (DAUs) at 477 million (up 8% YoY in Q3 2025), SNAP’s scale is undervalued compared to peers like Meta or Pinterest, setting the stage for a potential rebound if execution aligns.
Key tailwinds include SNAP’s aggressive push into AI and AR technologies.
Recent partnerships, such as the $400 million deal with Perplexity AI for enhanced search features in Snapchat, signal innovation that could boost user engagement and ad revenue.
The upcoming 2026 launch of lightweight AR Specs glasses aims to capitalize on augmented reality commerce, while Snapchat+ subscriptions are already generating ~$700 million in annual recurring revenue.
Q3 2025 results showed 10% revenue growth to $1.507 billion and positive free cash flow of $93 million, hinting at improving margins amid cost-cutting efforts. Analysts’ consensus 12-month target sits at $9.86, implying ~30% upside, with some optimistic calls reaching $13–16.
On X (formerly Twitter), sentiment leans bullish for 2026: many traders call it a “buy & forget” stock at current levels, with several predicting targets of $17+ in the coming months and $40+ by year-end.
Others highlight parallels to Spotify’s (SPOT) 10x run post-profit inflection, noting SNAP’s forward P/E compression to 17x. Reddit discussions emphasize non-U.S. user growth and emerging revenue streams (AI features, AR commerce, subscriptions) as key catalysts for a potential 2–3x winner.
Of course, risks persist: Regulatory pressures (e.g., age restrictions in the UK and Australia) and competition from TikTok could cap growth, while recent insider sales add caution.
Still, with Q4 2025 earnings on February 3 potentially serving as a catalyst, SNAP’s asymmetric upside makes it a speculative buy for those eyeing tech recovery plays in 2026.
If AI/AR bets pay off, this stock could snap back strongly.

TheGrove | EURAUD BUY | Idea Trading AnalysisEURAUD remains overall bullish, trading within a well-defined ascending structure.
Price is now approaching a high-confluence area, where the demand zone aligns perfectly with the lower red trendline. This intersection is critical, as it represents a classic trend-following buy zone within a healthy uptrend.
As long as this zone holds, we will be looking for bullish reactions and continuation setups, aiming for a move back toward the upper side of the channel and the previous highs.
Hello Traders, here is the full analysis.
I think we can soon see more fall from this range! GOOD LUCK! Great BUY opportunity EURUAD
I still did my best and this is the most likely count for me at the moment.
-------------------
Traders, if you liked this idea or if you have your own opinion about it, write in the comments. I will be glad 🤝

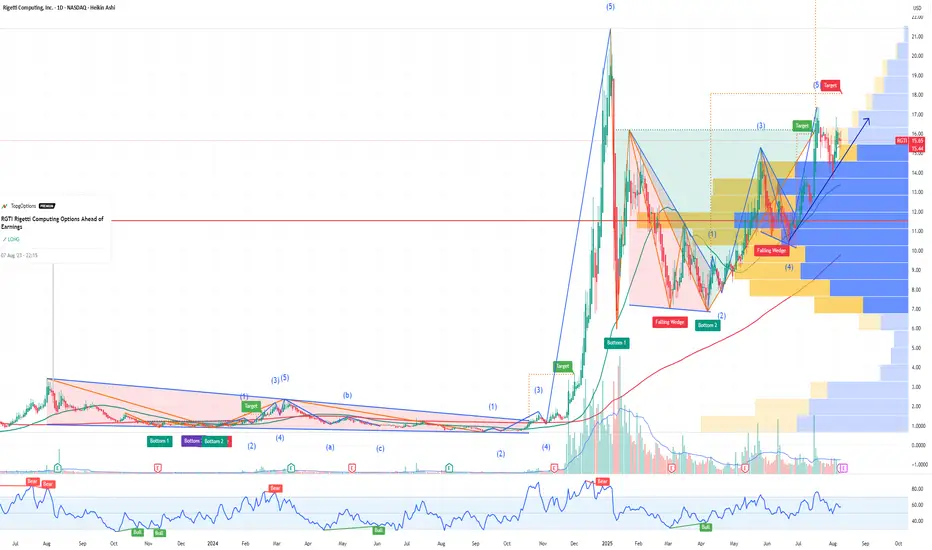
RGTI Rigetti Computing Options Ahead of EarningsIf you haven`t bought RGTI before the rally:
Now analyzing the options chain and the chart patterns of RGTI Rigetti Computing prior to the earnings report this week,
I would consider purchasing the 15usd strike price Calls with
an expiration date of 2027-1-15,
for a premium of approximately $6.20.
If these options prove to be profitable prior to the earnings release, I would sell at least half of them.
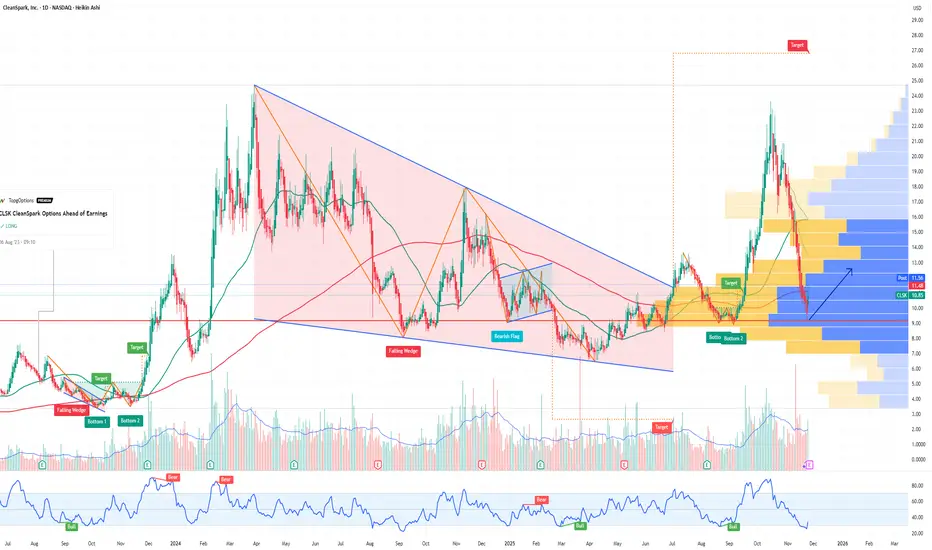
CLSK CleanSpark Options Ahead of EarningsAnalyzing the options chain and the chart patterns of CLSK CleanSpark prior to the earnings report this week,
I would consider purchasing the 12.5usd strike price Calls with
an expiration date of 2026-1-16,
for a premium of approximately $1.42.
If these options prove to be profitable prior to the earnings release, I would sell at least half of them.
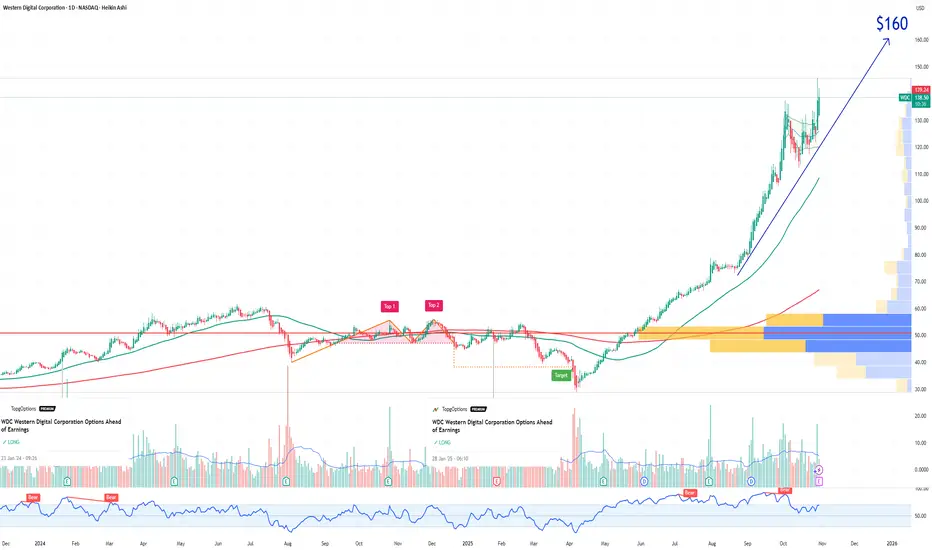
WDC Western Digital Corporation Options Ahead of EarningsIf you haven`t bought WDC before the rally:
Now analyzing the options chain and the chart patterns of WDC Western Digital Corporation prior to the earnings report this week,
I would consider purchasing the 160usd strike price Calls with
an expiration date of 2025-11-21,
for a premium of approximately $4.35.
If these options prove to be profitable prior to the earnings release, I would sell at least half of them.
PG The Procter & Gamble Company Options Ahead of EarningsIf you haven`t bought the dip on PG:
Now analyzing the options chain and the chart patterns of PG The Procter & Gamble Company prior to the earnings report this week,
I would consider purchasing the 152.50usd strike price Calls with
an expiration date of 2025-11-21,
for a premium of approximately $3.55.
If these options prove to be profitable prior to the earnings release, I would sell at least half of them.

Gold tests below $4,300 amid strengthening USD October 21Joint statement Ukraine – EU – Trump – Europe:
=> Call for an immediate ceasefire and start peace negotiations.
=> The market reacts risk-on, money flows out of gold => gold drops sharply.
echnical analysis: H1 is in the process of correction after continuously setting the ATH peak, gradually forming a head and shoulders pattern, buyers right at the 4178-4180 area are quite clear.
BUY GOLD : 4180 - 4178
SL: 4172
TP: 50 - 200 - 400PIPS
SELL GOLD : 4320 - 4322
SL: 4330
TP: 50 - 200 - 400PIPS
Trade according to price trends, do not trade predictions, manage and be responsible for your account !

EUR/USD: Bulls Preparing for a Comeback?The pair is hovering just above the 1.1650 support zone, which has acted as a strong demand area multiple times since late June. Price is currently testing this level again, while both moving averages ( 50 & 100 MA ) are slightly above — signaling a potential oversold condition if we see rejection here.
Technical Outlook
Support: 1.1650 (key short-term level).
Resistance: 1.1720 → 1.1800 (MA cluster + previous lower highs).
Bias: Short-term bullish if 1.1650 holds.
Setup: A bullish reaction at this zone could trigger a rebound toward the 1.1750–1.1800 range.
Invalidation: A clean 4H close below 1.1640 would flip bias to bearish continuation.
Fundamental View
Recent U.S. data has shown signs of slowing inflation and consumer activity, which might reduce pressure on the Fed to maintain a hawkish stance. Meanwhile, the ECB’s neutral tone suggests less divergence between the two central banks — a short-term positive for the euro.
If the next U.S. CPI release comes in softer than expected, EUR/USD could easily rally back toward 1.18+.
💡 Trade Idea (Not Financial Advice):
Watch for bullish confirmation near 1.1650–1.1660 with a tight stop below 1.1610.
First target: 1.1750,
Second target: 1.1820.

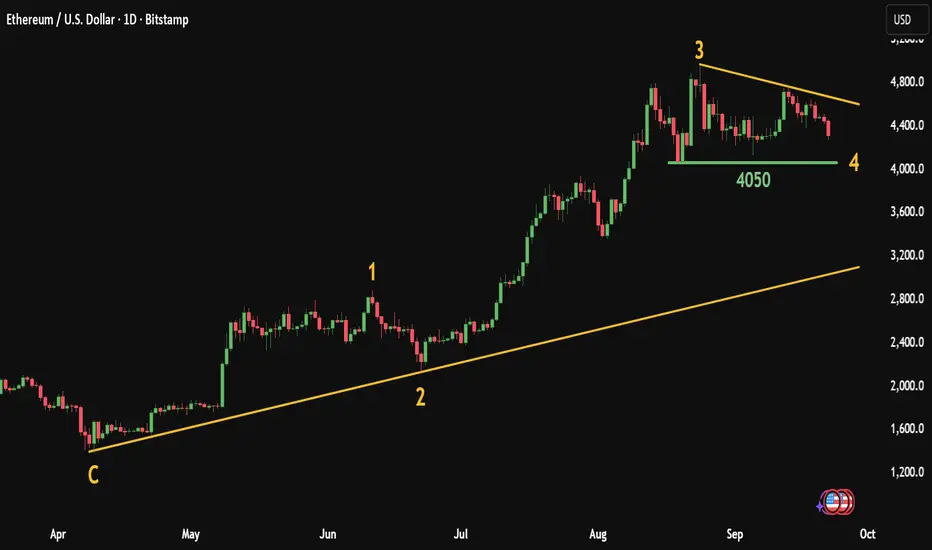
ETH Elliott Wave Analysis: Key Support at $4,050, Targets $5,200The attached chart clearly illustrates that Ethereum’s current price action is following a classic Elliott Wave structure, with three major impulsive waves completed and the market currently consolidating within the fourth corrective wave.
Ⅰ. Completed Waves
Wave C (the bottom): Marked the starting point of the new bullish cycle, around the $1,700 – $1,800 levels.
Wave 1: The initial impulsive rally, reaching $2,900 – $3,000.
Wave 2: A sideways/ corrective decline, which respected the previous bottom and maintained the overall bullish structure.
Wave 3: The strongest and most extended impulsive wave, pushing price aggressively to $4,800 – $4,900, showing the typical momentum associated with third waves.
Ⅱ. Current Phase – Wave 4
Price is consolidating within a descending contracting triangle, which is typical of a fourth-wave correction.
The key support lies at $4,050, acting as the main level to preserve the bullish Elliott structure.
Wave 4 is usually more complex and sideways than Wave 2, which fits well with the current market behavior.
Ⅲ. Outlook – Wave 5
As long as $4,050 holds without a daily close below it, the most likely scenario is the start of the fifth impulsive wave upward.
This wave is expected to break above the Wave 3 peak at $4,800 and extend into new highs.
Potential upside targets: $5,200 – $5,500, with room for higher levels if institutional momentum drives further expansion.
Conclusion:
Ethereum is unfolding within a clear Elliott Wave bullish cycle. The ongoing Wave 4 correction is consolidating around the $4,050 support level, which is the key pivot to watch. Holding this zone increases the probability of a Wave 5 rally, potentially driving ETH to fresh all-time highs in the coming weeks.
Ethereum Elliott Wave Buy Setup: Targets 4550 and 4600Ethereum Daily Update (Elliott Wave Setup)
Based on my daily monitoring of Ethereum and according to the Elliott Wave count (which I’ll share shortly with the full analysis), I see a long opportunity forming.
Here’s my personal trade plan:
✅ Entry 1: Buy from current price 4450 / 4445
✅ Entry 2: If price dips, add another buy at 4400
🎯 Target 1: 4550
🎯 Target 2: 4600
Stop-loss: For both entries, a daily close below 4350
Please note:
This is not financial advice – I’m only sharing my personal trades.
Always do your own research before taking action.
👍 Don’t forget to like if you found this useful, and feel free to follow me for more analysis of this kind.
Best of luck 🌹

BTC Trade Idea: Short from 117,850 at previous resistance level
Bitcoin is currently at a previous resistance level 117,500 where the price has bounced down before.
Personally, I will enter a short trade from the current price with a tight stop-loss.
✅ My Personal Strategy:
Entry: Sell from current price 117,850
🎯 Target 1: 116,000
🎯 Target 2: 115,500
Stop Lose : Daily close above the resistance level 117,500
Please note:
This is not financial advice – I’m only sharing my personal trades.
Always do your own research before taking action.
👍 Don’t forget to like if you found this useful, and feel free to follow me for more analysis of this kind.
Best of luck 🌹

SOL The Whales are Selling at This Strong Resistance Level 230$SOL Current Market Update
The coin is now facing a very strong resistance around $230 .
This presents a great short opportunity .
After carefully monitoring buy and sell orders on-chain, I noticed a strong confirmation for the short setup:
Whales and Market Makers sell orders are clustered heavily around the $228 – $230 resistance zone.
✅ My Personal Strategy:
Short Entry: Resistance zone between $228 – $230
🎯 Target 1: $220
🎯 Target 2: $216
Please note:
This is not financial advice – I’m only sharing my personal trades.
Always do your own research before taking action.
👍 Don’t forget to like if you found this useful, and feel free to follow me for more analysis of this kind.
Best of luck 🌹

RKT Rocket Companies Options Ahead of EarningsIf you haven`t bought RKT before the previous earnings:
Now analyzing the options chain and the chart patterns of RKT Rocket Companies prior to the earnings report this week,
I would consider purchasing the 13usd strike price Calls with
an expiration date of 2026-1-16,
for a premium of approximately $1.37.
If these options prove to be profitable prior to the earnings release, I would sell at least half of them.

Bitcoin Short Opportunity Before the Next Leg UpBitcoin is currently showing noticeable weakness in buying momentum.
Most likely, it will drop to the 113K–112K area to retest before moving higher again.
✅ My Personal Strategy:
Entry (Sell): 115,600
🎯 Target 1: 114,000
🎯Target 2: 113,600
Stop-Loss: Daily close above 117,400
Please note:
This is not financial advice – I’m only sharing my personal trades.
Always do your own research before taking action.
👍 Don’t forget to like if you found this useful, and feel free to follow me for more analysis of this kind.
Best of luck 🌹

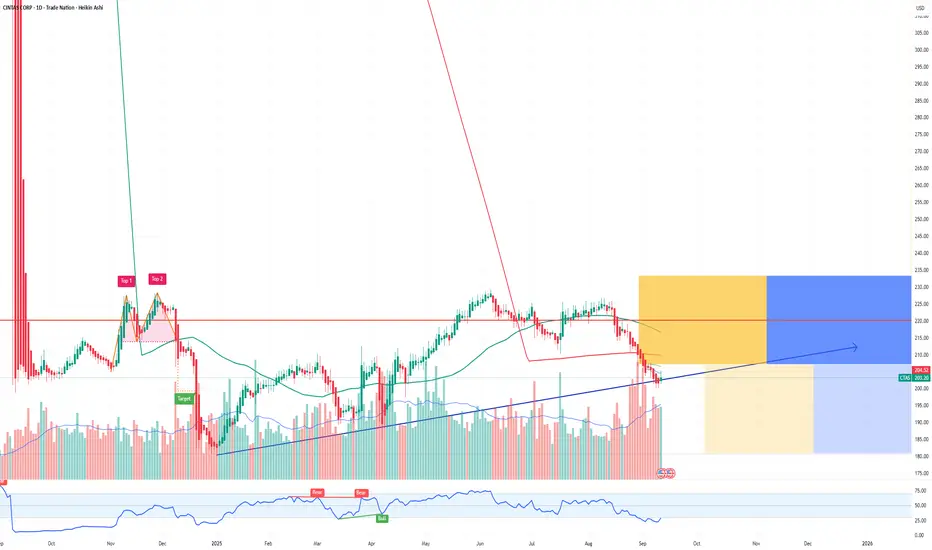
CTAS Cintas Corporation Options Ahead of EarningsAnalyzing the options chain and the chart patterns of CTAS Cintas Corporation prior to the earnings report next week,
I would consider purchasing the 210usd strike price Calls with
an expiration date of 2026-1-16,
for a premium of approximately $9.95.
If these options prove to be profitable prior to the earnings release, I would sell at least half of them.
Bitcoin - The Whales are Selling at This Strong Resistance 115K$BTC Current Market Update
The coin is now facing a very strong resistance around $115K .
This presents a great short opportunity .
After carefully monitoring buy and sell orders on-chain, I noticed a strong confirmation for the short setup:
Whales and Market Makers sell orders are clustered heavily around the 115,000 resistance zone.
✅ My Personal Strategy:
Short Entry: 115,000
🎯 Target 1: 114,000
🎯 Target 2: 113,600
Please note:
This is not financial advice – I’m only sharing my personal trades.
Always do your own research before taking action.
👍 Don’t forget to like if you found this useful, and feel free to follow me for more analysis of this kind.
Best of luck 🌹

BITCOIN Quick Buy Trade with the whalesBased on my analysis of on-chain data and liquidity flow, here is what I am seeing:
I've noticed a large buy order in the green zone between 110,600 and 110,500, which may push the price higher.
Additionally, there are large whale buy orders at the strong support of 110,000, with options contracts clustered there.
This will also contribute significantly to pushing the price up.
My Strategy:
✅ I will be taking a buy position if the price drops to the green zone between 110,600 and 110,500.
I will also take another buy position if the price drops to 110,000.
Targets
🎯 TP1: 112,600
🎯 TP2: 113,400
Disclaimer
This is not investment advice. I am only sharing my personal trade setups. Please always do your own research before trading.
Regards 🌹

Bitcoin’s Triple Test: 110K Options Wall, 105K Liquidity Barrier
Bitcoin is currently navigating through a volatile zone crowded with critical levels. Here’s what I’m tracking closely:
Key Levels to Watch
$110K Options Wall
A dense cluster of open options layers at this zone, signaling potential sell pressure from smart money if breached.
$105K On-Chain Liquidity Barrier
Heavy order flow and visible support orders are stacked here — failure to defend this zone may trigger a breakdown.
$95K Lifeline Support
A psychological base zone with historical significance that could act as the last line of defense for bulls.
What These Signals Mean
A firm hold above $110K could propel BTC into a new breakout phase — possibly toward $118K+.
A dip below $105K might trigger a swift pullback as liquidity dries up.
Breach under $95K could indicate a deeper correction zone, realigning market sentiment.
My View
I track liquidity dynamics and order flow activity, not just charts — these levels are where real capital meets psychology.
The question:
Are bulls strong enough to defend $110K, or are we gearing for a liquidation cascade toward $105K or lower?
✅ Write a comment with your favorite altcoin hit the like button, and I'll provide my analysis in the reply
My analyses are personal opinions, not trade setups.
Thank you for your support, and I wish you successful trades 🌹

Bitcoin Quick Buy Opportunity for Quick TradersBTC,
Currently, Bitcoin is trading within a tight consolidation range, caught between a descending trendline and an ascending trendline on the 1-hour chart.
The price is forming a potential compression pattern, which often precedes a breakout.
while volume spikes indicate active demand around the green zone.
Additionally, there are visible whale buy orders and volume confirmation near the ascending trendline shown in the chart, strong enough to potentially push the price higher.
These orders are clustered around 110,650.
I will follow a strategy and enter from the same level.
My plan is as follows:
✅ Entry: Buy if price retraces to green line 110,650
🎯 Target 1: 111,250
🎯 Target 2: 111,600
Please keep monitoring this setup, as I use strategies based on observing supply and demand flows.
I will update you with any changes in entry points, targets, or shifts in order book dynamics.
Important Note:
This is not financial advice.
I am only sharing my own trades and personal analysis, which reflect my individual perspective.
Please always do your own research.
Good luck in your trades.
Best Regards 🌹
