#XAGUSD SILVER - Wait For A Dip Toward The TrendlineThe chart shows a strong uptrend in XAGUSD with higher highs and higher lows, supported by two rising trendlines and prior resistance turned support near 100.
Price is currently pulling back from recent highs around 117–120, and the plan on the chart is to wait for a dip toward the trendline/100 zone and then look for long (buy) setups in line with the bullish trend.
Silvercharts

Silver... what on earth is going on?The data from the January 20 and January 27 reports reveals a classic "institutional distribution" phase, where the "smart money" was quietly exiting while retail traders were still buying the peak.
1. Managed Money: The "Reluctant" Longs
Institutional speculators (Hedge Funds and CTAs) were the primary drivers of the run-up to $120, but the COT data shows they were losing conviction long before the crash.
Trimming Longs: In the week ending January 27, Managed Money reduced net-long exposure to its lowest level since early 2024. They weren't just "selling"; they were aggressively taking profits into the parabolic move.
Rising Gross Shorts: For the first time in nearly two years, institutions began adding gross short positions (up ~18% in mid-January). This suggests they were actively betting on a "mean reversion" back toward the 50-day moving average.
2. Commercials: The "Massive Short"
The "Commercials" (Bullion banks and producers) held a massive net-short position as silver crossed $100.
The Hedge: Commercials typically short silver to hedge their physical inventory. However, at $120/oz, their paper losses became so extreme that they were essentially "trapped."
The "Kill Switch": When the CME hiked margins by 47% to $32,500 per contract this week, it forced a "deleveraging." Many smaller institutional players who couldn't meet the new margin requirements were forced to liquidate their long positions instantly, adding fuel to the fire.
3. The Retail Trap (Non-Reportables)
The most telling part of the COT report was the "Small Speculators" (retail).
While institutions were selling, small traders were record-long.
Retail sentiment was in the "extreme euphoria" zone. Historically, when the gap between "Institutional Net-Longs" (falling) and "Retail Net-Longs" (rising) reaches a certain width, a violent correction follows.
The "Warsh" Catalyst
The heavy institutional selling on Friday was accelerated by the Kevin Warsh Fed nomination. Because institutions use algorithms tied to "real yields" and the "US Dollar Index," the moment the dollar surged on the news, institutional sell-stops were triggered simultaneously. This turned a "correction" into a 31% liquidation event.
What's next?
Retracement to trendline and POC HVN of current volume profile at 90usd. At this point decision time, price may bounce going bearish or continue bullish to around next point of approximately 100usd.

Bearish Divergence on shorter time is playing well.SILVER Analysis
CMP 90.118 (18-01-2026)
Bearish Divergence on shorter time is playing well.
81 - 86 is an Important Supprot Zone that can be tested.
However, if 93 - 94 is crossed & Sustained, we may witness New Highs again.
100 - 105 can be an easy target initially.
Now it should not break Point C (around 69 - 70).

SILVER(XAGUSD): Price Heading Towards $109! Dear Traders,
Silver has made a slight correction and then reversed nicely. Now we’re seeing a significant surge in market volume. There’s only one take-profit and entry point. The stop-loss can be placed below our blue-marked entry box. This move could be substantial if it goes our way.
This trade could be completed within this week or next, assuming the volume remains constant.
Team Setupsfx_

Silver - Here comes the bullrun top!☠️Silver ( OANDA:XAGUSD ) creates its final top now:
🔎Analysis summary:
Silver still remains totally bullish. But Silver also remains totally overextended and the metal is also approaching the final resistance trendline. With all of this short term weakness, this might be the final top on Silver. Just please wait for bearish confirmation.
📝Levels to watch:
$100
SwingTraderPhil
SwingTrading.Simplified. | Investing.Simplified. | #LONGTERMVISION

SilverOver the last 10 trading days, silver futures have exhibited a strong bullish trend, extending a powerful rally that began in late 2025. The price has advanced from roughly $88–90/oz to above $105/oz, with successive higher highs and higher lows
Surpassed ~$100/oz decisively and sustained above this psychological threshold toward recent highs near ~$110/oz
The rally has been supported by risk-on flows as the US dollar softened and safe-haven and industrial demand factors strengthened. Speculative positioning and ETF inflows have underpinned upside interest, though sentiment signals indicate extended bullishness and potential for corrections..
Like and Share

Silver vs. U.S. Dollar: Comprehensive Bullish Retest Evaluation🔥 XAG/USD (Silver vs U.S. Dollar)
⚡ Metals Market Opportunity Blueprint | Day & Swing Trade
📌 Asset Overview
Instrument: XAG/USD — Silver vs U.S. Dollar
Market: Precious Metals
Trading Style: Day Trade / Swing Trade
Bias: Bullish Continuation 🟢
🧭 Trade Plan – Bullish Framework
✔ Multiple pullback retests = acceptance
✔ No aggressive breakout chasing — patience wins
Confirmation Logic:
Shallow pullbacks + higher lows
Momentum cooling without breakdown = continuation setup
🎯 Entry Strategy – Thief Layer Method 🧠
Execution Style: Any Price Entry via Layered Limits
This setup uses a Thief Layering Strategy — deploying multiple buy-limit orders instead of a single entry to manage volatility and reduce emotional execution.
Buy Limit Layers (Example):
90.000
92.000
94.000
👉 You may expand or compress layers based on your own risk profile and execution style.
🚨 Target Zone – High Voltage Area ⚠️
Target: 101.000
This zone acts like a High-Voltage Shock Fence Gate
✔ Historical selling pressure
✔ Overbought risk zone
✔ Liquidity trap potential
💡 Escape with profits before greed kicks in.
🛑 Stop Loss – Thief Risk Control
Protective SL: 89.000
⚠️ Capital protection always comes before profit hunting.
⚖️ Risk Disclaimer (OG Rule)
Dear Ladies & Gentlemen (Thief OGs),
This plan does not force you to use only my TP or SL.
Trade management is your responsibility — secure profits when the market pays you.
🌍 Live Fundamental & Economic Drivers (Monitor Actively)
Silver is highly sensitive to macro-economic shifts, especially USD-driven flows and global risk sentiment:
🔹 U.S. Dollar Strength / Weakness
Softer USD → Silver gains tailwind
Strong USD → Short-term pullbacks, not trend reversal
🔹 U.S. Interest Rate Expectations
Falling or stable rate outlook supports non-yielding assets like Silver
Hawkish tone increases volatility, not immediate bearishness
🔹 Inflation Expectations
Rising inflation keeps Silver attractive as a value hedge
Sticky inflation = structural demand support
🔹 Global Manufacturing & Industrial Demand
Silver demand remains tied to electronics, solar, and industrial usage
Expansion signals strengthen medium-term bullish bias
🔹 Upcoming High-Impact Events to Track
U.S. inflation data
Central bank policy signals
Employment & growth indicators
(Volatility expected — execution discipline required)
🔗 Related Pairs to Watch (Correlation Watchlist)
💵 TVC:DXY (U.S. Dollar Index)
Inverse relationship
Dollar weakness = Silver strength confirmation
OANDA:XAUUSD (Gold vs U.S. Dollar)
Silver often follows Gold’s directional bias
Gold strength adds confidence to Silver longs
📈 US Real Yields
Falling real yields support precious metals
Rising yields may cause pullbacks, not immediate reversals
📊 S&P 500 / Risk Sentiment
Risk-off flows often benefit precious metals
Sudden equity stress can accelerate Silver upside
🧠 Final Thought
This is not a breakout chase — it’s a controlled accumulation play using structure, patience, and layered execution.
📌 Trade smart. Scale wisely. Protect capital first.
🔥 If you see the structure, you’re already ahead of the crowd.

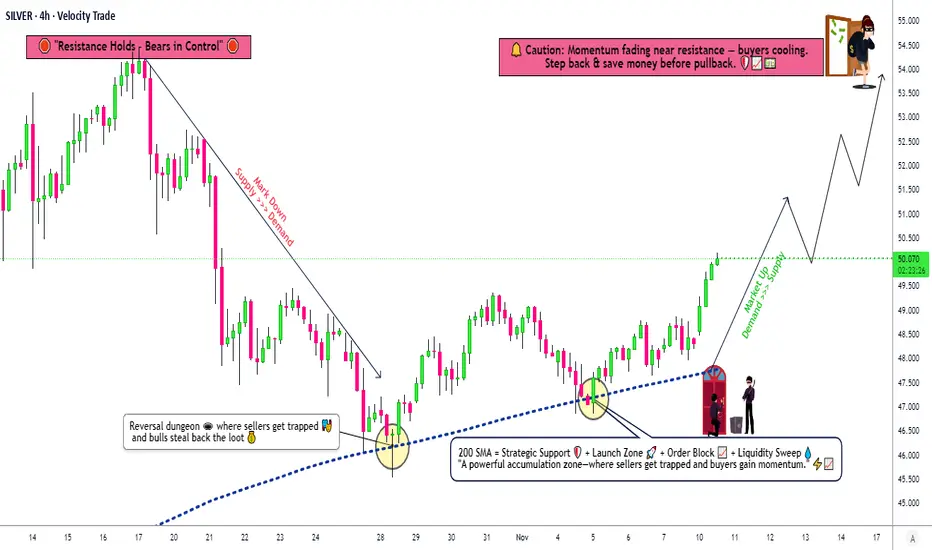
XAG/USD Key Zone Reaction – Are Bulls Ready to Take Control?🥈 XAGUSD: SILVER VS US DOLLAR 💰
Metals Market Opportunity Blueprint | Swing Trade Analysis
📊 MARKET STRUCTURE & SETUP
✅ Current Price Action: $48.34 | 52-Week Range: $28.16 - $54.50
✅ Technical Trend: Bullish Bias Confirmed
✅ Setup Type: Double Pullback Retest of 200 SMA
🎯 THE THIEF STRATEGY: LAYERED ENTRY APPROACH
This is NOT a single entry point strategy. We employ the THIEF LAYERING METHODOLOGY — multiple limit orders positioned at strategic support zones to maximize entry efficiency and reduce average entry price.
📍 ENTRY LAYERS (Buy Limit Orders):
Layer 1: $48.000 ⭐ (Immediate Support)
Layer 2: $48.500 ⭐ (Pullback Zone)
Layer 3: $49.000 ⭐ (Resistance Break)
Layer 4: $49.500 ⭐ (Extended Support)
💡 Pro Tip: You can increase/decrease layers based on your risk tolerance and position size. Accumulate, don't dump!
🛑 STOP LOSS MANAGEMENT
📌 Thief Original SL: $47.000
⚠️ This is MY suggested level based on technical structure
🔴 IMPORTANT: Dear Ladies & Gentlemen (Thief OG's) — Set YOUR OWN stop loss based on YOUR risk profile
💪 This is YOUR money, YOUR risk, YOUR decision
Adjust SL based on your strategy, account size, and risk/reward ratio
🚀 PROFIT TARGET STRATEGY
🎪 Target Zone: $54.000
📈 Technical Basis: 200 SMA acts as strong dynamic resistance
⚡ Market Structure: Overbought territory warning
🔔 Trap Alert: Potential sell-side liquidity trap at resistance
⚠️ Target Notes:
🔴 IMPORTANT: Dear Ladies & Gentlemen (Thief OG's) — Set YOUR OWN take profit target
📊 Don't just copy my TP blindly — analyze price action yourself
💼 You earn the profits, you manage the exit — YOUR choice, YOUR reward
Consider trailing stops or partial profit-taking strategy
🔗 CORRELATED PAIRS TO MONITOR (Key Dollar Pairs)
1️⃣ TVC:DXY (US Dollar Index)
Correlation: INVERSE ↔️ As DXY strengthens, XAG/USD weakens
Why Monitor: Strong dollar headwind for silver prices
Watch Level: DXY above 105.00 = bearish for silver
Strategy: If DXY rallies, reduce silver long positions
2️⃣ $XAU/USD (Gold vs Dollar)
Correlation: POSITIVE ✅ Silver follows gold's lead
Why Monitor: Gold is the "big brother" in precious metals
Watch Level: If gold breaks $2,100, silver likely follows
Strategy: Gold weakness = caution on silver longs
3️⃣ FX:EURUSD (Euro vs Dollar)
Correlation: INVERSE ↔️ Weak dollar = strong euro
Why Monitor: Dollar weakness supports precious metals
Watch Level: EURUSD above 1.1200 = bullish for silver
Strategy: Strong euro environment = tailwind for XAG
4️⃣ FX:USDJPY (Dollar vs Japanese Yen)
Correlation: INVERSE ↔️ Dollar weakness supports risk-on sentiment
Why Monitor: Risk appetite indicator (yen often "fear" currency)
Watch Level: USDJPY below 145.00 = risk-on (silver bullish)
Strategy: Lower USDJPY = better environment for commodities
5️⃣ SP:SPX / S&P 500 Index
Correlation: POSITIVE ✅ Risk-on markets support commodities
Why Monitor: Stock market rallies often lift precious metals
Watch Level: SPX new highs = bullish momentum for silver
Strategy: Market strength = broader bullish sentiment
📋 TRADE CHECKLIST BEFORE ENTRY
✅ Price action confirms double pullback on 200 SMA
✅ DXY showing weakness or neutral bias
✅ XAU/USD supporting bullish thesis
✅ No major macro events in next 4-6 hours
✅ Volume confirmation on breakout
✅ Risk/Reward ratio minimum 1:2
✅ Position size = % of account (YOUR decision)
⚡ KEY TRADING RULES
Layering ≠ Averaging Down Losers
Build positions at PRE-PLANNED levels only
Don't add to losing positions outside your strategy
Stop Loss is Sacred
NO moving stops to breakeven without reason
Protect capital first, chase profits second
Take Profits Strategically
Partial exits: Scale out at resistance zones
Don't go all-in, don't take all-out at once
Dollar Monitoring is Mandatory
Strong DXY = reconsider position
Weak DXY = stay long with conviction
Risk Management Over Everything
Your SL & TP = your rules
No trade is worth emotional decision-making
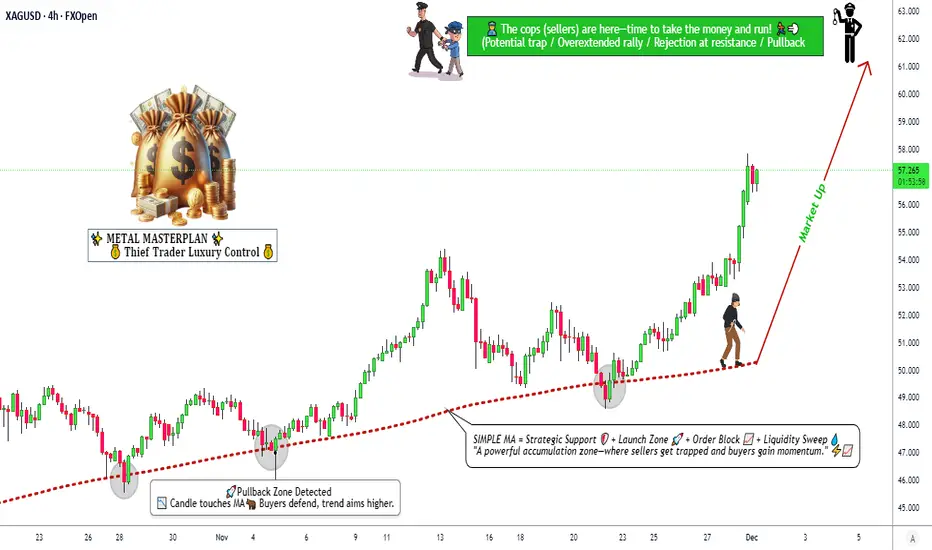
Strong Bullish Structure Developing in Silver🚀 XAG/USD (SILVER) Swing Blueprint | Bullish Structure Intact | Key Levels Mapped! ⚔️
🎯 Metals Market Opportunity: Silver (XAG/USD) Swing Trade Setup
📈 Direction: Bullish | Swing Trade
🏷 Asset: XAG/USD - Silver vs. U.S. Dollar
⚖️ Core Thesis: Silver is building a potential swing bullish structure, aiming for a significant resistance zone. This plan outlines the key framework.
📊 Trade Plan (Blueprint)
✅ Entry Zone: Consider entries on pullbacks or strength confirmation. (Any price level entry - discipline is key).
🛑 Stop Loss (Risk Management):
"This is thief SL @ 54" 💎
Dear Traders (The OG Crew), 👊
This is my protective level. YOU MUST adjust your SL based on YOUR OWN risk tolerance & strategy. I do not recommend using only my level. Manage your capital wisely.
🎯 Target Zone: @ 62 Area.
This aligns with a strong historical resistance + potential overbought/trap zone. 🪤 The strategy is to "escape with profits" as price approaches.
Note: This is my target. Take profits based on your own analysis and risk-reward goals.
🔍 Related Pairs & Market Correlations (Must-Watch) 🔗
Monitoring these pairs provides context for Silver's move:
🦅 TVC:DXY (U.S. Dollar Index):
Key Point: INVERSE correlation. A weaker TVC:DXY typically boosts commodities priced in USD, like Silver. Watch for DXY breakdowns for added Silver bullish confirmation.
🟡 XAU/USD (Gold):
Key Point: STRONG positive correlation. Gold is the leader. A strong, bullish Gold market often drags Silver higher (and vice-versa). Silver's moves can be more volatile ("Gold on steroids").
📈 US 10-Year Treasury Yields / TVC:TNX :
Key Point: General inverse relationship. Rising real yields can pressure non-yielding metals. Watch for yield pullbacks that may relieve pressure on Silver.
⛽️ Crude Oil ( BLACKBULL:WTI / ICMARKETS:XBRUSD ):
Key Point: Inflation/Commodity Sentiment Gauge. Rising oil can signal broader commodity strength and inflation fears, which can benefit Silver as a real asset.
📊 Copper ( CAPITALCOM:COPPER ) & AMEX:GDX (Gold Miners ETF):
Key Point: Industrial / Risk Sentiment. Copper confirms industrial demand outlook. AMEX:GDX strength confirms bullish precious metals sector momentum.
💎 Final Notes
This is a blueprint, not financial advice.
You are the captain of your own capital. 🧭
Always use proper position sizing.
Markets are dynamic—always monitor for structure breaks.
Let's get this bread... responsibly! 🥖
✅ Like & Follow if you find this detailed blueprint valuable! It helps the idea reach more traders. 💡
#SILVER #XAGUSD #TradingSetup #SwingTrading #Commodities #PreciousMetals #Forex #TradingView #DXY #GOLD #XAUUSD #Analysis
Silver is in the Bearish directionHello Traders
In This Chart AUDJPY HOURLY Forex Forecast By FOREX PLANET
today AUDJPY analysis 👆
🟢This Chart includes_ (AUDJPY market update)
🟢What is The Next Opportunity on AUDJPY Market
🟢how to Enter to the Valid Entry With Assurance Profit
This CHART is For Trader's that Want to Improve Their Technical Analysis Skills and Their Trading By Understanding How To Analyze The Market Using Multiple Timeframes and Understanding The Bigger Picture on the Charts

Silver is flashing a warning it hasn’t shown in decadesToday the price crossed $90 per ounce while the monthly RSI the 92 level. Higher than 2011, when silver topped out near RSI 82 and then fell by ~80%
The only other time we’ve seen this level was 1980… followed by a ~90% crash
History doesn’t repeat perfectly, but it does rhyme
So the real question is: what makes this time different?

#SILVER: Swing Buying Up To Yearly End Target Of $100XAGUSD(SILVER) ANALYSIS🎇
🔺After a big rally, silver took a dip, dropping about $70 from its high of $82. But don’t worry, it’s bounced back from $70 and is now trading at $80, with a chance to hit $85 by the end of January. The market is a bit wild right now, mostly because of recent political stuff.
🔺We’ve got three potential goals for this swing trade: we’re aiming for a first target at $85, then a second at $90 and a final one at $100. This plan is for a longer stay, maybe even a year. But since things have been so up and down lately, we’re betting the price will keep climbing.
🔺If you think our analysis is helpful, please give us a thumbs up and share your thoughts in the comments.
SetupsFX Team👨💻🏆

Silver: short term bullish, short term support at $82.6Par SAR: buy
EMA cross: buy
Supertrend: buy
Stoch RSI: buy
MACD: buy
Fundamentals are strong

Silver - This metal is blowing up now!💣Silver ( OANDA:XAGUSD ) is rallying even higher:
🔎Analysis summary:
Just a couple of months ago, we witnessed another bullish break and retest on Silver. It was quite obvious that Silver will rally accordingly and just recently, we experienced another +150% rally. However, looking at the higher timeframe, Silver is still not done.
📝Levels to watch:
$100
SwingTraderPhil
SwingTrading.Simplified. | Investing.Simplified. | #LONGTERMVISION

Parabolic Moves Don’t Always End in Collapse — Silver ExplainedI’ve seen many analyses from my colleagues where 1980 and 2011 are used not as upside projections, but as collapse templates for silver.
The argument is simple and visually convincing: silver has already gone parabolic, therefore the next chapter must be a collapse similar to those historical episodes.
I understand the logic.
I don’t predict the future, and I can’t categorically deny that such an outcome is possible.
But here’s where I draw a clear line: similar-looking charts do not guarantee similar outcomes, especially when the underlying drivers are fundamentally different.
And in silver’s case, they are different.
Let’s be precise about what 1980 really was (and why it collapsed)
The 1980 silver collapse is often treated as a “natural law of parabolic moves”.
In reality, it was not a natural market outcome.
It was the direct consequence of extreme concentration and leverage, driven by the Hunt brothers.
What made 1980 fragile by design
- The Hunts accumulated an extraordinary share of the global silver supply, both physical and paper.
- They used massive leverage in a relatively small and illiquid market.
- The price did not rise because global demand structurally changed — it rose because supply was artificially constrained.
- Once exchanges changed the rules (margin hikes, liquidation-only trading), the entire structure collapsed under its own weight.
This is critical:
The collapse of 1980 was not caused by silver being “too expensive”.
It was caused by the system forcibly unwinding a concentrated position.
So when someone says “this looks like 1980”, the real question is:
- Where is today’s equivalent of that concentration?
- Who controls 30–40% of deliverable supply?
- What single entity is forced to liquidate?
If that element is missing, then the collapse logic weakens dramatically.
2011: parabolic, yes — structurally unstable, also yes
2011 is a more honest comparison, and this is where many collapse arguments focus.
Silver:
- rallied aggressively,
- became a retail darling,
- and eventually collapsed hard.
But again, the reason it collapsed matters.
Why 2011 unraveled
- The rally was dominated by financial demand, not structural necessity.
- ETFs, leverage, and macro fear created fast money flows.
- When liquidity tightened and risk appetite faded, demand evaporated quickly.
- There was no structural constraint on supply forcing price stability.
In other words:
- 2011 collapsed because demand was reversible.
- Once sentiment flipped, there was nothing underneath to slow the fall.
Now comes the disagreement: why I don’t expect a 1980/2011-style collapse this time
Yes — I fully agree on one thing: extreme volatility is coming, or is already here (yes, more extreme than we've seen!)
Silver doesn’t trend quietly. It never has.
But volatility and collapse are not the same thing.
The key difference today: the type of demand
Today’s silver market is not driven solely by:
- fear,
- speculation,
- or monetary narratives.
A large and growing portion of demand is industrial and strategic:
- electrification,
- energy transition,
- technology infrastructure.
That demand:
- doesn’t disappear overnight,
- doesn’t panic-sell because RSI is overbought,
- and doesn’t care about chart symmetry.
This changes the downside dynamics.
Supply cannot respond the way people assume
Another overlooked point:
- most silver production is a by-product of other metals.
- higher prices do not instantly bring new supply online.
In 1980 and 2011, supply dynamics were not a binding constraint.
Today, they are.
That doesn’t mean price can’t drop — it means drops are more likely to be violent corrections, not structural collapses.
About the “parabolic = must collapse” logic
This is where I respectfully disagree with many analysts.
A parabolic move tells you:
- volatility is increasing,
- positioning is crowded,
- risk management becomes essential.
It does not automatically tell you:
- the entire move must fully retrace,
- or that price discovery was fake.
Markets can:
- correct through time instead of price,
- form wide ranges,
- or retrace partially and rebase.
History offers multiple outcomes, not a single script.
My base case (clear and unemotional)
- Yes, I expect extreme swings.
- Yes, I expect sharp pullbacks that will scare most participants.
- No, I do not see a clear mechanism today for a 1980-style forced collapse.
- And unlike 2011, I don’t believe demand disappears just because momentum cools.
This is not optimism.
It’s structure-based reasoning.
Trading perspective (grounded)
Because I expect volatility:
- I don’t chase vertical candles.
- I respect levels, not narratives.
- I scale, I take partial profits, and I allow room for noise.
- I treat silver as a dangerous instrument, not a lottery ticket.
Being right about direction is useless if volatility kicks you out first.
Final thought
My colleagues may be right — markets can always surprise.
But assuming collapse just because the chart looks familiar is lazy analysis.
1980 collapsed because of forced concentration unwind.
2011 collapsed because of reversible financial demand.
Today, silver is volatile — not hollow.
And that distinction matters more than any historical overlay.
The market will decide.
My job is to respect risk, not marry analogies 🚀
Best of luck!
Mihai Iacob

Silver is in the Bullish directionHello Traders
In This Chart XAGUSD HOURLY Forex Forecast By FOREX PLANET
today XAGUSD analysis 👆
🟢This Chart includes_ (XAGUSD market update)
🟢What is The Next Opportunity on XAGUSD Market
🟢how to Enter to the Valid Entry With Assurance Profit
This CHART is For Trader's that Want to Improve Their Technical Analysis Skills and Their Trading By Understanding How To Analyze The Market Using Multiple Timeframes and Understanding The Bigger Picture on the Charts

Silver Analysis (XAG/USD)CAPITALCOM:SILVER
Chart Structure
From December 6 to 26, the price followed a strong uptrend.
On December 27, silver peaked near $84 and then corrected sharply.
A strong support zone around $70 formed after the drop.
The current price is $74.53, and a recovery appears to be forming with bullish candles.
Key Support & Resistance Levels:
Level | Price
Resistance 1 | ~$76.5
Resistance 2 | ~$80
Support 1 | ~$72
Support 2 | ~$70 (major)
Patterns & Price Behavior:
Higher Lows are forming → indicating bullish structure.
A V-shape recovery pattern is visible → suggesting a strong rebound.
Buyers are stepping in aggressively after the pullback.
Fundamental Analysis
Factor | Status | Impact on Price
Global Inflation | Still elevated | Bullish for silver
Fed Interest Rate Outlook | Expected cuts in early 2026 | Bullish for silver
Geopolitical Tensions | Ongoing risks in ME/EU | Increases safe haven demand
Industrial Demand for Silver | Stable or increasing | Supports price
China’s Economic Recovery | Gradually improving | Boosts industrial demand
Conclusion: The fundamental outlook supports bullish continuation for silver.
Momentum Analysis
Strong bullish momentum after bouncing off the $70 support.
Recent candles show high volume and strong green bodies, signaling fresh buying interest.
If momentum holds, resistance at $76.5 could be tested and potentially broken.
XAG/USD Price Forecast
Timeframe | Expected Move
Short-Term | Likely move to $76.5–$78
Medium-Term | If resistance breaks, $80–$82 target
Long-Term (Weeks) | $88–$92 possible with strong fundamentals
Warning:Any losses are entirely your own responsibility. This is solely an analysis and **not** a recommendation to buy or sell.

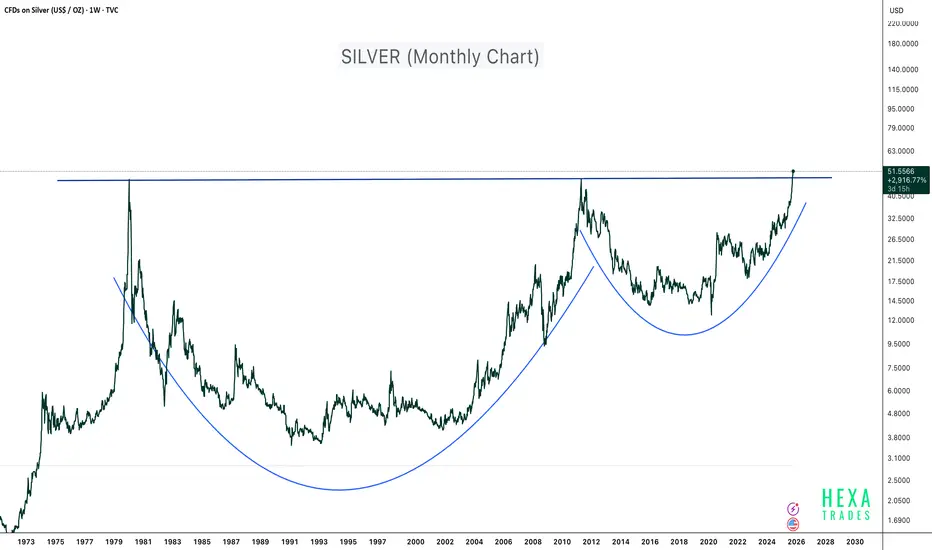
Silver - 45 Years of Breakout!Silver has just completed one of the largest and longest cup and handle patterns in financial history, spanning more than four decades. The metal has officially broken above the 1980 and 2011 highs, signaling a potential supercycle breakout on the monthly timeframe.
This type of long-term technical structure typically marks the beginning of a massive secular bull run, often driven by macroeconomic shifts such as inflation cycles, fiat currency debasement, and rising demand for hard assets.
Technical Highlights:
- Pattern: 45-year Cup and Handle formation
- Breakout Zone: Above $50 confirmed (Weekly chart)
- Structure: Deep base formation showing multiple accumulation phases (1981–2001 and 2012–2023)
Macro Perspective:
Silver is benefiting from:
- Increased industrial demand (especially in solar, EV, and electronics sectors)
- Inflationary monetary policies and growing global money supply
- Renewed investor interest in tangible and real assets
This breakout could mark the start of a multi-year bull run for silver. Long-term investors may view this as an opportunity to accumulate and hold for 10–15 years, aligning with the magnitude and duration of the pattern.
If the price experiences short-term pullbacks in the coming months, use DCA (Dollar-Cost Averaging) to build long-term exposure.
Conclusion:
After 45 years of consolidation, silver is finally breaking free. The chart points toward a historic structural breakout, potentially setting the stage for the next precious metals supercycle.
Cheers
Hexa
Disclaimer:
This analysis is for educational purposes only and does not constitute financial advice. Always conduct your own research and manage risk responsibly.
Silver is in the Bullish directionHello Traders
In This Chart XAGUSD HOURLY Forex Forecast By FOREX PLANET
today XAGUSD analysis 👆
🟢This Chart includes_ (XAGUSD market update)
🟢What is The Next Opportunity on XAGUSD Market
🟢how to Enter to the Valid Entry With Assurance Profit
This CHART is For Trader's that Want to Improve Their Technical Analysis Skills and Their Trading By Understanding How To Analyze The Market Using Multiple Timeframes and Understanding The Bigger Picture on the Charts

Chandi Hi Chandi!Chandi is trying to reach till Chand!
Today Silver Future has touched 214583 which is Life time high as of now....
Today after giving a new LTH it is showing the sign of Distribution here.
If Silver Breaks down todays low which is 209000 which is a Support in 1 Hr time Frame it can turn Bearish as also we can see Divergence of RSI is Daily Time Frame.
Once Silver Turns Bearish we can see the level of 180000 in next few weeks.
level of 180000 will be very crucial as if it breaks this level also next stop will be 140000
and if it takes Support from 180000 and shows Bullish Sign here one can invest small qty here well 140000 will be a very good level to invest in Silver.
Lets see!

Silver Potential Bullish ContinuationAfter a considerable retracement, Silver price still seems to exhibit signs of overall potential Bullish momentum as the price action may form a credible Higher Low with multiple confluences through key Fibonacci Levels, Higher timeframe Harmonic Projections and Support levels which presents us with a potential long opportunity.
Trade Plan:
Timeframe : 1D
Entry : 61.204
Stop Loss : 55.64
TP 1 : 66.768
TP 2 : 72.315


SilverXAGUSD
- Bullish Channel as an corrective pattern in Short Time Frame
- RSI - Divergence
- Completed " 1234 " Impulsive Waves
- Break of Structure
- S / R Level
