#SILVER: Swing Buying Up To Yearly End Target Of $100XAGUSD(SILVER) ANALYSIS🎇
🔺After a big rally, silver took a dip, dropping about $70 from its high of $82. But don’t worry, it’s bounced back from $70 and is now trading at $80, with a chance to hit $85 by the end of January. The market is a bit wild right now, mostly because of recent political stuff.
🔺We’ve got three potential goals for this swing trade: we’re aiming for a first target at $85, then a second at $90 and a final one at $100. This plan is for a longer stay, maybe even a year. But since things have been so up and down lately, we’re betting the price will keep climbing.
🔺If you think our analysis is helpful, please give us a thumbs up and share your thoughts in the comments.
SetupsFX Team👨💻🏆
Silverforecast

Silver - Looking To Buy PullbacksH1 - Strong bullish move.
Currently it looks like a pullback is happening.
Until the two Fibonacci support zones hold I expect the price to move higher further.
If you enjoy this idea, don’t forget to LIKE 👍, FOLLOW ✅, SHARE 🙌, and COMMENT ✍! Drop your thoughts and charts below to keep the discussion going. Your support helps keep this content free and reach more people! 🚀
--------------------------------------------------------------------------------------------------------

XAG Analysis
15 min analysis shows consolidation area. Any side breaks with strong close of candle out of the box, I will open position. Blue line is 70% of the previous bearish move passing is another confirmation for another bullish leg.
Target can be top of the channel but there might be another bottom touch before hitting top, so manage your positions and close some portion to save your profit.
Weekly candle close was above all other weeks.
Stay tuned for our next updates.

Silver Analysis
4h analysis shows the reaction on resistance area and price could hold itself above it. which is %70 of the bearish move. So bullish signal (blue box)
Daily candle closed above all other days. another bullish signal. (yellow line)
According to ichimoku and fibo this area is important so signal of bullish.
we are close to the top of first channel, will publish update later.
Stay tuned for our next updates.

Silver Analysis
Daily candle closed above tha last 3 days, bulish signal. (purple line)
4h analysis shows the reaction on resistance area (blue) that sellers were not strong enough to bring the price to lower low, additionally this area is valid if we use Ichimoko indicator too, so if candle close above this area we can join buyers.
Stay tuned for our next updates.

Silver’s 2025 Explosion — How High Can It Go?In 2025, Silver ( OANDA:XAGUSD ) has experienced a remarkable surge, making it one of the most notable assets of the year. As we approach the end of 2025, I’ve decided to analyze silver to see how far its bullish trend might continue. So, stay with me as we delve into the reasons behind silver’s rise and explore how far this upward momentum could go.
Let’s begin by looking at the fundamental factors driving silver’s increase in 2025. After that, we’ll move on to the technical analysis.
Fundamental Drivers Behind Silver’s Massive 2025 Rally:
Structural Supply Deficit — Multi‑year deficits draining inventories, tight physical market.
Strong Industrial Demand — Solar, EVs, semiconductors & data centers consuming silver at record levels.
Rate Cut Expectations — Anticipated Fed easing lifts non‑yielding assets like silver.
Safe‑Haven Flows — Geopolitical risk, inflation, and a softer dollar boosting precious metals demand.
Liquidity & Momentum — Smaller market vs gold( OANDA:XAUUSD ) amplifies swings, attracting speculators.
Silver has surged ~ 150–165% YTD , setting fresh all‑time highs as both an industrial metal and investment hedge.
-----------------------
Technical Analysis:
Now, considering the technical side, with less than five days remaining before the six-month and one-year candles close, I’ll focus on a higher time frame for silver’s analysis. Recently, silver achieved a new all-time high, capturing widespread attention, and many prominent figures are now discussing silver’s potential.
From a classic technical analysis perspective on the six-month time frame, it appears that silver has formed a bullish continuation pattern, specifically a cup and handle pattern, and the recent six-month candle has broken the neckline/resistance zone($50-$34) with strong volume. This suggests that the bullish trend for silver is likely to continue.
From an Elliott Wave perspective, it seems that silver is completing wave 3, potentially within an ascending channel and a Potential Reversal Zone(PRZ) .
I expect that silver, upon entering this Potential Reversal Zone(PRZ) , will undergo a correction. If you’re considering adding silver to your portfolio, it’s wise to wait for that correction, as buying at all-time highs can be riskier due to the strong upward momentum.
What do you think? How far can silver’s bullish trend extend, and what levels might we see in 2026?
💡 Please respect each other's opinions and express agreement or disagreement politely.
📌 Silver/ U.S. Dollar Analyze (XAGUSD), 6-month time frame.
🛑 Always set a Stop Loss(SL) for every position you open.
✅ This is just my idea; I’d love to see your thoughts too!
🔥 If you find it helpful, please BOOST this post and share it with your friends.

Silver likely to outperform Gold in coming decade upto 5-7X1. World Order Shifting
2. Cup and Handle pattern with Multiyear Breakout
3. Gold is mainly a monetary asset (central‑bank reserves, jewellery, investment), so its price is driven by interest rates, inflation expectations
Silver has a dual role: a precious metal plus a heavily industrial metal used in solar, EVs, electronics, data centres and other technology, so it benefits when both macro hedging demand and real‑economy demand rise together.
4. Silver is critical for photovoltaics and EVs: each solar panel uses roughly 20 grams of silver, and solar alone has grown to about 15–20% of total annual silver demand, with further growth expected through 2030.
5.EVs and high‑performance electronics use significantly more silver than internal‑combustion or legacy systems, so policy‑driven decarbonisation and AI/data‑centre build‑out act as structural demand tailwinds that gold does not enjoy.
6. China is one of the largest silver miners and the dominant refiner, and from 2026 it is introducing export controls that require licences to ship silver abroad, effectively tightening an already deficit global market
7. China contributes just 13% of overall silver production but one market study reports silver import growth of over 200% year‑on‑year from 2023 to 2024, and China hosts over 80% of global solar panel manufacturing and major EV and electronics capacity, so it absorbs a large share of the world’s silver used in photovoltaics, electronics and related technologies.
Cautions:
Silver is more volatile 1.5 to 2 times but historical returns are better than Gold.

Silver Analysis
Silver is close to an important resistance, it reacted a few times and could not breakthrough but did not make lower lows too, so still market is bullish.
Stay alert on resistance line (red line) and with confirmation you can join buyers.
Stay tuned for our next updates.

Silver Bullish Continuation Expected After PullbacksH4 - Strong bullish move
No opposite signs
Until the two support zones hold I expect bullish continuation
👉 If you enjoy this analysis, please Like, Follow, and Support the profile! Your engagement motivates us to share more quality setups.

Silver - Looking To Buy Pullbacks H4 - Strong bullish move.
Currently it looks like a pullback is happening.
Until the two Fibonacci support zones hold I expect the price to move higher further.
If you enjoy this idea, don’t forget to LIKE 👍, FOLLOW ✅, SHARE 🙌, and COMMENT ✍! Drop your thoughts and charts below to keep the discussion going. Your support helps keep this content free and reach more people! 🚀
--------------------------------------------------------------------------------------------------------

Silver (XAGUSD) Analysis 04/03/2021this is a 2 Day Candle Chart
as we can see the Price is up Ranging in a Yellow Ascending Parallel Channel where currently it is trying to break the lower bond.
there exist a Fibonacci golden zone of the smaller impulsive wave, which can show Support and if the price bounces from it then we can target the 1TP, which is Fibonacci Expansion -27% level of the main Bullish Wave.
the Red Box (Fib Confluences Level IMPORTANT) is the confluences of the 76.4% Fib Retracement of Smaller Impulsive wave and 38.2% Fib Retracement of the main bullish wave, where if the price falls and it stands as a support and bounces the price, then we can target the 2TP, which is the -61.8% Fibonacci Expansion Level of the main Bullish Wave.
there are 2 Vertical Lines which Shows the Speculated Dates for Achieving the Specified Targets, they are specified by Trend-Base Fibonacci Time,
there are total of 2 TPs Specified
1TP=35$
2TP=41$
please comment your Opinions...

XAGUSD Analysis
From my perspective, I believe we are in a bullish channel and now in midway, I would be expecting to reach purple resistance this week, a little correction there or range then top of channel.
Although we have had a sharp bearish candle but yesterday price could make it up and make the daily candle close, above other daily candles from 2 days ago.
This is not a signal, do not open any positions with this analysis.
Stay tuned for our next update.

SilverXAGUSD
- Bullish Channel as an corrective pattern in Short Time Frame
- RSI - Divergence
- Completed " 1234 " Impulsive Waves
- Break of Structure
- S / R Level

SilverXAGUSD
- Completed " 12345 " Impulsive Waves and " A " Correction Waves
- RSI - Divergence
- Resistance Level
- Break of Structure
- Fibonacci Level - 100.00% / 121.70%

Gold & Silver Are On Fire Right Now!🌕 Gold is up — heading towards its fourth straight monthly gain, hitting a fresh two-week high on expectations of an upcoming rate cut by the Federal Reserve.
💎 Silver just smashed a new all-time high — zooming to $56.78/oz, rallying ~16.6% this month alone!
📈📉 With global rate-cut hopes rising, safe-haven metals are drawing fresh investor love. Whether you call it “hedge”, “insurance”, or “bullish vibe” — the trend is clear: metals are in demand.
👉 Bottom line: If you’ve been waiting for a strong entry into commodities — now might be the moment. Gold and silver are ringing the bell loud and clear! 🔔

SilverXAGUSD
- Bullish Channel as an corrective pattern in Long Time Frame
- Change of Characteristics
- Break of Structure
- Completed " 12345 " Impulsive Waves
- Demand Zone

Silver - Short Term Buy IdeaH1 - Strong bullish momentum.
No opposite signs.
Until the two Fibonacci support zones hold I expect the price to move higher further.
If you enjoy this idea, don’t forget to LIKE 👍, FOLLOW ✅, SHARE 🙌, and COMMENT ✍! Drop your thoughts and charts below to keep the discussion going. Your support helps keep this content free and reach more people! 🚀
-------------------------------------------------------------------------------------------------------------------

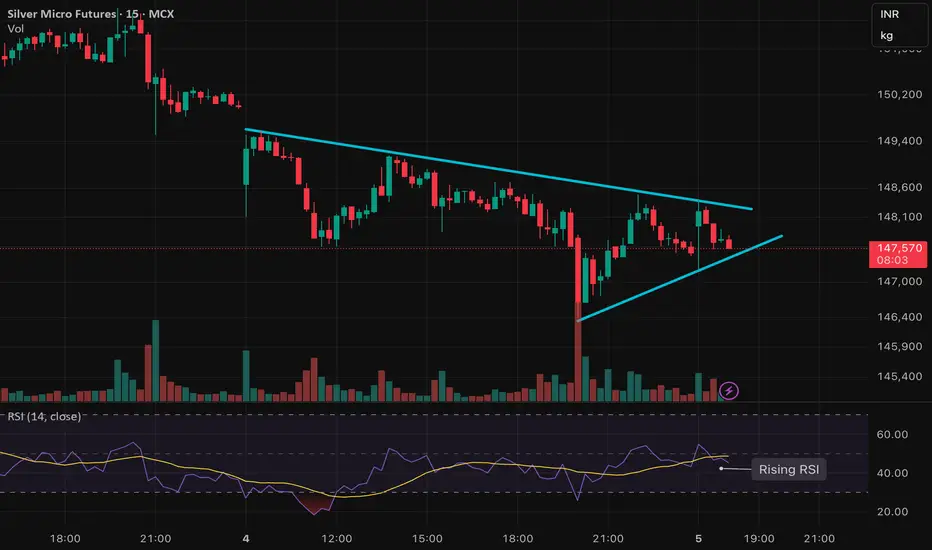
SILVER forming a wedge pattern ready for either side brakoutPrice action on Silver is getting tighter and is now trading inside a wedge formation, which usually leads to a strong move once price breaks out — either up or down. No bias yet, just preparing for momentum on whichever side gives confirmation.
📌 What I’m watching:
• Trendline breakout with volume
• Retest + continuation for safer entries
• Volatility spike around key levels
• RSI & momentum alignment before execution
⚠️ Not a buy/sell call. This is just market observation for educational purposes.
Trade your own plan, manage risk, and respect position sizing.
If you like clean chart breakdowns, price-action setups and real-time market tracking — hit follow so you don’t miss the next update.
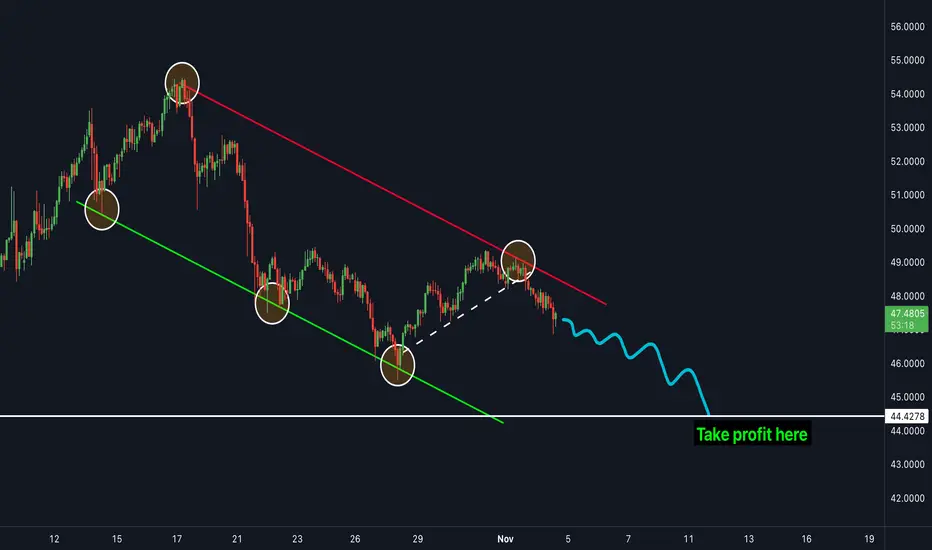
SILVER is ready to drop more - SELL NOW!Silver has been in a clear downtrend for the last few weeks and has struggled to move to the upside. The price is currently in between a bearish channel and is bouncing in-between both resistance and support zones. The price broke the most recent trendline (shown in white) which acted as a support zone. The next target is the white line shown on the chart as "take profit". This is the next major support zone which the price is very likely to hit next.
SilverXAGUSD
- Completed " 12345 " Impulsive Waves
- Demand Zone
- Fibonacci Level - 50.00% / 61.80%
- RSI - Divergence
- Bullish Channel as an corrective pattern in Short Time Frame

Silver - Expecting Bullish Continuation In The Short TermH4 - Strong bullish momentum.
No opposite signs.
Until the two Fibonacci support zones hold I expect the price to move higher further.
If you enjoy this idea, don’t forget to LIKE 👍, FOLLOW ✅, SHARE 🙌, and COMMENT ✍! Drop your thoughts and charts below to keep the discussion going. Your support helps keep this content free and reach more people! 🚀
--------------------------------------------------------------------------------------------------------------------

SILVER: Bullish, But Retracing. Sell The Dip, Buy At the +FVG!SIlver, like the other metals, is bullish. Currently, price is retracement. This could present a selling opportunity.
The -FVG is holding price at bay, If the market continues to respect this premium array, look for short term sells down to the sellside liquidity at the relative equal lows at 46.70, in
route to the Weekly +FVG.
There, we will look for high probability buy setups.
This is an ERL to IRL move, my peoples.
*Price may sweep the consolidation high before dropping lower. So be mindful of the potential for a liquidity event before the move.
Enjoy!
May profits be upon you.
Leave any questions or comments in the comment section.
I appreciate any feedback from my viewers!
Like and/or subscribe if you want more accurate analysis.
Thank you so much!
Disclaimer:
I do not provide personal investment advice and I am not a qualified licensed investment advisor.
All information found here, including any ideas, opinions, views, predictions, forecasts, commentaries, suggestions, expressed or implied herein, are for informational, entertainment or educational purposes only and should not be construed as personal investment advice. While the information provided is believed to be accurate, it may include errors or inaccuracies.
I will not and cannot be held liable for any actions you take as a result of anything you read here.
Conduct your own due diligence, or consult a licensed financial advisor or broker before making any and all investment decisions. Any investments, trades, speculations, or decisions made on the basis of any information found on this channel, expressed or implied herein, are committed at your own risk, financial or otherwise.

#XAGUSD(SILVER): Price is likely to drop at $41 area. The current trading price of XAGUSD (SILVER) is at an all-time high. This is attributed to global uncertainty and the decline of the US Dollar. However, the lack of significant volume to support this level suggests a potential rapid decline. This decline could facilitate the price reaching a key level of $41.
There are two potential benefits from this drop. Firstly, it would allow for maximisation of trading by selling. Secondly, when the price reaches this level, we can purchase at the discounted price.
We wish you the best of luck and trade safely.
Team Setupsfx_
