XAGUSD I Overextended "W" formation Welcome back! Let me know your thoughts in the comments!
** XAGUSD Analysis - Listen to video!
We recommend that you keep this pair on your watchlist and enter when the entry criteria of your strategy is met.
Please support this idea with a LIKE and COMMENT if you find it useful and Click "Follow" on our profile if you'd like these trade ideas delivered straight to your email in the future.
Thanks for your continued support!
Silverforecast

Silver or XAU/USD hits golden crossI am thrilled to share some exciting news - silver has just hit a golden cross!
For those unfamiliar with the term, a golden cross is a technical analysis term that occurs when the 50-day moving average exceeds the 200-day moving average. This bullish signal indicates a potential upward trend in the price of silver.
This is fantastic news for all who have closely monitored the silver market. Considering long silver and taking advantage of this upward trend is an excellent opportunity.
So, I encourage you to consider your investment strategy and add silver to your portfolio. With the golden cross in place, it's an ideal time to take advantage of this bullish signal and potentially profit from the upward trend.


XAGUSD 31May2023when the price rises more than the light blue line, there is a possibility of reversal and the price will reach the SR Flip area in the short term.

Silver Ready for Giant BreakoutSilver made a symmetrical triangle formation from 1988 to 2004 and broke this formation in 2004.
Its peak and order block in 1983 worked as resistance in 2006 and as support in 2008 and 2020.
I think the peak Silver did in 2011 was an order block too. The reason for this is that this order block was rejected in 2012.
The symmetrical triangle formation it has made since 2009 is also in the critical region now.
I can say that I am waiting for the scenario of breaking up of the symmetrical triangle. I think that the scenario that will emerge after this break will be similar to the 2004 - 2012 scenario.

SILVER 21May2023there wasn't much change/movement in silver last week, it's still in a correction period so there could be a sudden and quite high upward movement. I stay focused on opportunities to find areas to short.

Silver is shorted today
The silver price is currently near US223.75/ounce, and it has fallen by about 1.4% during the day.
If it falls below US223.75/ounce, this will open the way for a further decline in silver prices, and silver prices will continue to be expected for some time to come. The bearish trend scenario.
Currently waiting for the silver price to fall below US223.70/ounce to confirm that the silver price will fall further to the next short target of US223.00/ounce.
Stochastic indicators are currently showing bearish signals, and silver prices will show more bearish possibilities in the coming trading days.
It should be noted that if the silver price breaks through US224.15/ounce, this will push the important resistance level of the silver price to US224.60/ounce, and then try to fall again.
Today's silver price will be between the support level of USD23.50/ounce and the resistance level of USD24.30/ounce.
Silver strategy:
SILVER: sell @23 tp:24.3
Next, I will continue to provide more trading signals, and the weekly profit can reach more than 5K-10Kusd. I need signals to join me as soon as possible!

Silver shorting
Silver has been in a low-level shock yesterday, and the current bearish pullback has ended, so today the bearish trend continues to be bearish.
Silver @sell23.95 tp 23.5~23.1.

Silver: Let the show begin…! 🎪Ladies and Gentlemen, step right up and let the show begin! Please welcome silver, our brilliant artistic performer, in the arena that is our chart… See next: a somersault into the orange zone between $24.45 and $25.05 to finish wave iv in orange, followed by a brave downwards leap to complete wave v in orange as well as wave (a) in blue. Watch with bated breath as silver then spirals upwards again, stopped only by the mark at $25.41, where it should rebound and glide further downwards. There is a 30% chance, though, that silver could gain too much upwards momentum and thus soar above the mark at $25.41. In that case, we would expect it to reach a new high in the form of wave alt.x in magenta first before turning downwards again.

Silver 14May2023the movement of silver looks bearish, but in my opinion this bearish is a correction from the bullish trend, this analysis will fail if the price drops more than the invalid area. we can take the opportunity to sell when the price of a possible correction rises in the SR Flip area

Silver (XAGUSD) is at support, will it break or hold?Silver price resumed its positive trading to succeed achieving our first waited target at 26.07, facing solid resistance there, to show some expected slight bearish bias, waiting to get positive momentum at 25.87 support that assists to push the price to resume the positive trades and breach the mentioned level to open the way to head towards 26.80 as a next main station, followed by 27.70
The MA50 continues to provide the positive support to the price, to continue suggesting the bullish trend for the upcoming period, noting that breaking 25.87 will put the price under negative pressure to head towards testing 24.50 and 23.90 areas before any new attempt to rise

Potential Double Top Forming on SI Daily ChartSilver touching major resistance area and potentially forming a double top if it can't break above 26.50.
I also noticed a double bottom that's playing out on the 15 minute chart that I missed while being away.
Could go either way, but I think fundamentals support bulls.

Bull Silver24.90 remains a strong 4 Hr support level. RSI touched my divergence trendline perfectly before price bounced right back up. Waiting for price to cool off a bit before entering long again.

Silver Pulling BackNot perfect, but big shooting star on SI daily chart along with break below the 50EMA on the 4 hour chart makes me think Silver may pullback to major support from 24.00-24.60 before shooting back up. Could the star really be the 2nd top of a double-top? Time will tell. Holding steady for now.

2nd Chance Pullback - SI Bullish RSI DivergenceI'm seeing that 4 of the last 6 times that this pattern has played out over the past 4 years, at the first major pullback the RSI continues to put in a higher low.
Price then move higher.

DXY Weekly Head & ShouldersThis goes along with my ideas on Silver.
Weekly DXY Head & Shoulders helping to push up metal prices.

Silver Bullish RSI Divergence 4H ChartI'm seeing a bullish RSI divergence coupled with a descending triangle on the 4H silver chart. I see a similar setup 5 times in the past year and each time the price went up. Am I seeing this correctly?

XAGUSD Monthly AnalysisHey traders, we have clear patterns, bullish movement expecting same as XAUUSD

SILVER - XAG - Why I m BEARISH - FULL SETUPSilver is one step away from reaching resistance on the MONTHLY, it has increased a lot, a lot, but it will soon reach the area where many will close their profits.
There are many institutions that take profit in this area, so this area will become more and more difficult to hold and thus it will weaken a lot, in addition, RSI is super overbought and this shows that interest will soon decrease if the price does not have a serious correction.
I saw the first step on Friday when it rejected the support on the Weekly chart and fell quite nicely, but I have a SELL order above which is safer and could produce a nice profit.

Silver/XAGUSD end of session updateSilver prices shows positive trades now in attempt to move away from the bullish channel’s support line, reinforcing the expectations of continuing the bullish trend for today, which targets testing 25.30 as a next station.
Therefore, no change to the positive scenario that depends on the price stability above 24.90, as breaking it will force the price to turn to decline and head towards 24.05 before any new positive attempt.

Silver's Price Outlook: Targets for Uptrend and Downtrend ScenarThe resistance level at 67160 is a critical level for silver's trend, as it will determine whether the current uptrend will continue or a downtrend may be expected. If the price manages to break and sustain above the resistance level, it suggests a continuation of the uptrend, with potential upside targets at 68360 , 68760 , and even as high as 69300+ .
However, it's important to note that these targets are not guaranteed and depend on the price's ability to overcome the resistance level. On the other hand, if the price fails to break above the resistance, we may expect a potential downtrend. In this scenario, downside targets may include 65600 and 65060 below the critical resistance level.

Silver: Profit can be made by short selling in this area
Time is fair. Whether you are lazy or hardworking, time will gradually give you the answer that belongs to you. Those who cherish time will be cherished by time!
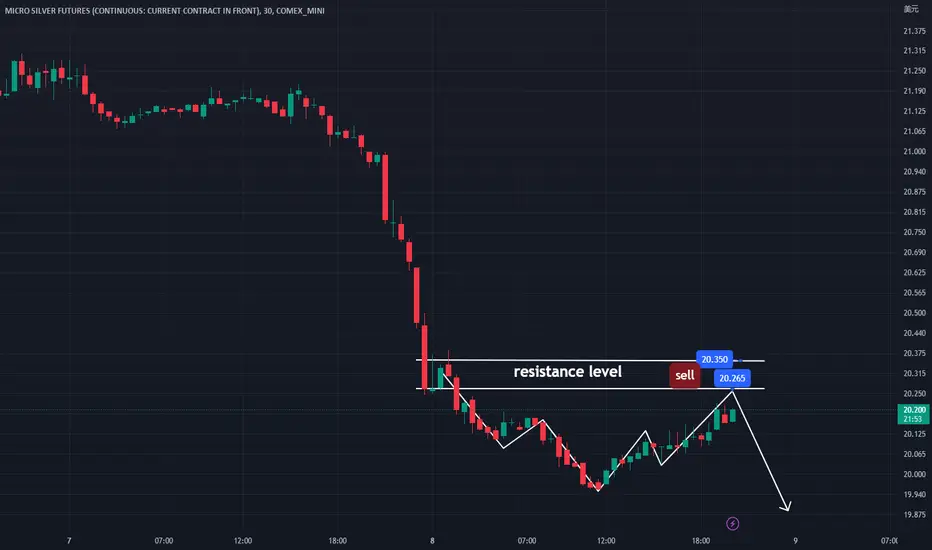
Currently, the pressure on silver is concentrated in the 21.5 area, where short selling can still be repeated. Silver has not followed the recent rise in gold prices, largely due to previous pressure. Currently, silver is more closely following the trend of commodities, similar to oil. After all, there will only be industrial demand in the later stages of economic recovery.
At present, it is still in a period of economic recession, so there is naturally no significant upward movement. However, after the stabilization of gold adjustments in the later stages, if they both rise simultaneously again, silver's rise will definitely be greater than gold's.
Furthermore, there is a possibility that the dark horse will continue to test historical highs in the future. Currently, short selling is still recommended at the 20-21 area with a stop loss at 22, and long positions can be tentatively initiated in batches near 19.5.
silver will be falling in the next weekthe silver XAGUSD will have to make a correction to 21.20$ and maybe to the 21.40 area as well before the continuation of the downtrend to the 20.33 area. also, there is a great probability that the market can go down without making a correction!
that's what I believe. what about you guys? what do you think? tell me your opinion. do you agree or not .??
good luck traders !!
