SILVER LONG TRADE PLANTVC:SILVER
TVC:SILVER is primed to POP and eyeing next levels.
As Always, NFA & DYOR.
Silveridea

Upside for Silver is Coming! Long Setup!I am taking an early long position on Silver as we are getting a trendline and 4 hourly resistance breakout.
Long from 22.79 or as close as possible.
Target 1 - 23.30 - Set stop loss to break even once T1 has been hit.
Target 2 - 24.05
Target 3 - 24.50
Extreme Target - 25.49
Stop loss - 21.80

#SILVER: A strong sell off expected! Dear Traders,
OANDA:XAGUSD a strong sell off is expected on silver this week. Firstly because recently price have been overbought and there is going to be ' a strong bearish impulse' due to adjusting he market equilibrium. Secondly, the NFP and other strong news that can affect the silver future price significantly.
We will have to keep close eye on the price action if price does not respect our zone then the idea will be automatically invalidated. we will update on this as we progress.

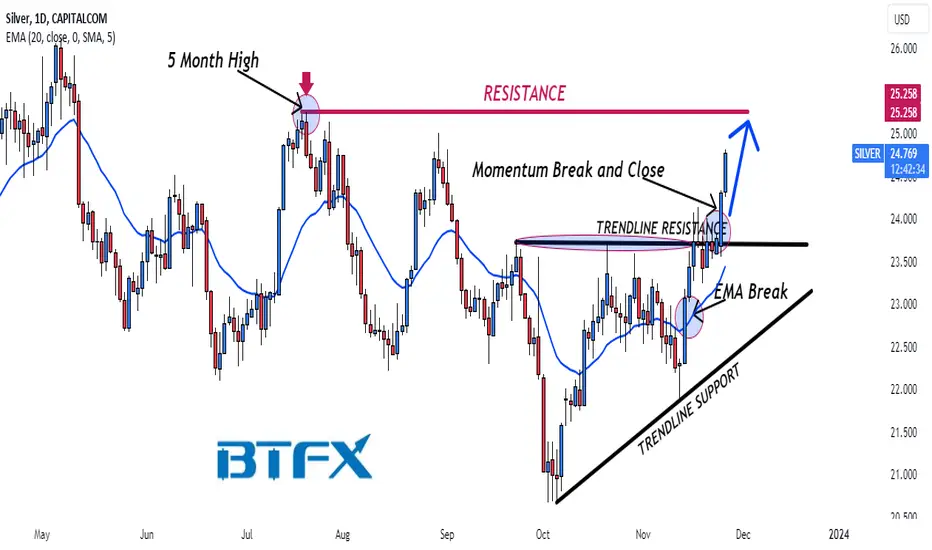
BluetonaFX - SILVER Targeting Five-Month HighHi Traders!
Silver is trading with bullish momentum after its ascending triangle break and is approaching its five-month high at 25.258.
Price Action 📊
After the break and close above the 20 EMA, the market has been trading with bullish momentum and then broke above the ascending triangle's resistance. We are looking for further continuation towards the five-month high at 25.258, and our plan is to buy market dips.
Fundamental Analysis 📰
Important market events this week that could increase the volatility in the US dollar and therefore in commodity prices are likely to be the ISM data and the Federal Reserve's preferred gauge of inflation, the Core PCE data. We will also have US GDP later in the week, and to round off the week, Fed Chair Powell will be speaking.
Support 📉
23.556: PREVIOUS DAY'S LOW
Resistance 📈
25.258: FIVE-MONTH HIGH
Risk ⚠️
No more than 2% of your capital.
Reward 💰
At least 4% of your capital.
Please make sure to click on the like/boost button 🚀 as your support greatly helps.
Trade safely and responsibly.
BluetonaFX
Macro Monday 16~SIlver 2nd in RecessionMacro Monday 16
Silver Performance During and Immediately Post-Recession
Over the past few weeks I have heard many financial analysts recommending holding Gold and Silver for protection against a recession scenario or at least holding some bullion as a diversifier or insurance against currency risk. Today’s Silver Chart and Golds Chart from last weeks Macro Monday are aimed at identifying how good these assets performed during the last 8 recessions.
Last week we covered how gold performed during the last 8 recessions and discovered that gold provides an average return of +7.3% during recession periods whilst the S&P500 averaged a -35.6% decline. It is important to note that Gold’s price declined by -9.3% and -6.3% during 2 of the last 8 recessions, however it performed better than the S&P500 in both those scenarios during which the S&P500 declined -12.7% and -16.3% respectively. Last week’s chart of Gold demonstrated that it can offer protection during recessions whilst also potentially offering an average +7.3% return over those period.
The Chart
Interestingly Silver does not appear to be as protective as Gold during recession periods however it appears to make positive moves post-recession which is valuable to know as timing your silver allocation later in a recession cycle could be benefit your portfolio;
1. During 6 out of the last 8 recession periods Silver has declined in price by an average of -9%.
- This is a lessor performance to Golds positive average of +7.3% over the same period.
- However, Silver declines less than S&P500 which declines on average -35.6% over these same recessionary periods
2. Within a 6 months immediately post-recession Silver has increased in price 7 out of 8 times by an average of +18% (blue areas on chart)
- This provides an argument for diversifying a portion of your gold or cash position into Silver late in a recession or at the end of a recession period.
- Obviously timing this would be difficult however, if you had a Gold position that increased between +7 – 10% during what you believe to be a recession period, it could be beneficial to start allocating a portion of that position to Silver based on the average +18% potential within 6 months after the recession ends. There is no guarantee of course.
The Silver Second Allocation Approach
Based on the price history of Gold and Silver over the last 8 recessions there is an argument to not hold silver at the onset and/or during the recession itself (as silver declines -9% on avg during the recession period).
At the onset and during a recession Gold has a much better record with an average return of +7.3% however, Silver can offer significant returns in the 6 months post-recession with an average return of 18%, thus as we wade closer to the end of a recession an allocation into Silver could put you on the right side of probability. No Guarantees.
The Silver Long Hold Approach
Interestingly if you check the data chart which I will share in the comments, you will see that Silvers overall performance (recession periods including the 6 months post-recession period) is positive with an average of +9.1%. In other words, if you held Silver through the recession period and the 6 months post-recession, the average return is 9.1%. Amazing what an additional 6 months of patience can achieve. This is where there is a potential argument to hold silver from the outset of a recession if you intend to hold it that 6 months post-recession.
When you check Silvers post-recession performance (6 months post-recession), it can historically increase as high as +50.6% thus a Silver allocation does offer that upside potential that Gold does not. This adds to the Silver Long Hold Approach argument however this has to be weighed against a potential -58.3% decline during the recession period (also evident on the chart as the opposite extreme).
Final Word
The safety in Gold during a recession is attractive and the post-recession potential return in silver is hard to ignore. Silver can go down or sideways when gold first starts to increase, this has been the case historically and often gold increases for 18 – 24 months before silver really starts to move and catch up (I will follow up this point with a chart).
I myself lean towards a later recession allocation to silver, lets say we get a 14 - 20% drop in silver with a 5 - 7.3% increase in gold, this could be a window to start building your smaller silver position from your gold or cash holding but for me, the silver position will always be smaller and allocated late into a recession. I want to emphasize there is no right approach, these are just considerations worth pondering about Gold and Silver portfolio allocations during recessions. The ultimate decision is up to you.
I hope both the gold and silver chart provide you with some perspective and help keep you on the right side of probability.
PUKA

Silver - Looking To Sell Pullbacks In The Short TermH1 - Bearish trend pattern.
No opposite signs.
Until the two strong resistance zones hold I expect the price to move lower further after pullbacks.

SILVER Analysis 1Sep2023Silver prices are stuck in the SND area for now and are also in the SR Flip area. The possibility of sideways until the release of the news tonight. the possibility of a bearish correction to the price of 21,500

SILVER Analysis 27Aug2023closing the market in the silver market last week it can be seen that there was confusion, look at the candles that I gave this dotted line. at the beginning of next week there is a possibility of sideways before the price is corrected in the SR Flip area.

SILVER Analysis 20Aug2023if you look at the price movement last week, there is a possibility that a reversal will occur. I still use the Eliot Wave notation a few weeks ago with the assumption that the price will be bullish with the invalid area boundary below. if the area is violated then the elliot wave notation will change and the trend will probably be a complex correction wave.

SILVER Analysis 30July2023With the formation of a new LL in the wave structure, it is certain that the possibility of greater bearish continuation. It is possible that currently a complex correction wave is formed to determine the wave (2) where Wave 2 is always a correction wave. If you want to do a short, you can do it when the price approaches LH

SILVER Analysis 24July2023I see this commodity positively bullish, now the price is stuck in the SND area and I try to provide Fibo Retracement, and the results are quite supporting this analysis to find the long area. There are 2 SND areas that are quite striking here, where the SND area intersects with Fibo 0.618 and 0.236, and the 0.236 Fibo area is also close to the bullish trendline, quite interesting?

SILVER Analysis 19July2023silver's movement still tends to be bullish, although in the last 2 days there has been compression where the candle that is formed is small and lacking in content, but structurally it still forms a new HH. there is still a possibility to continue the bullish trend slowly.

SILVER Analysis 13July2023looking at the analysis based on the elliot notation for silver, it looks like it is currently in the beginning of a bullish trend, you can take part in going long by placing a pending order in the SnD area that has been readjusted according to your analysis.

SILVER Forecast 6July2023if this is an a-b-c correction and wave c is usually the same length as wave a, then there is a high probability that XAG will go down.
This is signaled by the current price at the trendline and strong resistance area. if XAG turns out to respond positively to the trendline and makes a strong bearish signal, then it is likely to go to fibo extension 1.

BluetonaFX - SILVER Support Break OpportunityHi Traders!
We have spotted a potential support break opportunity on the Silver 1D chart. The price action suggests that the market may want to go down to test further levels below. After a double top resistance at 26.129, there was a pullback into a price channel break, and then the market found support at 22.117. There was then a falling three methods candle formation, which is a bearish candlestick pattern.
We are looking for a break and a close below 22.117; if we get this, then we have a first target at 21.500 and a second target at 20.787.
If we do get a break and close below 22.117, then there are buying opportunities just above this level to target the long-term 26.129 resistance.
Please remember to like, follow, and comment to support us.
Your support is appreciated.
BluetonaFX

XAGUSD 31May2023when the price rises more than the light blue line, there is a possibility of reversal and the price will reach the SR Flip area in the short term.

Silver is shorted today
The silver price is currently near US223.75/ounce, and it has fallen by about 1.4% during the day.
If it falls below US223.75/ounce, this will open the way for a further decline in silver prices, and silver prices will continue to be expected for some time to come. The bearish trend scenario.
Currently waiting for the silver price to fall below US223.70/ounce to confirm that the silver price will fall further to the next short target of US223.00/ounce.
Stochastic indicators are currently showing bearish signals, and silver prices will show more bearish possibilities in the coming trading days.
It should be noted that if the silver price breaks through US224.15/ounce, this will push the important resistance level of the silver price to US224.60/ounce, and then try to fall again.
Today's silver price will be between the support level of USD23.50/ounce and the resistance level of USD24.30/ounce.
Silver strategy:
SILVER: sell @23 tp:24.3
Next, I will continue to provide more trading signals, and the weekly profit can reach more than 5K-10Kusd. I need signals to join me as soon as possible!

Silver: Let the show begin…! 🎪Ladies and Gentlemen, step right up and let the show begin! Please welcome silver, our brilliant artistic performer, in the arena that is our chart… See next: a somersault into the orange zone between $24.45 and $25.05 to finish wave iv in orange, followed by a brave downwards leap to complete wave v in orange as well as wave (a) in blue. Watch with bated breath as silver then spirals upwards again, stopped only by the mark at $25.41, where it should rebound and glide further downwards. There is a 30% chance, though, that silver could gain too much upwards momentum and thus soar above the mark at $25.41. In that case, we would expect it to reach a new high in the form of wave alt.x in magenta first before turning downwards again.

A Silver Cup and Handle The chart speaks for itself.
With some luck we could break above the top of cup resistance line and find support on it between here and 2024/25. That is a good move, but id love to be sitting in profit then with the option of riding the longer trend.

BluetonaFX - SILVER CHART IDEAHey Traders,
Our last silver target played out into profit zone and secured with moving stop and protecting profits. It fell short by a few pips for the full range target so the gap remains open. We have identified a structural support level on the chart and expect further support tests to be held well to consider buying from support levels while targeting the open gaps above.
We have a immediate target at 25.295 and a long range target at 25.696.
Please like, comment and follow to support us to help us bring more free content to you all.
BluetonaFX

SILVER to MOON over the next decade(s)There is a REASON Kiyosaki won't shut up about SILVER, and I have found it! MACRO C&H/Bull flag targets are INSANITY, but extremely likely to play out over the next quarter century or so...

silver will be falling in the next weekthe silver XAGUSD will have to make a correction to 21.20$ and maybe to the 21.40 area as well before the continuation of the downtrend to the 20.33 area. also, there is a great probability that the market can go down without making a correction!
that's what I believe. what about you guys? what do you think? tell me your opinion. do you agree or not .??
good luck traders !!

No breakout for Silver yetXagUsd is struggling to breakout. Look like it is making a U-turn. In that case I expect it to drop to 22. Overall I am bullish on Silver this year and long term. One day XAG will breakout $50 level up to $90-$100.
