SILVER - XAGUSD Top-Down Analysis (Long then Short)Hello Traders,
Here is the Top-Down Analysis of SILVER - XAGUSD (Monthly, Weekly, Daily for direction and 4H for entry) for
Week 45 - Nov 02
M > Price moved bullish breaking several structure levels to stop at monthly support now turned resistance and moved down for correction. After a huge impulse we expect price to retrace till 0.382 or 0.5 Fib levels on last impulse. Both levels coincide with monthly resistance which will now act as support.
W > Price dropped in between 0.382 and 0.5 level with weekly candle closing at 0.382 level, this level coincides with daily demand zone. We can see an M formation and expect price to move upwards to test neck and complete formation. In its upward move price pulled up till 0.618 Fib level on bearish impulse and then dropped just short of 0.786 Fib level on weekly bullish impulse.
D > Just like Gold, price has been dropping in consolidation zone of symmetrical triangle (1st drop during Aug-Sept period and 2nd drop now). Price has broken to the downside of 2nd triangle but not pulled back like Gold but it has faced rejection at demand zone. It is respecting downward resistance trend-line. We can see another M formation and price can rise up to test its neck, neck will also coincide with support of triangle, now acting as resistance. However for bullish move beyond this price has 3 barrier to cross, daily supply zone (where price is currently), downward resistance trend-line and daily resistance.
Hence in relation with Gold, Silver can continue to drop till 0.5 Fib level.
As per COT SILVER saw closure of both Long and Short, with net positions staying in improved state. We have seen silver reduce Short position from 47K in month of July to 32K now. Silver enhanced its position during the said week but weakened last week.
4H > We can see that price created an inverted H & S and pulled up breaking its neck. Price is currently testing support level as resistance.
Pair Correlation > Silver has positive correlation with Gold and AUDUSD.
Thank You
AP17FX
Silveridea

SILVER - XAGUSD Top-Down AnalysisHello Traders,
Here is the Top-Down Analysis of SILVER - XAGUSD (Monthly, Weekly, Daily for direction and 4H for entry) for
Week 43 - 19 Oct
M > Price moved bullish breaking several structure levels to stop at monthly support now turned resistance and moved down for correction. After a huge impulse we expect price to retrace till 0.382 or 0.5 Fib levels on last impulse. Both levels coincide with monthly resistance which now act as support.
W > Price dropped in between 0.382 and 0.5 level with weekly candle closing at 0.382 level, this level coincides with daily demand zone. Since then price is making upward move. We can see an M formation and expect price to continue with upward move to test neck and complete formation. Neck is few pips below daily supply zone created during last consolidation.
D > Price is creating HH and HL on its way up and with impulsive candle had broken and surpassed daily support/ demand zone turned resistance but dropped to create next LL. Price is moving in a triangle.
As per COT SILVER saw addition of both Long and Short, but net positions reduced slightly whereas Commercials again saw lowest Long Position for this year, with improvement in open interest Silver enhanced its position for the said week. Silver however weakened last week.
4H > Price is making HH and HL and is facing rejection at resistance created by 4H supply zone. Due to its correlation with Gold we can expect price to drop before continuing its upward move for our target. It can drop to test 0.382 Fib level again.
Pair Correlation > Silver has positive correlation with EURUSD, EURJPY, AUDUSD, AUDCAD and Gold and negative correlation with USDCHF.
This was my Idea and I hope you find it useful. If you find the analysis of help please leave a LIKE and FOLLOW for receiving all updates during the week. In the comment section you can share your view and ask questions.
Thank You
AP17FX

XAGUSD (SILVER) SELLING FROM RESISTANCE ZONE !!! As we see Silver is rejecting from this zone so we are sell this pair with proper low risk and higher rewards
we appreciate ur likes and comments and keep us update via ur trading ideas so this will help many others
Follow us for more new updated trades

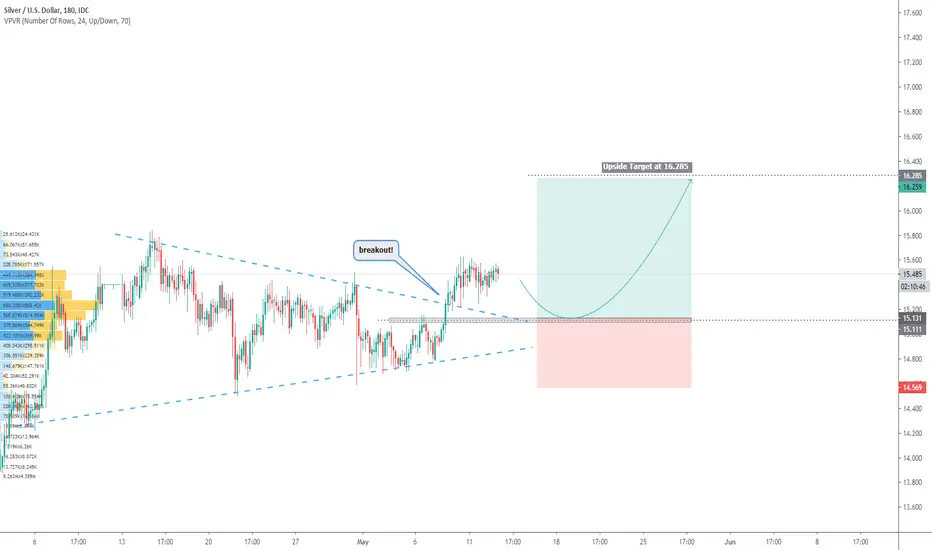
BUYING XAGUSD SILVER ON DIPS !!!As we see a bullish breakout we are in buying silver also have look on our gold chart bother we are looking for great profits with small risk
and higher rewards a a great love with thanks that you push like and comment follow us for more
updates on all analysis

SILVER - XAGUSD Top-Down AnalysisHello Traders,
Here is the Top-Down Analysis of SILVER - XAGUSD (Monthly, Weekly, Daily for direction and 4H for entry) for
Week 42 - 12 Oct
M > Price moved bullish breaking several structural levels to stop at monthly support now turned resistance and moved down for correction. After a huge impulse we expect price to retrace till 0.382 or 0.5 Fib levels on last impulse. Both levels coincide with monthly resistance which now act as support.
W > Price dropped in between 0.382 and 0.5 level with weekly candle closing at 0.382 level, this level coincides with daily demand zone. Since then price is making upward move. We can see an M formation and expect price to continue with upward move to test neck and complete formation. Neck is few pips below daily supply zone created during last consolidation.
D > Price is creating HH and HL on its way up and with impulsive daily candle has broken and surpassed daily support/ demand zone which now would have been a resistance. Next structure level is neck of M formation followed by daily supply zone.
As per COT SILVER saw addition of both Long and Short, increasing net positions whereas Commercials saw lowest Long Position for this year, making Silver improving its position for the said week. Silver has gained more strength last week.
4H > We do not see any loss of momentum at close of market and expect price to continue with upward move to test our target and complete M formation.
This was my Idea and I hope you find it useful. If you find the analysis of help please leave a LIKE and FOLLOW for receiving all updates during the week. In the comment section you can share your view and ask questions.
Thank You
AP17FX

SILVER battling with 200 EMA in a rising channelSILVER
Silver is tend to move along with Gold but the daily moving range is higher than GOLD
Today the upside momentum has stopped by the Strong 200 Exponential moving average same as like the Gold.
We can expect short term rebound after reaching the lower side trend line and may move towards 200EMA. For the longer term bullish trend Silver has to break the trend line as well as the upside trend line
From my point of view it will fall after reaching the 200 EMA. if the lower side of the trend line was broken we can expect more number of sellers will come to move this metal below 22.000
Give a thumbs up if you found this idea useful
Follow our profile to get regular market updates

SILVER buy signals.SILVER, D1: Support line + Side of Bollinger bands + Hidden divergence + Oversold + Hammer

SILVER short trade ideaPlan: support level breakout --> wait for the price to bounce off from resistance level --> wait for the rejection candle pattern to form e.g. bearish engulfing, pinbar, etc --> SELL
**Disclaimer** the content on this analysis is subject to change at any time without notice, and is provided for the sole purpose of assisting traders to make independent investment decisions.
Traders!! if you like my ideas and do take the same trade as I do, please write it in a comment so we can manage the trade together.
_____________________________________________________________________________________________________________________
Thank you for your support ;)
GWBFX

SILVER 1D-TIMEFRAME ANALYSIS 🥈SILVER 1D-TIMEFRAME ANALYSIS
Hello ladies and gentlemen
My idea the SILVER continues to downtrend
Targets
20
19
I hope my idea is clear
Support me by like and share
Good luck

SILVER - Bullish Candle Today!RSI and Stochastic are bullish.
Today's bullish candle suggests that we will go test the upper yellow resistance.


silver/siuHello traders, here is the analysis from our team :
buy:22.025
target: 24.100
stop loss: 20.025
Let us know in the comment section below if you have any questions.😉

SilverBuy Silver using three Trend lines yellow, green and red trend lines . Buy at 19.3 price near the green line .Target of 19.98 around 3.51% - Yellow line. Stop Loss is the red line around 0.45% If it starts breaking the red trend line . You can also take a Short Position when it crosses red line. . Then it can go Down. Also RSI there seems more room for upward movement. For risk of 0.45 % there is an upside of 3.51%

SILVER IDEA 2020 - 2025Silver looks to be breaking out of a shorterm downward resistance and has recoved from a false breakdown of the primary support line. It looks to me as if the next target will be $21.25 before a pullback occurs bouncing off the converging lines, before a breakout to $26.25 and another consolidation before reaching new highs of $50 and beyond later in the decade.

SILVER long trade ideaPlan: wait for the price to bounce off from trendline or support level --> wait for the rejection candle pattern to form e.g. bullish engulfing, pinbar, etc --> BUY
**Disclaimer** the content on this analysis is subject to change at any time without notice, and is provided for the sole purpose of assisting traders to make independent investment decisions.
Traders!! if you like my ideas and do take the same trade as I do, please write it in a comment so we can manage the trade together.
_____________________________________________________________________________________________________________________
Thank you for your support ;)
GWBFX

SILVER long trade ideaplease take a look at my last analysis on silver (link attached below!), the price was reached our final target and here's my newest idea for this pair, enjoy! don't forget to use proper risk management & do your own research .... good luck!
Plan: resistance level breakout --> wait for the price to bounce off from support level --> wait for the rejection candle pattern to form e.g. bullish engulfing, pinbar, etc --> BUY
**Disclaimer** the content on this analysis is subject to change at any time without notice, and is provided for the sole purpose of assisting traders to make independent investment decisions.
Traders!! if you like my ideas and do take the same trade as I do, please write it in a comment so we can manage the trade together.
_____________________________________________________________________________________________________________________
Thank you for your support ;)
GWBFX

SILVER long trade ideaPlan: wait for the price to bounce off from support level --> wait for the rejection candle pattern to form e.g. bullish engulfing, pinbar, etc --> BUY
**Disclaimer** the content on this analysis is subject to change at any time without notice, and is provided for the sole purpose of assisting traders to make independent investment decisions.
Traders!! if you like my ideas and do take the same trade as I do, please write it in a comment so we can manage the trade together.
_____________________________________________________________________________________________________________________
Thank you for your support ;)
GWBFX


SILVER short trade ideaon my last analysis, I predicted price to go up and it happens (link attached below!), and now we are seeing price playing inside a bullish trendline channel. on my perspective market structure still bullish but we might have a chance to go short if price respected to 17.89 resistance level, so here's the plan
Plan: wait for the price to bounce off from resistance level --> wait for the rejection candle pattern to form e.g. bearish engulfing, pinbar, etc --> SELL
**Disclaimer** the content on this analysis is subject to change at any time without notice, and is provided for the sole purpose of assisting traders to make independent investment decisions.
Traders!! if you like my ideas and do take the same trade like i do, please write it in comment so we can manage the trade together.
_____________________________________________________________________________________________________________________
Thank you for your support ;)
GWBFX

SILVER long trade ideaPlan: wait for the price to bounce off from support level --> wait for the rejection candle pattern to form e.g. bullish engulfing, pinbar, etc --> BUY
**Disclaimer** the content on this analysis is subject to change at any time without notice, and is provided for the sole purpose of assisting traders to make independent investment decisions.
Traders!! if you like my ideas and do take the same trade like i do, please write it in comment so we can manage the trade together.
_____________________________________________________________________________________________________________________
Thank you for your support ;)
GWBFX
SILVER (US$ / OZ) Monthly, Weekly, & DailyDates in the future with the greatest probability for a price high or price low.
The Djinn Predictive Indicators are simple mathematical equations. Once an equation is given to Siri the algorithm provides the future price swing date. Djinn Indicators work on all charts, for any asset category and in all time frames. Occasionally a Djinn Predictive Indicator will miss its prediction date by one candlestick. If multiple Djinn prediction dates are missed and are plowed through by same color Henikin Ashi candles the asset is being "reset". The "reset" is complete when Henikin Ashi candles are back in sync with Djinn price high or low prediction dates.
One way the Djinn Indicator is used to enter and exit trades:
For best results trade in the direction of the trend.
The Linear Regression channel is used to determine trend direction. The Linear Regression is set at 2 -2 30.
When a green Henikin Ashi candle intersects with the linear regression upper deviation line (green line) and both indicators intersect with a Djinn prediction date a sell is triggered.
When a red Henikin Ashi candle intersects with the linear regression lower deviation line (red line) and both indicators intersect with a Djinn prediction date a buy is triggered.
This trading strategy works on daily, weekly and Monthly Djinn Predictive charts.
Trades made when the monthly, weekly and daily arrows are pointing in the same direction are the most profitable.
This is not trading advice. Trade at your own risk.

SILVER ROADMAP (long trade idea)I see an opportunity to go long if the price is able to bounce off at 14.650 support level, please wait for price deceleration on the lower timeframe before placing any buy order
**Disclaimer** the content on this analysis is subject to change at any time without notice, and is provided for the sole purpose of assisting traders to make independent investment decisions.
Traders!! if you like my ideas and do take the same trade like i do, please write it in comment so we can manage the trade together.
_____________________________________________________________________________________________________________________
Thank you for your support ;)
GWBFX

SILVER long, daytrade idea Plan : resistance level breakout --> wait for the price to bounce off from support level (previous resistance level) --> wait for the rejection candle pattern to form e.g. bullish engulfing, pinbar, etc --> BUY
**Disclaimer** the content on this analysis is subject to change at any time without notice, and is provided for the sole purpose of assisting traders to make independent investment decisions.
Traders!! if you like my ideas and do take the same trade like i do, please write it in comment so we can manage the trade together.
_____________________________________________________________________________________________________________________
Thank you for your support ;)
GWBFX
